Differences in urodynamic voiding variables recorded by
conventional cystometry and ambulatory monitoring in
symptomatic women
_______________________________________________
Juan Pablo Valdevenito
1, Ann Leonard
2, Clive J. Griffiths
3, Robert Pickard
4, Christopher Harding
21Servicio de Urología, Hospital Clínico Universidad de Chile. Santiago, Chile; 2Urology Department,
Newcastle upon Tyne Hospitals NHS Foundation Trust, Freeman Hospital. Newcastle upon Tyne, Uni-ted Kingdom; 3Regional Medical Physics Department, Newcastle upon Tyne Hospitals NHS Foundation
Trust, Freeman Hospital, Newcastle upon Tyne, United Kingdom; 4Institute of Cellular Medicine,
New-castle University, NewNew-castle upon Tyne, United Kingdom
ABSTRACT
ARTICLE
INFO
______________________________________________________________ ______________________
Objectives: To determine whether there are differences in pressure and flow measure-ments between conventional cystometry (CONV) and ambulatory urodynamic moni-toring (AMB) in women with overactive bladder syndrome and urinary incontinence.
Materials and Methods: Retrospective study which included female subjects who un-derwent both CONV (with saline filling medium) and AMB, separated by less than 24 months, not using medication active on the lower urinary tract and without history of prior pelvic surgery. Both tests were carried out in compliance with the International Continence Society standards. The paired Student’s t test was used to compare con-tinuous variables. Bland-Altman statistics were used to assess the agreement of each variable between both studies.
Results: Thirty women with a median (range) age of 50 (14 - 73) years met the inclu-sion criteria. AMB was carried out at a mean (SD) of 11 (6) months after CONV. Mea-surements of pves and pabd at the end of filling, and Qmax were significantly higher from AMB recordings. There were no differences in pdet at the end of filling, pdetQmax or pdetmax during voiding, nor significant difference in Vvoid.
Conclusions: We provide previously undocumented comparative voiding data between CONV and AMB for patients who most commonly require both investigations. Our fin-dings show higher values of Qmax but similar values of pdetQmax measured by AMB which may partly reflect an overall lower catheter caliber, physiological filling but perhaps also more ‘normal’ voiding conditions.
Key words:
Monitoring, Ambulatory; Complementary Therapies; Female; Urodynamics
Int Braz J Urol. 2014; 40: 666-75
_____________________
Submitted for publication: January 01, 2013
_____________________
Accepted after revision: November 09, 2013
INTRODUCTION
Ambulatory urodynamic monitoring (AMB) with natural filling is a useful additional test for patients with lower urinary tract symp-toms that cannot be explained by findings from a conventional cystometry (CONV) with
urodynamic measurements (1). Pressure measure-ments during AMB are generally obtained using catheter-mounted microtip transducers positioned in the bladder and rectum rather than air or fluid filled lines connected to external transducers. These allow greater mobility but are more prone to artifact. Allowing the patient to be mobile is a key feature of AMB but the frequent changing of position alters the relative height of the rectal and bladder transducers making frequent signal qua-lity control during bladder filling necessary. The change from non-physiological filling to natural filling may alter detrusor contractility (2,6) and cystometric capacity (7). The previous lack of si-multaneous uroflow recording during AMB which hampered interpretation of the voiding phase has been corrected in current devices that include this facility (4,5).
The published literature regarding measu-rement variation suggests that values for voiding pressure and maximum flow rate are higher with AMB compared to CONV, and that voided volu-me is lower (2-4). However, a more recent study in men with possible bladder outlet obstruction with integrated flow rate recording showed no difference in detrusor pressure at maximum flow (pdetQmax) (5).
In view of these conflicting findings we set out to determine whether there were any differen-ces in voiding pressure and flow measurements between CONV and AMB with integrated flow rate recording that may be attributable to the diffe-rent filling rates. We focused on the main patient group in whom AMB is requested: women with overactive bladder syndrome and urinary incon-tinence. This study will not evaluate the filling phase results.
MATERIALS AND METHODS
Subjects
This was a retrospective cohort study whi-ch included subjects assessed over a period of eigth years with the following criteria: 1) Female sex, 2) Investigation for overactive bladder and urinary incontinence, 3) Underwent both CONV and AMB, 4) Interval between CONV and AMB of
less than 24 months, 5) Saline filling medium used for CONV (contrast medium may alter Qmax), 6) Not using medication active on the lower urinary tract and 7) No history of prior pelvic surgery. All patients provided written informed consent with guarantees of confidentiality.
Conventional Cystometry
The test was carried out in compliance with International Continence Society (ICS) standards current at the time of testing (8). Bladder and rec-tal pressures were measured with a fluid-filled 4Fr urethral catheter and a 4Fr catheter with the tip covered with a vented fingercot, respectively. The pressure lines were connected to external trans-ducers placed at the upper edge of the symphysis pubis and zeroed to atmospheric pressure. Filling through a 10Fr urethral catheter was carried out in supine position with 0.9% saline, at a rate of 100 mL/min. Voiding occurred in the sitting position with all catheters in situ.
Ambulatory Urodynamic Monitoring
The test was carried out according to In-ternational Continence Society (ICS) standards (1) using an in-house recording system (Urolog®, Re-gional Medical Physics Department, Freeman Hos-pital, Newcastle upon Tyne, UK). Bladder and rec-tal pressures were measured with microtransducers mounted on the tips of 6 Fr urethral and rectal catheters (Gaeltec Ltd, Isle of Skye, UK) the latter covered by a vented fingercot. These were calibra-ted to atmospheric pressure and to 30cmH2O. Both were connected to a portable device that recorded data at a frequency of 1Hz. Filling was carried out physiologically by means of allowing patients to drink sufficient fluid to enable multiple fill-void cycles to be recorded over the course of three hours. Voiding occurred in private, in the sitting position, with maximum flow rate and voided vo-lume measured using a standard gravimetric urine flowmeter.
Measurements recorded
All CONV measurements were done first and AMB measurements were done blinded to the CONV results. We recorded measurements of intravesical, abdominal (rectal) and subtracted vesical (detrusor) pressures at the end of filling (pves, pabd, pdet), detrusor pressure at maximum flow rate (pdetQmax), maximum flow rate (Qmax), maxi-mum detrusor pressure (pdetmax) and voided volume (Vvoid). When more than one fill–void cycle had been recorded during AMB, measurements from individual cycles were summed and the average taken. Free flows were not considered due to the relative high number of patients that needed to urinate before CONV or that voided low volumes. The following derived parameters were calculated: urethral resistance (UR = pdetQmax / Qmax2), bladder
outlet obstruction index (BOOI = pdetQmax – 2 Qmax) and bladder contractility index (BCI = pdetQmax + 5 Qmax) (9). The presence of after-contractions, de-fined as a terminal rise in detrusor pressure not accompanied by an increase in flow rate, was also examined. No systematic maneuver to exclude ar-tifacts from true after-contractions was done (10).
Statistical analysis
The paired Student’s t test was used to compare the results of CONV and AMB conti-nuous variables. Data were entered in the Stata 8.1 program (Stata Corporation, 2003) and statis-tical significance was assumed if p<0.05.
Bland-Altman statistics were used to as-sess the agreement of each variable between
CONV and AMB. Briefly, the difference between the 2 tests was calculated in each patient. There-after, a graphical plot of the mean of these diffe-rences estimated systematic error (bias) from one test to the other. The standard deviation (SD) of the differences provided an estimate of random variation (11).
RESULTS
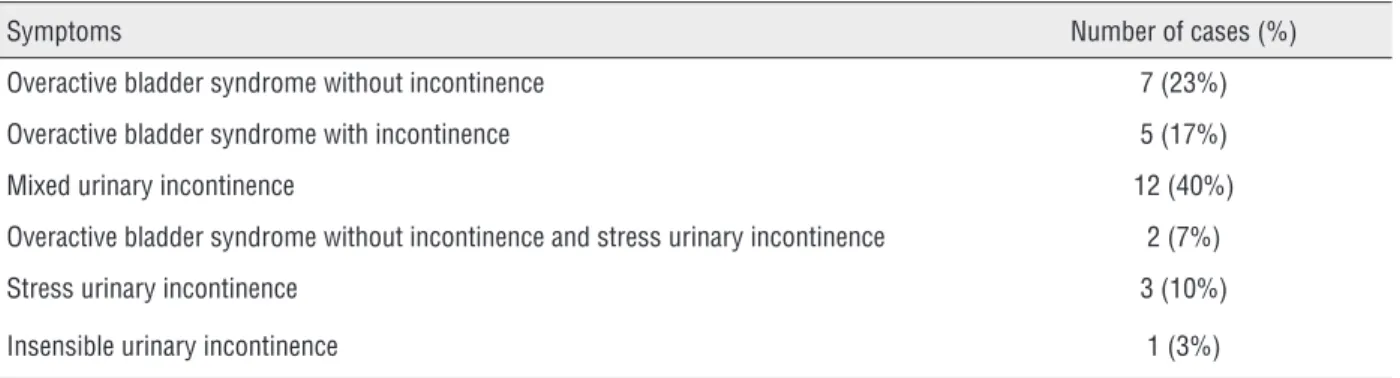
We identified 30 women being investiga-ted for overactive bladder syndrome and urinary incontinence who met the inclusion criteria, who-se urinary incontinence could not be categorized by CONV. They had a median (range) age of 50 (14-73) years and AMB was carried out at a mean (SD) of 11 (6) months after CONV. None had seve-re genital organ prolapse. The median number of voids analyzed from AMB was 2 (range 1-4) with 9 (10%) of a total of 86 voids being excluded from measurement due to bladder line displacement (n=5) or Vvoid < 150 mL (n=4). The main symptoms presented by the patients are given in Table-1.
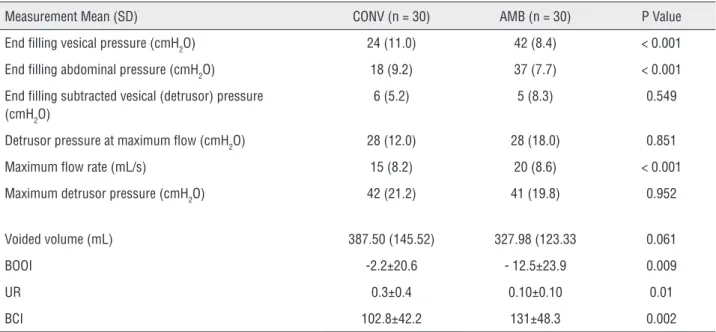
When comparing the results of CONV and AMB, measurements of pves andpabd at the end of filling, and Qmax were significantly higher from AMB recordings. There were no differences in pdet at the end of filling or in pdetQmax and pdetmax during voiding. There was no statistically signi-ficant difference in Vvoid. Related to the difference in measurements of Qmax, all derived urodynamic parameters were significantly different between CONV and AMB. Both BOOI and UR derived from AMB measurements were lower, and BCI was hi-gher (Table-2). Figure-1 shows simple plots of the
Table 1 - Main symptoms presented by 30 women eligible for urodynamic test review.
Symptoms Number of cases (%)
Overactive bladder syndrome without incontinence 7 (23%)
Overactive bladder syndrome with incontinence 5 (17%)
Mixed urinary incontinence 12 (40%)
Overactive bladder syndrome without incontinence and stress urinary incontinence 2 (7%)
Stress urinary incontinence 3 (10%)
Table 2 - Summary statistics for intra-individual differences in urodynamic measurements during conventional cistometry (CONV) and ambulatory urodynamic monitoring (AMB).
Measurement Mean (SD) CONV (n = 30) AMB (n = 30) P Value
End filling vesical pressure (cmH2O) 24 (11.0) 42 (8.4) < 0.001
End filling abdominal pressure (cmH2O) 18 (9.2) 37 (7.7) < 0.001
End filling subtracted vesical (detrusor) pressure (cmH2O)
6 (5.2) 5 (8.3) 0.549
Detrusor pressure at maximum flow (cmH2O) 28 (12.0) 28 (18.0) 0.851
Maximum flow rate (mL/s) 15 (8.2) 20 (8.6) < 0.001
Maximum detrusor pressure (cmH2O) 42 (21.2) 41 (19.8) 0.952
Voided volume (mL) 387.50 (145.52) 327.98 (123.33 0.061
BOOI -2.2±20.6 - 12.5±23.9 0.009
UR 0.3±0.4 0.10±0.10 0.01
BCI 102.8±42.2 131±48.3 0.002
BOOI = Bladder Outlet Obstruction Index; UR= Urethral Resistance; BCI = Bladder Contractility Index
Figure 1 - Simple plot of the results of conventional cystometry (CONV) against ambulatory urodynamic monitoring (AMB) and plot of the difference between the methods against their mean (Bland-Altman method). A) Detrusor pressure at maximum flow rate, B) Maximum detrusor pressure, C) Maximum flow rate, D) Voided volume
A
results of AMB against CONV and Bland-Altman plot for pdetQmax, pdetmax, Qmax and Vvoid . Figure 2 sho-ws Bland-Altman plot for BOOI. There was only 1 patient with a clear after-contraction in CONV (of 32 cmH2O versus pdetmax of 30 cmH2O) and no clear after-contractions recorded on AMB.
DISCUSSION
We sought to determine whether measured voiding variables from CONV and AMB differed amongst women being investigated for bladder storage symptoms. The study has the following
Pdet. Qmax - XY Plot Pdet. Qmax - BA Plot
CONV (cmH20)
AMB (cmH
2
0)
AMB-CONV (cmH
2
0)
B
C
D
Pdet.max - XY Plot
Qmax - XY Plot
Vvoid - XY Plot
Pdet.max - BA Plot
Qmax - BA Plot
Pdet. Qmax - BA Plot
CONV (cmH20)
CONV (ml/s)
CONV (ml)
AMB (cmH
2
0)
AMB (ml/s)
AMB (ml)
(AMB+CONV)/2(cmH20)
(AMB+CONV)/2(cmH20)
(AMB+CONV)/2(cmH20)
AMB-CONV (cmH
2
0)
AMB-CONV (cmH
2
0)
AMB-CONV (cmH
2
strengths: 1) It studies a homogenous patient po-pulation from the commonest group undergoing AMB, 2) It uses a standard ICS approved technique with proper quality control using the same tech-nique each time, 3) AMB was performed with syn-chronous flow recording, 4) AMB measurements were done blinded to the CONV results and 5) No irreversible treatment was given between studies. The limitations of the study are the following: 1) Retrospective study, 2) AMB was always carried
out after CONV rather than in a randomized order, 3) Only women who had a non-diagnostic CONV were included, 4) The studies were separated by a variable time period with the possibility of chan-ges in disease status and 5) Included women who did not generally have symptomatic voiding dys-function.
The subjects in the study varied in age. This has the benefit of making the results gene-rable across the variety of age groups that require
Figure 2 - Bladder outlet obstruction index (BOOI): simple plot of the results of conventional cystometry (CONV) against ambulatory urodynamic monitoring (AMB) and plot of the difference between the methods against their mean (Bland-Altman method).
A
B
AMB
CONV BOOI - XY Plot
BA Plot BOOI
AMB + CONV/2
urodynamic evaluation of voiding. Due to small numbers we were unable to describe variation in voiding measurements between age groups al-though this should not affect our results since we examined intra-individual comparisons.
It is likely that the higher pves andpabd re-corded at the end of filling during AMB reflect the predominantly upright position of subjects during the storage phase for AMB. The differen-ce in transdudifferen-cer location, pressure measurement technique, and differential changes in the relative height of the tips of bladder and rectal catheters may have contributed to this difference. Supine filling during CONV results in a negative offset from the reference point of several cmH2O owing to the distance between the bladder and rectal ca-theter tips. In AMB the microtip transducers are zeroed individually to atmospheric pressure and record true bladder and rectal pressures related to the position of the catheter tips (2).
Careful quality control during both CONV and AMB adhering to International Continen-ce Society standards (1,8) should be effective in minimizing any systematic error caused by these differences in pves and pabd in subtracted bladder (detrusor) pressure measurements. Reassuringly this was the case for our study with no bias in measurements of pdetmax and pdetQmax between CONV and AMB.
Our protocol for AMB requires synchroni-zed recording of urinary flow rate by direct wired connection of the uroflowmeter output to the am-bulatory measurement box through an auxiliary channel. Pressure and flow recordings can then be displayed continuously for measurement. The higher values for Qmax seen with AMB (on average 33%) might be explained at least partially by the presence of both 4Fr and 10Fr urethral catheters during CONV. Some evidence in support of this contention comes from intra-individual compari-son of Qmax with and without the presence of a urodynamic measurement catheter with studies in healthy (12) and symptomatic women (13-15) showing relative differences of between 28% and 64% using 6Fr, 7Fr and 9Fr catheters.
Another potential factor influencing flow rate is Vvoid (16,17). A CONV study comparing voi-ding measurements in women at bladder volumes
close to modal Vvoid from frequency/volume charts with Vvoid at maximum cystometric capacity sho-wed that Qmax was lower at the smaller volume, whilst pdetQmax was the same for both volumes (18). Our study showed no statistical difference in Vvoid between CONV and AMB. Additionally compari-son of the average Vvoid on CONV (390 mL) and that from AMB (330 mL) on the Liverpool nomo-gram would predict that Qmax would be 9% higher during CONV (17). From this background it seems unlikely that the trend to lower Vvoid during AMB was a factor in the observed higher values for Qmax resulted. Moreover, Groutz et al. found higher Qmax in symptomatic women (mainly patients with uri-nary incontinence) with voided volumes over 400 mL (13). It therefore appears unlikely that lower values of maximum flow rate in CONV might be explained by bladder overdistension as stated by other authors (7).
Bladder mechanical power is directly pro-portional to detrusor pressure and urinary flow. During micturition, bladder detrusor does not ge-nerate a specific pressure or flow, but rather provi-des mechanical power. Bladder outflow resistance determines how such power is divided into pres-sure and flow (19). Our results showing on ave-rage no differences for pdetmax and pdetQmax betwe-en CONV and AMB and higher Qmax in AMB are consistent of stronger bladder contractions during AMB. However the presence of both 4Fr and 10Fr catheters during CONV may have been responsible for lower Qmax, by reducing urethral cross sectional area although if this was the case a compensatory increase in voiding pressure would be expected.
Considering the sample size and the stan-dard deviations with CONV and AMB of the not significant results pdetQmax, pdetmax and Vvoid, this stu-dy had an 80% statistical power to detect a diffe-rence between means of 11 cmH2O for pdetQmax, 15 cmH2O for pdetmax and 99 mL for Vvoid, with a signi-ficance level (alpha) of 0.05 (two-tailed).
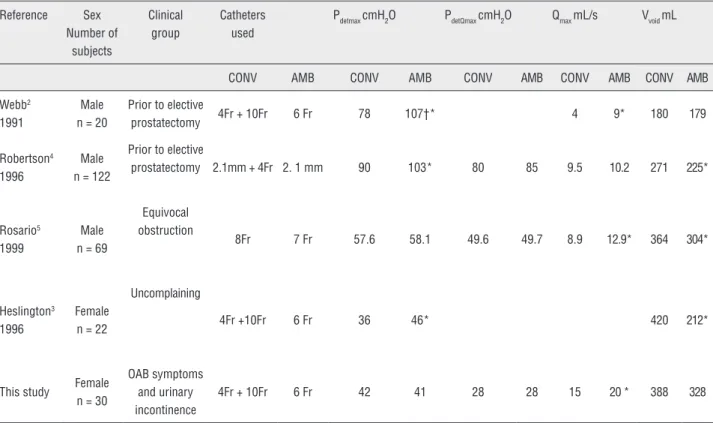
Table 3 - Comparative urodynamic measurements from conventional cystometry (CONV) and ambulatory urodynamic monitoring (AMB).
Reference Sex
Number of subjects
Clinical group
Catheters used
Pdetmax cmH2O PdetQmax cmH2O Qmax mL/s Vvoid mL
CONV AMB CONV AMB CONV AMB CONV AMB CONV AMB
Webb2
1991
Male n = 20
Prior to elective
prostatectomy 4Fr + 10Fr 6 Fr 78 107†* 4 9* 180 179
Robertson4
1996
Male n = 122
Prior to elective
prostatectomy 2.1mm + 4Fr 2. 1 mm 90 103* 80 85 9.5 10.2 271 225*
Rosario5
1999
Male n = 69
Equivocal obstruction
8Fr 7 Fr 57.6 58.1 49.6 49.7 8.9 12.9* 364 304*
Heslington3
1996
Female n = 22
Uncomplaining
4Fr +10Fr 6 Fr 36 46* 420 212*
This study Female
n = 30
OAB symptoms and urinary incontinence
4Fr + 10Fr 6 Fr 42 41 28 28 15 20 * 388 328
OAB = Overactive bladder; † = Contraction pressure; * = Statistically significant difference
outlet obstruction (2,4) and uncomplaining wo-men (3). Our results showing no difference in de-trusor pressure measurements are consistent with a later study which also used an AMB device with integrated flow rate recording but in men with equivocal obstruction on CONV (5). Considering the very low rate of occurrence of after contrac-tions in our study, we have no evidence to support the speculation voiced by Heslington et al. that the higher values of pdet during voiding measured by older devices were due to misinterpretation of the commonly observed after-contractions in the absence of synchronized flow recording (3). Ho-wever it should be noted that Rosario et al. found significant more after-contractions on AMB than on CONV and pressure rises of the after-contrac-tions on AMB were higher than pdetmax of the same patients (5).
Findings from theses regarding differences in Qmax were inconsistent, with two studies finding higher values from AMB (2,5), and one study no
difference (4). It should be noted that the tested population for these studies was men with suspec-ted outlet obstruction. The different patient group and consequent overall higher flow rates in our study makes comparison difficult although it is noted that the trend in all studies is toward higher Qmax measurements from AMB.
Differences in Vvoid again showed a consis-tent trend towards lower values in AMB reflecting the known difference between voided volumes found on a voiding diary and maximum cysto-metric capacity on CONV with non-physiological filling (3-5). The lack of a statistically significant difference in our study and that from Webb et al. (2) may represent a change in AMB technique with better encouragement of fluid intake.
CONCLUSIONS
findings are of value since they provide previously undocumented comparative intra-individual voi-ding data between CONV and AMB for the patient group who most commonly require both investi-gations as part of their diagnostic assessment. We have confirmed that current AMB devices which allow real-time quality control and synchronous uroflowmetry provide reliable pressure measure-ment. Clinicians should however be aware that measurements from AMB recordings give higher values of Qmax but similar values for pdetQmax which may partly reflect an overall lower catheter ca-liber, physiological filling but perhaps also the more ‘normal’ voiding conditions. A prospective study that controls urethral catheters calibre and voided volume is required to clarify the effect of bladder filling rates on voiding parameters among these patients.
ABBREVIATIONS
AMB = Ambulatory urodynamic monitoring
CONV = Conventional cystometry
pves = Intravesical pressure
pabd = Abdominal pressure
pdet = Detrusor pressure
pdetQmax = Detrusor pressure at maximum flow rate
Qmax = Maximum flow rate
pdetmax = Maximum detrusor pressure
Vvoid = Voided volume
UR = Urethral resistance
BOOI = Bladder outlet obstruction index
BCI = Bladder contractility index
CONFLICT OF INTEREST
None declared.
REFERENCES
1. van Waalwijk van Doorn E, Anders K, Khullar V, Kulseng-Hanssen S, Pesce F, Robertson A, et al.: Standardisation of ambulatory urodynamic monitoring: Report of the Standardisation Sub-Committee of the International Continence Society for Ambulatory Urodynamic Studies. Neurourol Urodyn. 2000; 19: 113-25.
2. Webb RJ, Griffiths CJ, Zachariah KK, Neal DE: Filling and voiding pressures measured by ambulatory monitoring and conventional studies during natural and artificial bladder filling. J Urol. 1991; 146: 815-8.
3. Heslington K, Hilton P: Ambulatory monitoring and conventional cystometry in asymptomatic female volunteers. Br J Obstet Gynaecol. 1996; 103: 434-41.
4. Robertson AS, Griffiths C, Neal DE: Conventional urodynamics and ambulatory monitoring in the definition and management of bladder outflow obstruction. J Urol. 1996; 155: 506-11.
5. Rosario DJ, MacDiarmid SA, Radley SC, Chapple CR: A comparison of ambulatory and conventional urodynamic studies in men with borderline outlet obstruction. BJU Int. 1999; 83: 400-9.
6. Webb RJ, Griffiths CJ, Ramsden PD, Neal DE: Measurement of voiding pressures on ambulatory monitoring: comparison with conventional cystometry. Br J Urol. 1990; 65: 152-4. 7. Vereecken RL, Van Nuland T: Detrusor pressure in ambulatory
versus standard urodynamics. Neurourol Urodyn. 1998; 17: 129-33.
8. Schäfer W, Abrams P, Liao L, Mattiasson A, Pesce F, Spangberg A, et al.: Good urodynamic practices: uroflowmetry, filling cystometry, and pressure-flow studies. Neurourol Urodyn. 2002; 21: 261-74.
9. Abrams P: Bladder outlet obstruction index, bladder contractility index and bladder voiding efficiency: three simple indices to define bladder voiding function. BJU Int. 1999; 84: 14-5.
10. Cho SY, Yi JS, Park JH, Jeong MS, Oh SJ: Detrusor after-contraction is associated with bladder outlet obstruction. Neurourol Urodyn. 2011; 30: 1361-5.
11. Bland JM, Altman DG: Statistical methods for assessing agreement between two methods of clinical measurement. Lancet. 1986; 1: 307-10.
12. Baseman AG, Baseman JG, Zimmern PE, Lemack GE: Effect of 6F urethral catheterization on urinary flow rates during repeated pressure-flow studies in healthy female volunteers. Urology. 2002; 59: 843-6.
13. Groutz A, Blaivas JG, Sassone AM: Detrusor pressure uroflowmetry studies in women: effect of a 7Fr transurethral catheter. J Urol. 2000; 164: 109-14.
14. Scaldazza CV, Morosetti C: Effect of different sized transurethral catheters on pressure-flow studies in women with lower urinary tract symptoms. Urol Int. 2005; 75: 21-5. 15. Costantini E, Mearini L, Biscotto S, Giannantoni A, Bini V,
Porena M: Impact of different sized catheters on pressure-flow studies in women with lower urinary tract symptoms. Neurourol Urodyn. 2005; 24: 106-10.
17. Haylen BT, Ashby D, Sutherst JR, Frazer MI, West CR: Maximum and average urine flow rates in normal male and female populations--the Liverpool nomograms. Br J Urol. 1989; 64: 30-8.
18. Groen J, van Mastrigt R, Bosch R: Factors causing differences in voiding parameters between conventional and ambulatory urodynamics. Urol Res. 2000; 28: 128-31.
19. Schäfer W: Principles and clinical application of advanced urodynamic analysis of voiding function. Urol Clin North Am. 1990; 17: 553-66.