Original Article
Artigo Original
Ariany Fernanda Garcia1 Viviane Cristina de Castro Marino2 Maria Inês Pegoraro-Krook3 Thais Alves Guerra1 José Roberto Pereira Lauris3 Jeniffer de Cássia Rillo Dutka3
Descritores
Fala Fissura Palatina Distúrbios da fala Medida da Produção da Fala
Fonoaudiologia Keywords
Speech Cleft Palate Speech Disorders Speech Production Measurement Speech, Language and Hearing Sciences
Correspondence address:
Jeniffer de Cássia Rillo Dutka Hospital de Reabilitação de Anomalias Craniofaciais, Universidade de São Paulo Rua Silvio Marchioni, 3-20, Bauru (SP), Brasil, CEP: 17043-900.
E-mail: [email protected]
Received: 05/01/2014
Accepted: 07/16/2014
Study carried out at the Laboratory of Experimental Phonetics, Hospital for Rehabilitation of Craniofacial Anomalies, Universidade de São Paulo – USP – Bauru (SP), Brazil.
(1)Graduate Program in Rehabilitation Sciences, Orofacial Clefts and Related Anomalies, Hospital for Rehabilitation of Craniofacial Anomalies, Universidade de São Paulo – USP – Bauru (SP), Brazil.
(2)Department of Speech Language Pathology and Audiology, Philosophy and Sciences, Universidade Estadual Paulista “Júlio de Mesquita Filho” – UNESP – Marília (SP), Brazil.
(3)Graduate Program in Speech Language Pathology and Audiology, School of Dentistry of Bauru, Universidade de São Paulo – USP – Bauru (SP); Brazil.
Financial support: Coordenação de Aperfeiçoamento de Pessoal de Nível Superior – CAPES.
Conlict of interests: nothing to declare.
Nasalance during use of pharyngeal
and glottal place of production
Nasalância durante produção de
fricativa faríngea e oclusiva glotal
ABSTRACT
Purpose: This study obtained nasalance scores during use of compensatory articulation (CA) and compared nasalance between groups with and without hypernasality and with and without CA. Methods: Speech samples were obtained from 43 individuals with and without velopharyngeal dysfunction during repetition of 20 phrases originating 860 audio recordings and their respective nasometric values. After excluding 143 recordings due to low quality, the remaining 717 samples were rated by three speech language pathologists (SLPs), independently, for presence or absence of hypernasality and CA. Nasalance scores for the 553 samples rated with 100% agreement among the SLPs were grouped according to the auditory-perceptual ratings: Group 1 (G1) - included samples without hypernasality and without CA (n=191); Group2 (G2) - included samples with hypernasality and without CA (n=288); Group 3 (G3) - included samples with hypernasality and with pharyngeal fricative (n=33); Group 4 (G4) - included samples with hypernasality and with glottal stop (n=41). Results: Analysis of variance (ANOVA) revealed signiicant difference nasalance scores which were signiicantly higher for G2, G3, and G4 (p<0.0001) when compared to G1. The use of pharyngeal fricative (G3), particularly during /f/ (p=0.0018) and /s/ (p=0.0017) productions resulted in nasalance scores signiicantly higher than scores found for G2. Conclusion: Signiicantly higher nasalance values where identiied during use of pharyngeal fricative.
RESUMO
INTRODUCTION
Cleft lip and palate (CLP) is one of the congenital anoma-lies with an impact in the structures and function of the velo-pharyngeal mechanism. Primary palatoplasty does not always warrant adequate velopharyngeal function for speech for indi-viduals who present with the CLP, resulting in velopharyn-geal dysfunction (VPD) and related speech disorders. Besides hypernasality, audible nasal air emission and weak oral pres-sure consonants, speakers with CLP or VPD may use atypical place of production, resulting in a group of consonant produc-tion errors (CPE) described in the literature as compensatory articulation(1,2). A group of authors(1) classiied CPE related to
CLP and VPD as pre-uvular and post-uvular place of produc-tion errors. Among the post-uvular errors, pharyngeal fricatives (PF) and glottal stops (GS) have been described as the most common atypical productions associated to CLP and VPD(3).
The use of CA can compromise intelligibility of speech, hav-ing an impact in socio-educational development and vocational placement of the speaker. Individuals with history of CLP and VPD may also experience bullying, due to the speech disor-ders involving CPE and hypernasality.
Many cleft palate teams around the world follow parameters established for evaluation and treatment of CLP and other cra-niofacial anomalies as proposed by ACPA(4). Instrumental
assess-ment of velopharyngeal function is recommended for adequate management of VPD and may involve the use of nasometry to corroborate indings of speech nasality. While nasometric assessment provide a quantiiable measure of speech nasality and has been extensively studied and described in the litera-ture(5-7), the recommendation for not conducting nasometric
assessment during use of CA is based on clinical impressions. During our clinical practice, we observe that the use of post-uvular place of production leads to impaired velopharyngeal move-ments during nasoendoscopic and videoluoroscopic assessmove-ments. Making decision regarding the management of VPD at the pres-ence of CA is dificult and some cleft palate teams delay surgi-cal procedures for correcting velopharyngeal insuficiency until after speech therapy is conducted to resolve CPE involving use of post-uvular CA. Since nasometry has clinical applications dur-ing evaluation and treatment of speech disorders related to VPD, we questioned the possibility of using nasalance scores to cor-roborate auditory-perceptual indings of acoustic events hap-pening at atypical places in the vocal tract. As reported in the literature(8), the use of GS surrenders velopharyngeal function
once the valving of airlow to generate air pressure for plosion is obtained before the low reaches the level of the velopharyngeal mechanism. Nasometric scores have been shown to vary accord-ing to several aspects includvary accord-ing language, age and gender of the speaker, as well as the phonetic context and the length of the speech stimuli(9-13). One article(14) also reported that, besides nasal
acoustic energy related to voiced resonance, nasometric assess-ment can also relect acoustic events related to unvoiced aero-dynamic turbulence occurring within the vocal tract.
This study assumes that, besides corroborating auditory-perceptual findings of voiced resonance related to speech nasality, nasometric assessment can also provide information
related to other acoustic events occurring within the vocal tract. The hypothesis to be tested is whether the production of frication and plosion at a post uvular place of production may signiicantly increase or reduce nasalance scores. Finding whether the use of CA can affect nasalance scores, however, will not bring direct useful information for management of VPD, since it is known that the use of pharyngeal place of fri-cation (such as in PF) or laryngeal place of plosion (such as in GS) may minimize (or completely surrender) velopharyn-geal activity. Further information about the impact of CA on nasalance scores, however, may provide clinician with a tool for measuring outcome of behavioral management of CPE. This study compares nasalance scores between speakers with and without hypernasality and use of PF and GS.
METHODS
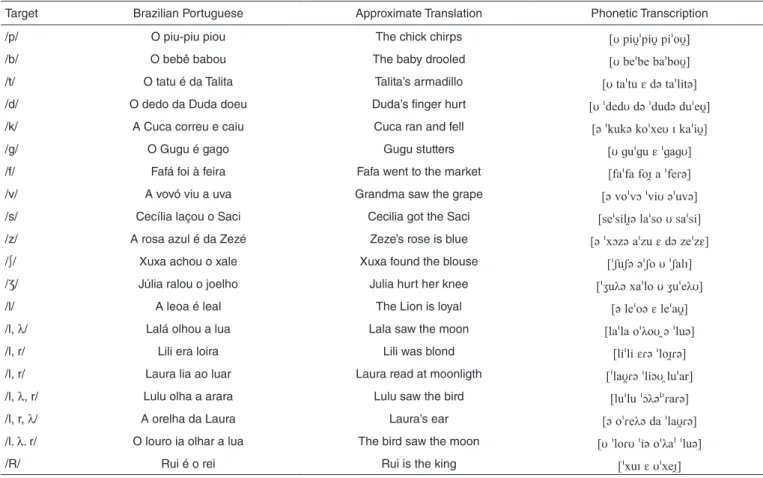
This study was approved by the Human Research Ethics Committee at the research site. Sampling was conducted dur-ing a period of three months in which a group of 43 patients, with operated CLP, accepted to participate in the study. To con-trol for some factors that could affect listeners’ ratings and nasalance scores recording from participants with dyspho-nia, nasal obstruction on both nares and nasal snort (turbulent audible nasal air emission) were not included in the study. Patients with syndromes or other conditions that could affect performance or compliance during speech recording were not recorded. A series of 20 phrases was used for audio and naso-metric recordings (Table 1). The stimuli are currently used for speech recordings at the research site and the phonetic com-position was designed according to the recommendations of Henningsson et al.(1). To favor identiication of CPE, 20 phrases
(12 loaded with high pressure sounds, 8 loaded with low pres-sure sounds, each with recurrence of a single target conso-nant) were repeated once by the participants. Nasalance scores were obtained using Nasometer model 6400 (Kay PENTAX). An audio-recording was captured simultaneously during naso-metric assessment using an AKG – C420 microphone attached to the Nasometer’s separator plate.
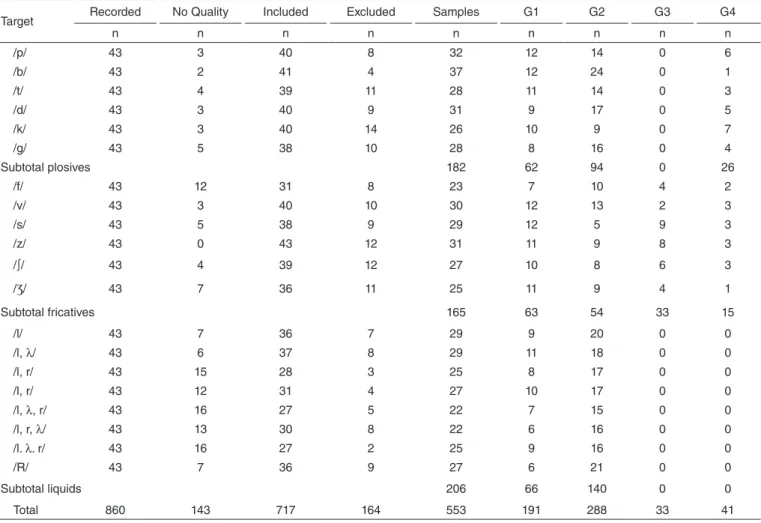
A total of 860 audio and nasometric samples (Table 2) were recorded (43 participants versus 20 stimuli = 860 phrases). Using Sound Forge 8.0, the audio samples were edited into a material for listeners’ ratings of speech production. During editing, 143 samples (17%) presented with external noise and were excluded due to low quality for auditory-perceptual rat-ings. The remaining 717 recordings were grouped according to the stimuli and presented to three experienced speech lan-guage pathologists (SLPs) for ratings of speech nasality and use of PF and GS. The SLPs worked daily in the assessment of speech disorders related to CLP for over ive years. They were instructed to listen to each phrase, independently, as many times needed until they were able to indicate the presence or the absence of hypernasality and use of PF or GS. During identi-ication of PF and GS, listeners had to indicate which targets in each stimulus were substituted or co-produced with the use of PF and GS. All ratings were compiled into a Microsoft Excel©
the three SLPs were kept. A total of 164 (23%) samples were rated with less than 100% agreement among the listeners and were excluded.
The remaining 553 samples were distributed into four groups according to the auditory-perceptual ratings: G1 included sam-ples without hypernasality and without CA; G2 included samples with hypernasality and without CA; G3 included samples with hypernasality and with pharyngeal fricative; and G4 included samples with hypernasality and with glottal stop. Nasalance scores for the 553 samples were calculated. Mean nasalance scores and standard deviations were identiied for each group in each of the 20 stimuli. Analysis of variance (ANOVA) was used to compare means between the groups, followed by Tukey’s testwith signiicance established at p<0.05.
RESULTS
This study initially established a data bank of speech record-ings representative of presence and absence of hypernasality, PF and GS. To assure representativeness of the samples, all audio recordings with adequate quality for auditory-perceptual ratings were presented to three listeners who rated the sam-ples independently. Only the samsam-ples with 100% agreement between the raters (consensus) were grouped for comparison of nasalance indings. PF or GS were identiied with consensus by the SLPs when all targets within the stimuli were produced
with the CA and when co-productions were not used. Review and discussion of ratings with less than 100% agreement dur-ing independent ratdur-ings were not pursued in this study. In the group of samples excluded due to lack of consensus between the raters, 27% involved phrases produced with fricative tar-gets, 24% plosive targets and 18% liquid targets.
After the auditory-perceptual ratings, 191 (35%) samples were identiied as representative of absence of hypernasal-ity and absence of CA (G1), 288 (52%) as representative of presence of hypernasality and absence of CA (G2), 33 (6%) as representative of presence of hypernasality and use of PF (G3), and 41 (7%) as representative of presence of hypernasal-ity and use of GS (G4). As indicated in Table 2, 182 samples targeting plosive sounds were rated with consensus: 62 (34%) in G1, 94 (52%) in G2, and 26 (14%) in G4. No samples using pharyngeal fricatives (G3) were identiied during repetitions of stimuli loaded with plosive sounds. A total of 165 samples tar-geting fricative sounds were rated with consensus: 63 samples (38%) in G1, 54 (33%) in G2, 33 (20%) in G3, and 15 (9%) in G4. A total of 206 samples targeting liquid sounds were rated with consensus: 66 (32%) in G1 and 140 (68%) in G2. No samples using pharyngeal fricatives (G3) or glottal stops (G4) were identiied for the stimuli loaded with liquid sounds. Table 2 also indicates that 288 samples (52%) were rated with presence of hypernasality and absence of CA, while 74 (13%) samples were rated as representative of hypernasal speech and
Target Brazilian Portuguese Approximate Translation Phonetic Transcription
/p/ O piu-piu piou The chick chirps pipipio
/b/ O bebê babou The baby drooled o
/t/ O tatu é da Talita Talita’s armadillo i
/d/ O dedo da Duda doeu Duda’s finger hurt
/k/ A Cuca correu e caiu Cuca ran and fell oi
/g/ O Gugu é gago Gugu stutters
/f/ Fafá foi à feira Fafa went to the market o
/v/ A vovó viu a uva Grandma saw the grape oi
/s/ Cecília laçou o Saci Cecilia got the Saci ioi
/z/ A rosa azul é da Zezé Zeze’s rose is blue
/∫/ Xuxa achou o xale Xuxa found the blouse ʃʃʃoʃ
/Ʒ/ Júlia ralou o joelho Julia hurt her knee ʒλoʒλ
/l/ A leoa é leal The Lion is loyal o
/l, λ/ Lalá olhou a lua Lala saw the moon oλo
/l, r/ Lili era loira Lili was blond iio
/l, r/ Laura lia ao luar Laura read at moonligth ir
/l, λ, r/ Lulu olha a arara Lulu saw the bird λ:
/l, r, λ/ A orelha da Laura Laura’s ear oλ
/l. λ. r/ O louro ia olhar a lua The bird saw the moon oioλ:
/R/ Rui é o rei Rui is the king
use of CA, 33 (6%) pharyngeal fricative and 41 (7%) glottal stops. That is, for all samples rated as representative of PF or GS, listeners also identiied hypernasality. Furthermore, glottal stops were observed during production of stimuli loaded with plosive and fricative targets while pharyngeal fricatives were observed only during production of fricative targets.
Table 3 presents mean nasalance and standard deviations for all samples grouped according to nasality and CA ind-ings (G1, G2, G3, and G4). During production of stimuli with plosive targets, an overall mean nasalance of 9.4% (±1.1)
was found for G1, 44.4% (±2.5) for G2, and 56.2% (±4.9)
for G4. No samples were identiied with pharyngeal fricative (G3) during productions targeting plosive stimuli. During production of fricative targets an overall mean nasalance of 9.3% (±2.1) was found for G1, 35.9% (±3.9) for G2, 52.3%
(±3.8) for G3, and 49.7% (±5.5) for G4. For liquid targets,
an overall mean nasalance of 12.3% (±4.0) was found for G1
and 43.1% (±4.3) for G2. No samples were identiied with
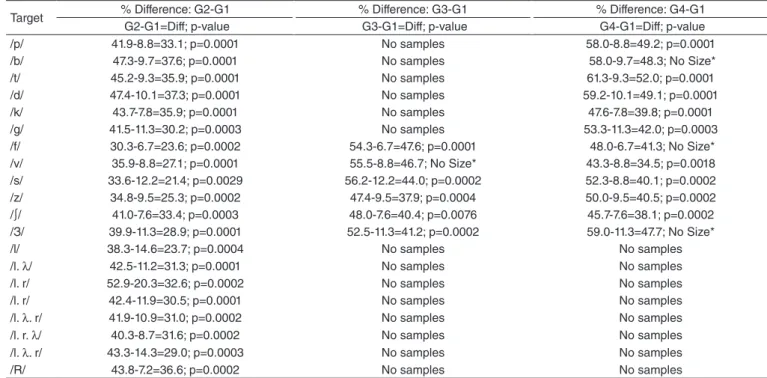
pharyngeal fricatives (G3) or glottal stops (G4) for stimuli using liquid targets. ANOVA revealed a signiicant differ-ence in mean nasalance between the four groups (p<0.005). Table 4 presents the difference between nasalance means for G1 when compared to G2, G3 and G4, respectively. Means
for samples in G1 were signiicantly lower than means for samples in G2, G3, and G4.
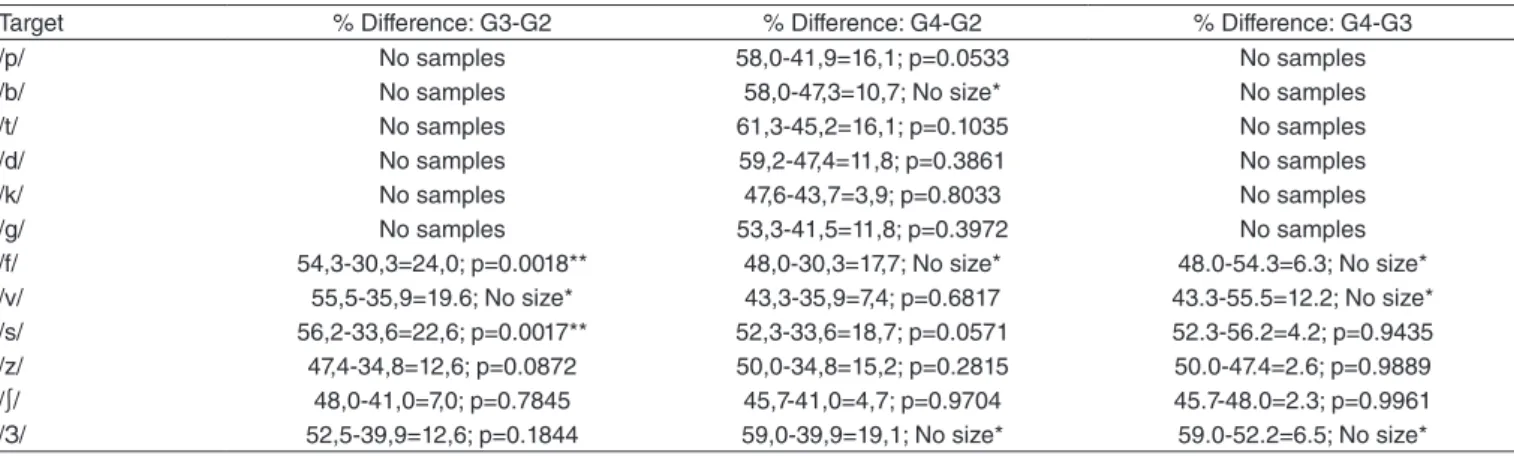
Table 5 presents the difference between nasalance means for G2 and G3. Scores identiied for /f/ and /s/ targets where signiicantly higher for G3 (productions with pharyngeal frica-tives and hypernasality) when compared to /f/ and /s/ targets in G2 (productions only with hypernasality). For some stimuli, the sample size was too small for inferential statistics (No size).
DISCUSSION
Identifying speech samples representative of use of PF and GS was the irst task addressed in this study. Representativeness of a sample was established with consensus auditory-perceptual ratings obtained with three SLPs. With the objective of testing the hypothesis that the use of PF or GS would have a signii-cant impact in nasalance scores, only samples for which the judges agreed 100% regarding presence or absence of hyper-nasality, PF and GS were maintained in the study. Obtaining similar sample size for the four groups of interest, however, was not possible and only 13% of the samples in the overall data bank were rated as representative of use of PF (6%) and use of GS (7%). These indings, however, cannot be interpreted as
Target Recorded No Quality Included Excluded Samples G1 G2 G3 G4
n n n n n n n n n
/p/ 43 3 40 8 32 12 14 0 6
/b/ 43 2 41 4 37 12 24 0 1
/t/ 43 4 39 11 28 11 14 0 3
/d/ 43 3 40 9 31 9 17 0 5
/k/ 43 3 40 14 26 10 9 0 7
/g/ 43 5 38 10 28 8 16 0 4
Subtotal plosives 182 62 94 0 26
/f/ 43 12 31 8 23 7 10 4 2
/v/ 43 3 40 10 30 12 13 2 3
/s/ 43 5 38 9 29 12 5 9 3
/z/ 43 0 43 12 31 11 9 8 3
/∫/ 43 4 39 12 27 10 8 6 3
/Ʒ/ 43 7 36 11 25 11 9 4 1
Subtotal fricatives 165 63 54 33 15
/l/ 43 7 36 7 29 9 20 0 0
/l, λ/ 43 6 37 8 29 11 18 0 0
/l, r/ 43 15 28 3 25 8 17 0 0
/l, r/ 43 12 31 4 27 10 17 0 0
/l, λ, r/ 43 16 27 5 22 7 15 0 0
/l, r, λ/ 43 13 30 8 22 6 16 0 0
/l. λ. r/ 43 16 27 2 25 9 16 0 0
/R/ 43 7 36 9 27 6 21 0 0
Subtotal liquids 206 66 140 0 0
Total 860 143 717 164 553 191 288 33 41
Target G1 (Mean±SD)
G2 (Mean±SD)
G3 (Mean±SD)
G4 (Mean±SD)
/p/ 8.8±7.0 41.9±15.1 No samples 58.0±8.1
/b/ 9.7±8.4 47.3±13.6 No samples 58.0*
/t/ 9.3±4.2 45.215.6 No samples 61.3±9.5
/d/ 10.1±10.9 47.4±15.6 No samples 59.2±12.2
/k/ 7.8±3.6 43.7±14.6 No samples 47.614.4
/g/ 11.3±9.6 41.5±14.4 No samples 53.3±11.2
All plosives 9.4±1.1 44.4±2.5 No samples 56.2±4.9
/f/ 6.7±4.1 30.3±10.1 54.3±8.0 48.0±4.2
/v/ 8.8±4.7 35.9±13.4 55.5±6.4 43.3±16.3
/s/ 12.2±6.7 33.6±3.8 56.2±11.7 52.3±9.2
/z/ 9.5±5.4 34.8±11.9 47.4±12.9 50.0 ±9.8
/∫/ 7.6±3.7 41.0±16.9 48.0±15.0 45.7±17.2
/Ʒ/ 11.3±7.6 39.9±13.1 52.5±3.7 59.0*
All fricatives 9.3±2.1 35.9±3.9 52.3±3.8 49.7±5.5
/l/ 14.6±10.7 38.3±12.3 No samples No samples
/l. λ/ 11.2±8.6 42.5±12.7 No samples No samples
/l. r/ 20.3±16.7 52.9±12.1 No samples No samples
/l. r/ 11.9±7.9 42.4±11.8 No samples No samples
/l. λ. r/ 10.9±4.7 41.9±13.3 No samples No samples
/l. r. λ/ 8.7±5.5 40.3±9.9 No samples No samples
/l. λ. r/ 14.3±13.3 43.3±13.7 No samples No samples
/R/ 7.2±6.9 43.8±13.2 No samples No samples
All liquids 12.3±4.0 43.1±4.3 No samples No samples
All targets 10.61±3.1 41.40±5.0 52.32±3.5 52.98±5.8
*Standard deviation was not calculated because this group had a single participant
Caption: SD = standard deviation
Table 3. Mean nasalance scores and standard deviations for all groups and all stimuli
Target % Difference: G2-G1 % Difference: G3-G1 % Difference: G4-G1
G2-G1=Diff; p-value G3-G1=Diff; p-value G4-G1=Diff; p-value
/p/ 41.9-8.8=33.1; p=0.0001 No samples 58.0-8.8=49.2; p=0.0001
/b/ 47.3-9.7=37.6; p=0.0001 No samples 58.0-9.7=48.3; No Size*
/t/ 45.2-9.3=35.9; p=0.0001 No samples 61.3-9.3=52.0; p=0.0001
/d/ 47.4-10.1=37.3; p=0.0001 No samples 59.2-10.1=49.1; p=0.0001
/k/ 43.7-7.8=35.9; p=0.0001 No samples 47.6-7.8=39.8; p=0.0001
/g/ 41.5-11.3=30.2; p=0.0003 No samples 53.3-11.3=42.0; p=0.0003
/f/ 30.3-6.7=23.6; p=0.0002 54.3-6.7=47.6; p=0.0001 48.0-6.7=41.3; No Size*
/v/ 35.9-8.8=27.1; p=0.0001 55.5-8.8=46.7; No Size* 43.3-8.8=34.5; p=0.0018
/s/ 33.6-12.2=21.4; p=0.0029 56.2-12.2=44.0; p=0.0002 52.3-8.8=40.1; p=0.0002
/z/ 34.8-9.5=25.3; p=0.0002 47.4-9.5=37.9; p=0.0004 50.0-9.5=40.5; p=0.0002
/∫/ 41.0-7.6=33.4; p=0.0003 48.0-7.6=40.4; p=0.0076 45.7-7.6=38.1; p=0.0002
/З/ 39.9-11.3=28.9; p=0.0001 52.5-11.3=41.2; p=0.0002 59.0-11.3=47.7; No Size*
/l/ 38.3-14.6=23.7; p=0.0004 No samples No samples
/l. λ/ 42.5-11.2=31.3; p=0.0001 No samples No samples
/l. r/ 52.9-20.3=32.6; p=0.0002 No samples No samples
/l. r/ 42.4-11.9=30.5; p=0.0001 No samples No samples
/l. λ. r/ 41.9-10.9=31.0; p=0.0002 No samples No samples
/l. r. λ/ 40.3-8.7=31.6; p=0.0002 No samples No samples
/l. λ. r/ 43.3-14.3=29.0; p=0.0003 No samples No samples
/R/ 43.8-7.2=36.6; p=0.0002 No samples No samples
*Sample size in this group was too small and inferential statistics were not computed
Caption: Diff = Difference; No samples = no recordings available
Target % Difference: G3-G2 % Difference: G4-G2 % Difference: G4-G3
/p/ No samples 58,0-41,9=16,1; p=0.0533 No samples
/b/ No samples 58,0-47,3=10,7; No size* No samples
/t/ No samples 61,3-45,2=16,1; p=0.1035 No samples
/d/ No samples 59,2-47,4=11,8; p=0.3861 No samples
/k/ No samples 47,6-43,7=3,9; p=0.8033 No samples
/g/ No samples 53,3-41,5=11,8; p=0.3972 No samples
/f/ 54,3-30,3=24,0; p=0.0018** 48,0-30,3=17,7; No size* 48.0-54.3=6.3; No size*
/v/ 55,5-35,9=19.6; No size* 43,3-35,9=7,4; p=0.6817 43.3-55.5=12.2; No size*
/s/ 56,2-33,6=22,6; p=0.0017** 52,3-33,6=18,7; p=0.0571 52.3-56.2=4.2; p=0.9435
/z/ 47,4-34,8=12,6; p=0.0872 50,0-34,8=15,2; p=0.2815 50.0-47.4=2.6; p=0.9889
/∫/ 48,0-41,0=7,0; p=0.7845 45,7-41,0=4,7; p=0.9704 45.7-48.0=2.3; p=0.9961
/З/ 52,5-39,9=12,6; p=0.1844 59,0-39,9=19,1; No size* 59.0-52.2=6.5; No size*
*Sample size in this group was too small and inferential statistics were not computed; **significant
Caption: No samples = no recordings available
Table 5. Difference in nasalance scores between the groups with hypernasality and with CA with p-value indicative of significance when <0.05
indicative of frequency of use of PF and GS in the population with CLP since participants’ selection was biased to identii-cation of samples representative of the four groups of interest in the study.
Authors point to the importance of conducting a careful sampling once the goal is to obtain listeners’ perceptual ratings of the recordings(1,15,16). From the initial pool of 860 recordings,
17% were lost due to poor recording quality, indicating the importance of listening the recordings during or immediately after the data collection. While clinical demands may require a quick process of sampling, special care with the recording procedures as well as with the length and phonetic context of the stimuli are needed to document speech outcome accurately. Sell(16) and Henningsson et al.(1) suggested the importance of
using speech stimuli involving recurrence of a single consonant target to identify the use of CPE related to CLP. Balancing the phonetic context of the speech stimuli to maximize identiica-tion of both, hypernasality and CPE, however, is a complex task. While ratings of speech nasality may be facilitated with the use of longer stimuli (such as short passages instead of short phrases), the use of shorter stimuli (short phrases, words, syl-lable repetitions) with recurrence of a single target may favor the identiication of CPE and may be applied at an earlier age. For multiple listeners’ ratings, care must be taken with lis-teners experience and preparation. The judges in this study had extensive experience in evaluating speech disorder related to CLP and have a history of over ive year of daily work with management of CLP and VPD in a large craniofacial team. Extensive training was not provided but samples representa-tive of presence and absence of hypernasality, PF and GS were played to the SLPs prior to the task and could be used by the listeners as reference if needed. For this study, all ratings were done independently and after all listeners inished the ratings, only samples for which the listeners agreed 100% (consensus) regarding the presence or the absence of the variables of interest were maintained in the study. The indings of this study sup-port prior literature that indicates that PF is commonly observed for fricative targets while GS were used for both, plosive and
fricative targets(3). PF and GS were not used for liquid targets,
as commonly observed(17).
While it is recommended that cut-off values should be stim-uli speciic, indings for G1 support prior studies which sug-gest that a cut-off value of 27% or lower can be used for clini-cal interpretation of nasalance scores obtained for Brazilian Portuguese language(18,19). Within the groups with hypernasal
speech, mean nasalance for stimuli with high pressure sounds (plosive and fricative) were similar to mean nasalance obtained for stimuli targeting low pressure sounds (liquids). This was an expected inding since the presence of audible turbulent nasal air emission was controlled to avoid increase in the scores due to nasal snort(14,20).
Looking into the hypothesis tested in this study, we observed a signiicant difference in nasalance score between the group with hypernasality and the group with hypernasality and use of PF, for the stimuli targeting /f/ and /s/ sounds. The current inding, therefore, does not support Ferreira et al.(21), who
Nasometric evaluation involving speech produced dur-ing use of CA is not recommended to corroborate speech nasality and velopharyngeal function findings. But when we consider that not all articulatory gestures used by speak-ers with VPD and history of CLP are captured by human ears(22,23), higher nasalance findings during use of PF may
suggest presence of pharyngeal articulatory gestures and may help corroborating clinical identification of PF. Finally, considering that use of biofeedback of the speech signal with nasometry is a behavioral therapeutic strategy useful with speakers when addressing nasal snort, one can also explore the use of nasometric feedback when addressing CPE involving PF.
CONCLUSION
This study established nasalance scores for speech samples with and without hypernasality and with and without use of pharyngeal fricative and glottal stop. In general, the nasalance values for the samples with hypernasality were higher than the scores for samples without hypernasality. More speciically, however, when pharyngeal fricatives were used in substitu-tion of oral targets /f/ and /s/, the scores where signiicantly higher than those obtained for speech with hypernasality but without the use of CA.
*AFG was involved in the elaboration and design of the study, collected and prepared data, was involved in data analysis and interpretation and also in the preparation and revision of this manuscript; VCCM and MIP-K were involved in the design of the study, in data analysis and interpretation and also in the preparation and revision of this manuscript; JRPL was involved with study design, data analyses and revision of this manuscript; TAG was involved in data collection, in data analysis and interpretation and also in the preparation and revision of this manuscript; JCRD was involved in the study design, collected and prepared data for comparisons and was involved in data analysis and interpretation and also in the preparation and revision of this manuscript.
REFERENCES
1. Henningsson GE, Kuehn DP, Sell D, Sweeney T, Trost-Cardamone JE, Whitehill TL. Universal parameters for reporting speech outcomes in individuals with cleft palate. Cleft Palate Craniofac J. 2008;45(1):2-17. 2. Trost-Cardamone JE. Diagnosis of speciic cleft palate speech error
patterns for planning therapy or physical management needs. In: Bzoch KR editor. Communicative disorders related to cleft lip and palate. 5th edition. Austin: Pro-Ed; 2004. p. 313-30.
3. Marino VCC, Dutka JCR, Pegoraro-Krook MI, Lima-Gregio AM. Articulação compensatória associada à issura de palato ou disfunção velofaríngea: revisão de literatura. Rev CEFAC. 2012;14(3):528-43.
4. American Cleft Palate Association. Parameters for evaluation and treatment of patients with cleft lip/palate or other craniofacial anomalies. Chapel Hill: ACPA; 2009.
5. Bae Y, Kuehn DP, Ha S. Validity of the nasometer measuring the temporal characteristics of nasalization. Cleft Palate Craniofac J. 2007;44(5):506-17. 6. Sweeney T, Sell D. Relationship between perceptual ratings of nasality and nasometry in children/adolescents with cleft palate and/or velopharyngeal dysfunction. Int J Lang Commun Disord. 2008;43(3):265-82.
7. Heijden PV, Hobbel HH, Van de Laan BF, Korsten-Meijer AG, Goorhuis-Brouwer SM. Nasometry normative data for young Dutch children.Int J Pediatr Otorhinolaryngol. 2011;75(3):420-4.
8. Henningsson GE, Isberg AM. Velopharyngeal movement patterns in patients alternating between oral and glottal articulation: a clinical and cineradiographical study. Cleft palate J. 1986;23(1):1-9.
9. Watterson T, Lewis KE, Deutsch C. Nasalance and nasality in low pressure and high pressure speech. Cleft Palate Craniofac J. 1998;35(4):293-7.
10. Watterson T, Lewis KE, Foley-Homan N. Effect of stimulus length on nasalance scores. Cleft Palate Craniofac J. 1999;36(3):243-7.
11. Lewis KR, Watterson T, Quint T. The effect of vowels on nasalance scores. Cleft Palate Craniofac J. 2000;37(6):584-9.
12. Brunnegard K, Doorn JV. Normative data on nasalance scores for Swedish as measured on the nasometer: inluence of dialect, gender and age. Clin Linguist Phon. 2009;23(1):58-69.
13. Brancamp TU, Lewis KE, Watterson T. The relationship between nasalance scores and nasality ratings obtained with equal appearing interval and direct magnitude estimation scaling methods. Cleft Palate Craniofac J. 2010;47(6):631-7.
14. Karnell MP. Nasometric discrimination of hypernasality and turbulent nasal airlow. Cleft Palate Craniofac J.1995;32(2):145-8.
15. Lohmander A, Olsson M. Methodology for perceptual assessment of speech in patients with cleft palate: a critical review of the literature. Cleft Palate Craniofac J. 2004;41(1):64-70.
16. Sell D. Issues in perceptual speech analysis in cleft palate and related disorders: a review. Int J Lang Commun Disord. 2005;40(2):103-21. 17. Prandini EL, Pegoraro-Krook MI, Dutka JCR, Marino VCC. Occurrence
of consonant production errors in liquid phonemes in children with operated cleft lip and palate. J Appl Oral Sci. 2011;19(6):579-85. 18. Trindade IEK, Genaro KF, Dalston RM. Nasalance scores of normal
Brazilian Portuguese speakers. Braz J Dysmorphol Speech-Hear Disord. 1997;1(1):23-34.
19. Di Ninno CQMS, Vieira JM, Teles-Magalhães LC, Padovani CR, Pegoraro-Krook MI. Determinação dos valores de nasalância para falantes normais do português brasileiro. Pró-fono R Atual Cient. 2001;13(1):71-7.
20. Bastazini SV. Nasalância na presença e ausência da turbulência nasal e da hipernasalidade [dissertation]. Bauru: Universidade de São Paulo; 2008. 21. Ferreira DBP, Yamashita RP, Fukushiro AP. Inluência do distúrbio
articulatório compensatório sobre a nasalância da fala em indivíduos com insuiciência velofaríngea. In: Anais do 17º Congresso Brasileiro de Fonoaudiologia; 2009. Salvador, Brasil; 2009.
22. Gibbon FE, Crampin L. An electropalatographic investigation of middorsum palatal stops in an adult with repaired cleft palate. Cleft Palate Craniofac J. 2001;38(2):96-105.