ISSN 0104-6632 Printed in Brazil
Brazilian Journal
of Chemical
Engineering
Vol. 21, No. 02 pp. 317 - 324, April - June 2004
FLOWSHEET OPTIMIZATION OF A LUBRICANT
BASE OIL HYDROTREATMENT PROCESS
J. L. Medeiros
1, L. C. Barbosa
1, F. M. Vargas
1, O. Q. F. Araújo
1and R. M. F. Silva
21
Escola de Química, Departamento de Engenharia Química, Universidade Federal do Rio de Janeiro Phone (21) 2562-7419, Fax (21) 2562-7637, Ilha do Fundão, C.T. Bloco E,
CEP 21949-909, Rio de Janeiro – RJ, Brasil. E-mail: [email protected] 2
Centro de Pesquisas Leopoldo A. Miguez de Mello, Petróleo Brasileiro S.A, Phone (21) 3865-6824,
E-mail: [email protected]
(Received: February 13, 2003 ; Accepted: October 4, 2003)
Abstract - Unsaturated, nitrogenated and sulfured compounds may reach undesirable levels in lubricant base oils, requiring hydrotreatment (HDT) at high temperatures and pressures. HDT processes are well known for their high capital and operational costs due to the use of hydrogen, compressors and multistage heterogeneous reactors. Process costs are thus highly dependent on the applied conditions. An oversized process entails unnecessary costs and capital investment. On the other hand, mild reaction conditions lead to unspecified products. This work analyzes the process using a compositional modeling and a kinetic framework developed previously (Barbosa et al., 2002) for the HDT of lubricant base oils. The industrial reactor is rigorously modeled on an adiabatic and multistage configuration. For the remaining equipment in the flowsheet, we adopt shortcut models for compressors and exchangers. The process is then optimized in terms of its variables subject to product specification constraints.
Keywords: lubricant oil, hydrotreatment, compositional modeling, optimization.
INTRODUCTION
Lubricant base oils are a complex mixture of paraffinic, aromatic and naphtenic hydrocarbons with molecular weights ranging from medium to high values, which produce oils with desirable viscosities, densities and distillation curves. However, these oils may have olefinic, nitrogenated and sulfured compound contents that jeopardize the quality of the final product. In order to meet composition specifications, these oils are submitted to the hydrotreatment (HDT) process before addition of other compounds for commercial production. This process – herein referred to as HDT-LUB – is characterized by the use of operational conditions of low or medium severity so that aromatic distribution is not seriously affected and sulfur compounds are
not completely removed, as these compounds affect positively resistance to oxidation under service.
In addition, process costs have nontrivial characteristics associated with: (i) the high value of product and raw material; (ii) mandatory compliance with the product oil composition requirements; (iii) the use of an expensive reactant (hydrogen); (iv) operation at high temperatures and pressures; (v) need for investing heavily in compressors and specific heterogeneous catalysts.
catalytic reaction networks; (iii) adiabatical operation of the industrial reactor in various hydrogenation stages, under medium and high pressure conditions, multiple hydrogen feeds and with liquid and vapor phases in constant equilibrium; and (iv) the overall process including, in addition to the reactor, peripheral structures for feed preheating, heat recovery, compression and hydrogen recycling.
This paper analyzes HDT-LUB, aiming to optimize the process and operational aspects under the constraints of product specifications. Previously developed compositional modeling (Barbosa et al., 2002), based on feed and product characterization data in a pilot plant (Valle et al., 1998), is used for the base oil and reaction network.
HDT-LUB is approached on three levels:
(i) development of a steady state simulator to predict the final state of the product and hydrogen and utilities consumption from process variables; (ii) definition of the economic objective, taking into account realistic aspects of process costs and the need to achieve product specification; and (iii) optimization of design and operation.
The process was modeled rigorously on an industrial reactor, formed of several adiabatic stages with liquid and vapor phases in constant equilibrium. Adiabatic separation vessels and the recycling structure were also modeled rigorously. The rest of the process was modeled using simple compressor, heat exchanger, scrubber and furnace models (Douglas, 1988). Investment was modeled according to Guthrie´s proposition (Douglas, 1988).
S1 S2
S3 S5
S7 S6
S11
H2
OIL S4
S8 S9
S17 S10
S18 S12
S13 S14 S15
S16
REACTORS
FURNACE COMPRESSOR
TC1 TC2
GAS OIL
H2O
RECYCLE COMPRESSOR HOT
HIGH-PRESSURE SEPARATOR
SOUR WATER
SCRUBBER
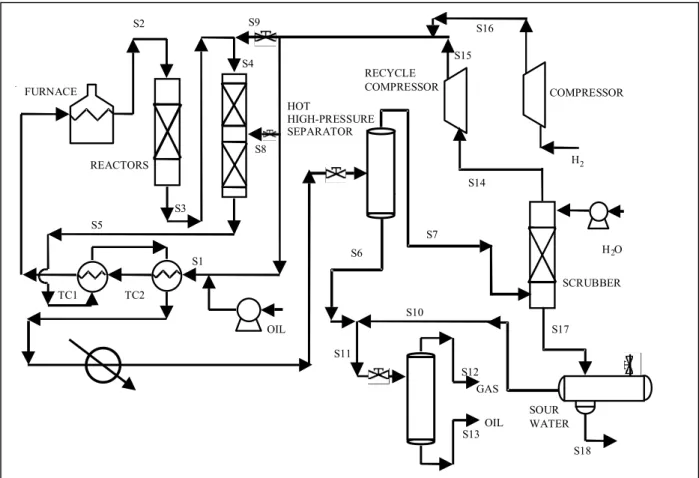
Figure 1: HDT Process Flowsheet.
THE HDT-LUB PROCESS
The HDT process is shown in Figure 1. A fixed base oil feed of 25000 kg/h, pumped and mixed with hydrogen under pressure, is assumed. The feed is preheated by a reactor outlet stream and then is
separated from hydrogen in a high-pressure separator. The gas generated is sent to a water scrubber for hydrocarbon, H2S and NH3 retention.
The recycle compressor pumps the recycle gas obtained at the top of the scrubber. The oil at the bottom of the high-pressure separator is expanded in the low-pressure separator, producing residual gas and treated oil. Key variables, which have decisive roles in the process performance, are the following: 1) Temperature at the furnace exit (TFURNACE). Its
increase favors high rates of HDT reaction, although one has to consider the impact on furnace costs and the highly exothermic characteristics of HDT reactions, which increase the possibility of generating elevated thermal levels at some point in the reactor. Also, some exothermic equilibrium reactions, such as hydrogenation of tri- and tetra-aromatics, are shifted unfavorably with an increase in reactor temperatures.
2) Feed pressure at reaction stage 1 (PCOMPRESSOR).
Hydrogen fugacity directly influences the kinetics and severity of the process. Its increase favors all HDT reactions, although it creates investment problems due to feed and recycle compressor design. 3) Reaction stage spatial velocities (WHSV1,
WHSV2 and WHSV3). An increase in WHSV (weight
hourly spatial velocity) translates into reduction of catalyst mass, reducing the severity of the process and investments. WHSV reduction can be used to maintain the level of severity as feed pressure is reduced.
4) Hydrogen/feed ratios RH2HC1, RH2HC2 and
RH2HC3 in reaction stages. The increase in hydrogen
recycling has advantages, such as the quenching effect at injection points, and favors heavy hydrocarbon vaporization, thus helping to maintain thermal control over the reactor. Also, a higher concentration of hydrogen inside the reactor results in easier maintenace of fugacity level, guaranteeing constant reaction rates. Problems that arise are the need for larger compressors and equipment in the recycle loop.
COMPOSITIONAL MODEL AND REACTION NETWORK
Barbosa et al. (2002) characterized lube base oil by data reconciliation, using a compositional model (CM), based on experimental data obtained from Valle et al. (1998). Adjustment of CM parameters is based on making the values of estimated properties equal to experimental data, such as density and distillation curve. These calculations use correlations and thermodynamic models, as well as the Joback group contribution method (Reid et al., 1987). The
CM developed by the authors has 23 key components with five different paraffinic side chains. The authors also proposed a reaction network for the HDT-LUB process, with 14 (ncin=14) kinetic laws, 39 (n=39) chemical reactions and 51 (nc=51) chemical species. Kinetic and adsorption parameters for the network were estimated based on pilot plant data obtained by Valle et al. (1998). All results generated by Barbosa et al. (2002) were used in the present paper: (i) CM feed parameters; (ii) the reaction network matrix (H : stoichiometric matrix (nc by nr); S : component selection matrix for reaction rate definition (nr by nc); D : matrix for association of kinetic laws with reactions (nr by ncin); (iii) vector of Arrhenius constants ( K(T) ) ((gmol/h)/(kg catalyst . bar)) for kinetic laws (ncin by 1); and (iv) Langmuir constants for adsorption on the catalyst ( K*H2,K*H2S, K*NH3, K*H2O).
HDT-LUB MODELING
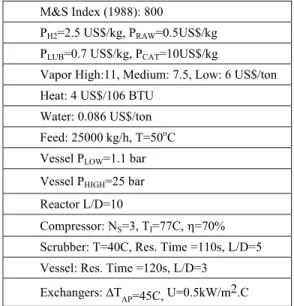
The flowsheet shown in Figure 1 was modeled as follows. After solving the equipment equations, their installed costs (ISBL, US$) were determined by the Guthrie models (Douglas, 1988) for year 1988 using the corresponding Marshall-Swift (M&S) index. Annual operational costs (UTIL, US$/year) were defined based on respective consumption of utilities. Table 1 contains the premises adopted:
1) Thermodynamic properties:
2) Fugacities, densities and enthalpies are estimated using cubic equations of state (Soave/Peng-Robinson) and the Joback method (critical constants and ideal gas enthalpies).
3) Liquid-vapor separation via Flash Rigorous Algorithms (P,H) and Flash (P,T): applied to separation vessels, reactor and energy balance in two-phase streams.
4) Heat exchangers: once temperature approximation intervals ('TAP) are defined, thermal duty for each
320 J. L. Medeiros, L. C. Barbosa, F. M. Vargas, O. Q. F. Araújo and R. M. F. Silva
Table 1: Premises for HDT-LUB
M&S Index (1988): 800
PH2=2.5 US$/kg, PRAW=0.5US$/kg
PLUB=0.7 US$/kg, PCAT=10US$/kg
Vapor High:11, Medium: 7.5, Low: 6 US$/ton
Heat: 4 US$/106 BTU
Water: 0.086 US$/ton
Feed: 25000 kg/h, T=50oC
Vessel PLOW=1.1 bar
Vessel PHIGH=25 bar
Reactor L/D=10
Compressor: NS=3, TI=77C,K=70%
Scrubber: T=40C, Res. Time =110s, L/D=5
Vessel: Res. Time =120s, L/D=3
Exchangers:'TAP=45C, U=0.5kW/m2.C
0
d
N F H Diag DK T S dt
ª º
; ¬ ¼ f (1)
where * H2 H2 * H2 H2 K f 1 K f
ª º
« »
;
« »
¬ :¼
* * *
H2S H2S NH3 NH3 H2O H2O
K f K f K f
:
F0 is the oil feed flow rate (kg/h), t is the spatial
time (kg catalyst/(kg/h)) and N is the species rate vector (gmol/h). Equation 1 is integrated into stage k from 0 to 1/WHSVk. Reactor ISBL is determined by the catalyst inventory (catalyst price in Table 1) and the pressure vessel ISBL.
Compressor: Power (BHP) in NS stages,
efficiency K, feed (TE (K)) and interstage (TI(K))
temperatures, compression ratio 4, flow rate Q (gmol/s) and polytropic exponent ( ); Equation 2 follows (R=8.314 J/gmol.K):
P V
C / C
J S 1 .N BHP 1 J J ª º « * 4 « ¬ ¼ »
» (2)
E S I
.R.(T (N 1)T ).Q 746( 1)
J
*
J K
ISBL is determined with BHP, stipulating a turbine-operated centrifuge compressor. Operational cost corresponds to high-pressure vapor in the turbine.
The process design is generated from eight-variable process vector V: (i) PCOMPRESSOR (bar); (ii)
TFURNACE (ºC); (iii) WHSV1, WHSV2 and WHSV3
(kg/h/kg catalyst); and (iv) RH2HC1, RH2HC2 and
RH2HC3 (Nl/kg). Search intervals are defined by
-Vmin and Vmax so that 100d RH2HC1d 400; 50 d
RH2HC2, RH2HC3 d 400; 1 d WHSV1, WHSV2,
WHSV3 d 6; 300 d TFURNACE d 350; and 40 d
PCOMPRESSORd 120).
ECONOMIC OBJECTIVE
It can be shown that a ten-year process with 12% annual rate of return, negligible labor costs and "instantaneous" implementation, has an annualized profit function (AP, US$/year) given approximately by Equation 3 (Douglas, 1998):
k k
k k
AP REVRAW
¦
UTIL¦
ISBL (3)where ISBLk and UTILk are installed capital (US$)
and annual utilities costs (US$/year) of unit k and REV and RAW represent annual income and raw material costs (US$/year). In HDT-LUB these costs are derived from H2 and fixed-price oil consumption
Flowsheet Optimization of a Lubricant Base Oil 321
and its market price (PPROD), which has a maximum
(PLUB) if specifications are achieved. These constants
are shown in Table 1. Equation 4 gives the product price model, where Ck is the kth valid assay for the
commercial fitness decision, while [Lk, Uk] represent
the acceptable interval for Ck, and Eҏ is a large
positive constant.
PROD RAW LUBE RAW
k k k k
k
P P P P
1
1 exp L C exp C U
°
® E E
°¯
½°¾ °¿(4)
This function has the role of eliminating specification constraints from the objective function of the process, so that the values of products that do not agree with for any k depreciate. Specifications used for characterizing commercial oil are listed in Table 2. Equation 5 gives the optimization formulation. Search variables in the unconstrained space T are defined in Equation 6. The HDT-LUB process was optimized using the SIMPLEX Nelder-Mead method (Reiklaitis et al., 1983), with Equations 5 and 6, in MATLAB R12 environment. Final values obtained were P
k k
k C U
L d d
COMPRESSOR
= 40.8 bar, TFURNACE= 328.6 oC, WHSV = [1.66, 3.2,
3.7] h –1, and RH2HC=[177.8, 213.9, 130] (Nl/kg) .
min max
Max AP(V)
V d dV V
(5)
^
2 2`
min max min
V( )T V (V V ). T (1 T ) (6)
RESULTS
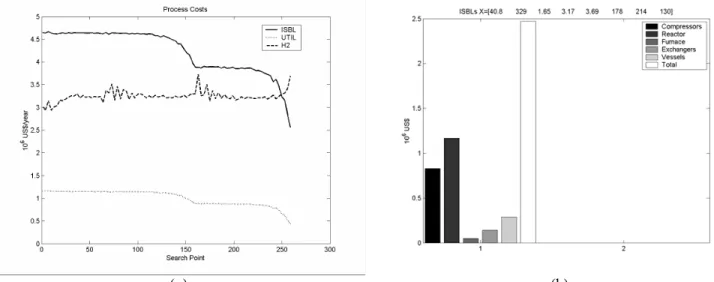
Starting from a viable loosely defined initial condition, trajectory of function AP (Figure 2a) evolves along the feasible region contours, exploring viable and nonviable designs (Figures 2a and 2c). Each nonviable condition found creates a sudden reduction in AP, causing the method to increase severity and thus return to a viable design. The objective value was markedly increased from the initial condition, tightening process operational conditions and obtaining a more economic combination of variables that influence severity. When the search was interrupted near 14 MMUS$/year, it was sloping up, with 2.6 MMU$ of total ISBL and 3.8 MMU$/year for H2 costs. The
search is directed towards lowering operating pressure and reactor size (Figures 2b and 2d), increasing furnace temperature to maintain the necessary severity for meeting the specification. It can be seen that 40ºC viscosity fitness was the main factor that defined the applied severity level (Figure 2f). Results for the optimum design simulation showing some property profiles for the reactor are given in Figure 3. Some reductions such as the following can be highlighted: (i) density; (ii) sulfur and nitrogen contents; (iii) simulated distillation curve temperatures and (iv) effects of the three hydrogen injections on temperature profiles, enthalpy fluxes and fraction vaporized inside the reactor.
Table 2: Limits of Commercial Fit
Specification Range
Viscosity [40C], cStk [2, 11]
Viscosity [100C], cStk [1, 5]
Density [20C], g/cm3 [0.76, 0.88]
Sulfur % (mass) [0, 0.05]
Mercap. Sulfur, ppm [0, 100]
Total Nitrogen, ppm [0, 300]
Basic Nitrogen, ppm [0, 300]
Bromine Number [0, 1]
322 J. L. Medeiros, L. C. Barbosa, F. M. Vargas, O. Q. F. Araújo and R. M. F. Silva
(a) (b)
(c) (d)
Flowsheet Optimization of a Lubricant Base Oil 323
(g) (h)
Figure 2: HDT Optimization Results for Lube Oil (a): Objective function – Annual profit; (b): Optimization of design variables; (c): Product specification vs iteration; (d): Process ISBL vs iteration; (e): Feed specification;
(f): Product specification; (g): Process cost path; (h): Process costs.
(a) (b)
324 J. L. Medeiros, L. C. Barbosa, F. M. Vargas, O. Q. F. Araújo and R. M. F. Silva
(e)
Figure 3: Profiles for the Reactor (After HDT-LUB Optimum Search): (a) 1: %S (RX); 2: %S (LECO); 3: Basic N; 4: Total N; (b) 1: Br N., 2: Mol. Mass, 3: Density (20ºC), 4: % Fenantrenes; (c) 1: Total
Enthalpy and Phases (kW); 2: Temperature (C); (d) 1: % Vaporized (H2+Oil); 2: LVE Factors;
(e) Simulated Distillation Curve for the Reactor.
CONCLUSIONS
A methodology for the lube base oil HDT modeling and optimization process, based on the following: (i) compositional feed modeling; (ii) a preliminary kinetic survey of the extensive reaction network; and (iii) a set of quality aims that must be met. It was shown that an efficient compositional model, together with a rigorous reactor description and simple models for peripheral equipment, is a practical tool for project analysis near optimum conditions.
ACKNOWLEDGMENTS
The authors are grateful to the National Petroleum Agency - ANP - for the scholarship received and to FINEP/CTPETRO and CNPq for the financial support.
REFERENCES
Barbosa, L.C.; Vargas, F.M., Medeiros, J.L., Araújo, O.Q.F. and Silva, R.M.F., Modelagem de Hidrotratamento de Óleos Bases de Lubrificantes, presented at the XIV Congresso Brasileiro de Engenharia Química, 2002.
Douglas, J.M., Conceptual Design of Chemical Processes, McGraw-Hill Book Company, 1988. Reid, R.C., Prausnitz, J.M., Poling, B.E., The
Properties of Gases and Liquids, McGraw-Hill, N.Y., 1987.
Reiklaitis, G.V., Ravindran, A. and Ragsdell, K.M., Engineering Optimization, J. Wiley & Sons, 1983.