ISSN 0104-6632 Printed in Brazil
www.abeq.org.br/bjche
Vol. 24, No. 02, pp. 185 - 192, April - June, 2007
Brazilian Journal
of Chemical
Engineering
A COMPARISON BETWEEN BULK AND
SUPPORTED TiO
2
PHOTOCATALYSTS IN THE
DEGRADATION OF FORMIC ACID
A. R. Tôrres
1, E. B. Azevedo
1, N. S. Resende
2and M. Dezotti
2*1Chemistry and Environment Department, Faculdade de Tecnologia, Universidade do Estado do Rio de Janeiro, Telefax: +(55) (24) 3354-0194/7875, Estrada Resende-Riachuelo, s/nº, Morada da Colina, 27523-000, Resende - RJ, Brazil
E-mail: [email protected], E-mail: [email protected] 2
NUCAT, Programa de Engenharia Química, COPPE, Universidade Federal do Rio de Janeiro, Centro de Tecnologia, Bloco G, Sala 117, Phone: +(55) (21) 2562-8348,
Fax: +(55) (21) 2562-8300, PO Box: 68502, 21945-970, Rio de Janeiro - RJ, Brazil E-mail: [email protected]
2
Water Pollution Control Lab, Programa de Engenharia Química, COPPE, Universidade Federal do Rio de Janeiro, Centro de Tecnologia, bloco G, sala 115,
Phone: +(55) (21) 2562-8347, Fax: +(55) (21) 2562-8300, PO Box: 68502, 21945-970, Rio de Janeiro - RJ, Brazil
E-mail: [email protected]
(Received: March 28, 2005 ; Accepted : December 19, 2006)
Abstract - The photocatalytic activity of bulk and supported TiO2 catalysts were tested using formic acid as a
probe molecule. The supported catalysts tested were prepared by impregnation using aluminum oxide (Al2O3)
as the support and the bulk catalysts by precipitation, both in sol-gel systems. For purposes of comparison, a photocatalyst supplied by DEGUSSA (P25) was also tested. The photolysis rate was found to be less significant than the photocatalytic rate. The Langmuir-Hinshelwood model was adopted and its constants were estimated and used to compare the various catalysts. The supported catalysts showed no significant activity, in spite of their high specific surface area. The bulk catalysts tested showed the highest photocatalytic rates. The adsorption constants determined experimentally were different from the ones estimated based on the kinetic experiments. The parameter estimation procedures tested were used to clarify this issue.
Keywords: Photocatalysis; Catalyst; Formic acid; TiO2
INTRODUCTION
According to Herrmann (1999) and Plaza and Malato (1999), the use of bulk TiO2 photocatalysts, mainly in the anatase crystalline phase, in the degradation of recalcitrant substances in wastewaters is a widespread technique. It has also been used in the elimination of toxic compounds from atmospheric emissions (Nicolella and Rovatti, 1998). TiO2 is used due to its semiconductor properties and to the generation of electron-hole pairs under UV
photocatalytic purposes. The preparation of supported photocatalysts, in which anatase is also the predominant form has also been reported. The main advantage of supported catalysts is the large specific surface area, due to the support, as suggested by Loddo et al. (1999).
It is believed that the generation of the electron-hole pair occurs only on the solid surface, although its diffusion and recombination occur in the solid volume, as described by Serpone and Pelizzetti (1989). Therefore, the existence of a compatible crystalline structure underneath the surface layer indicates that solids with a bulk active phase should have increased photocatalytic activity.
Through regression procedures, kinetic and adsorption constants are obtained. These procedures are sometimes simplified to obtain linear relationships (in fact, a model that corresponds to the straight line equation). The most complete approach to parameter estimation is to consider the experimental errors of all variables in the model.
MATERIALS AND METHODS
Solids and Photocatalysts
The solids used in the photocatalytic tests were prepared at PEQ/COPPE/UFRJ using the impregnation technique, as described in Table 1. For comparison purposes, experiments were performed with the P25 photocatalyst produced by Degussa (whose characteristics are also presented in Table 1). The solids were obtained by precipitation by the sol-gel technique, using titanium isopropoxide (Hague and Mayo, 1994) in accord with the procedure proposed by Egues (2002). For the final conversion to oxide, the precipitates were annealed at 823 K. The solid named PC100 is composed of pure TiO2 (bulk catalyst). The solids named PC13 and PC5 were obtained by impregnation of TiO2 on alumina (supported catalysts).
Table 1: Solids used in the tests.
Solids % w/w TiO2
% Anatase* S (m2 g-1)
Annealing Temperature (K)
PC100 100 100 60 823
PC13 13 100 190 823 PC5 5 100 180 823
P25 100 70 50 —
Al2O3 — — 197 —
*On the catalyst surface.
Test Molecule: Formic Acid
Throughout the experiments, formic acid was used as the test molecule. This probe molecule was chosen because no intermediates are generated during its oxidative decomposition (Equation 1).
HCOOH + ½ O2 → CO2 + H2O (1)
The use of this molecule is suggested by Davydov and Smirniotis (2000) and Ito et al. (1999). The formation of bicarbonate ion may be considered, although the air flow supplying oxygen to the solution is capable of stripping the carbon dioxide generated, keeping the bicarbonate concentration insignificant due to the shift in equilibrium (Equation 2). The remaining formic acid was determined by acid-base titration (Bideau et al., 1980). Careful choice of the base (sodium hydroxide) concentration, elimination of the residual CO2, and the use an adequate indicator, allow this method to be used without any problems.
CO2 + 2 H2O → HCO3– + H3O+ (2)
Adsorption Experiments
Using the P25 from Degussa, dark adsorption experiments were performed. The catalyst was kept in contact with solutions of formic acid for 24 hours with occasional stirring in order to achieve equilibrium. Four different solids masses were used to draw the isotherm. The equation used to calculate the adsorption constant is given as
A eq m
A eq
K C q q
1 K C
=
+ (3)
Photocatalytic and Photolytic Experiments
a) Photocatalysis
W, medium pressure, Hg-vapor lamp was used for irradiation. It was kept 12 cm from the suspension surface, supplying a radiant flux of 108 J m–2 s–1 for wavelengths longer than 254 nm. Throughout the experiments, air was bubbled into the suspension by a diaphragm pump. This apparatus is reported by Azevedo (2003) and Azevedo et al. (2004).
The solids PC100, PC13, and PC5, along with the P25 photocatalyst (for comparison purposes) were tested. The suspension concentration was 500 mg L–1. The irradiated volume was 100 mL for the solids (50 mg in suspension) and 200 mL for the P25 (100 mg in suspension).
b) Photolysis
These experiments were conducted as described previously, but without catalyst and air. This kind of experiment is aimed at isolating the UV decomposition, as formic acid absorbs light in the range of 206 to 212 nm.
c) Kinetic Model
The Langmuir-Hinshelwood approach was used (Equation 4). The catalyst mass (mcat) in suspension
was explicitly used in the model as, according to Herrmann (1999), the kinetic rate increases with it.
AB A CAT
A
k K C dC
r m
dt 1 K C
= =
+ (4)
For the photolytic experiments, two kinetic models (zero- and first-order) were adopted, as described by Equations 5 and 6, respectively.
photolysis AB
dC
r k
dt
= = (5)
photolysis AB
dC
r k C
dt
= = (6)
RESULTS AND DISCUSSION
Adsorption Experiments
The experiments were initially performed with the TiO2 Degussa P25. The experimental data are presented in the isotherm in Figure 1. The estimated parameters are shown in Table 2. A difference in parameters, depending on the estimation method used can be observed. For the original model, the maximum likelihood method was used and the errors of all variables involved were taken into account; for the linearized model, the least squares method was used. The variables were the equilibrium formic acid concentration (Ceq) and the mass ratio of
adsorbate and adsorbent (q). The estimation procedure was performed using the ESTIMA and MAXIMA codes (Noronha et al., 1993).
By analyzing the results in Table 2, it can be observed that the two sets of parameters are quite similar, and in terms of the experimental errors presented in Figure 1, both sets represent the experimental data equally well. With the correlation matrix generated by the ESTIMA code (Figure 2), a strong correlation between the parameters can be seen. This fact was expected due to the structure of the model adopted. Therefore, the confidence range is stretched (Figure 1).
0 200 400 600 800 1000
0.0 0.1 0.2 0.3 0.4 0.5
0.6 Experimental data (with errors bars) Original model
Linearized model Original model upper limit Original model lower limit
q
[
m
g adso
rbed
fo
rm
ic aci
d
/
m
g
sol
id]
Ceq [mg L-1]
Table 2: Formic acid adsorption on TiO2 (P25 Degussa)
Model qm KA CC*
original 0.748 1.21 × 10⁻³ 0.991
linearized 0.618 1.56 × 10⁻³ 0.991
*Correlation coefficient of experimental data and model results.
1.00000 – 0.89246 – 0.89246 1.00000
Figure 2: Model parameters correlation matrix.
In all adsorption calculations, the following errors were considered: ± 0.5 mg L–1 for concentrations and
± 1.0 × 10⁻³ for the ratio q. It is possible to estimate the errors of the parameters with the maximum likelihood estimation procedure. Therefore, the constants were:
qm = 0.748 ± 0.160 and
KA = 1.21 × 10⁻³± 0.450 × 10⁻³ L mg–1.
In order to check the difference between the real adsorption constant and the apparent one, three experiments were performed to obtain the adsorption constant of the PC100 solid. The same procedure as
that adopted previously was used. The results obtained are presented in Table 3.
For this catalyst, the constant figures were qm = 0.189 ± 0.259 and
KA = 0.356 × 10⁻³± 0.636 × 10⁻³ L mg–1.
It can be seen that the error magnitudes are greater than the constants themselves. Therefore, the significance of these parameters is questionable, even though a good correlation coefficient was observed (0.989). This kind of information cannot be obtained by estimation procedures like the least squares one.
Table 3: Formic acid adsorption on PC100
Model qm KA CC*
original 0.189 0.356 × 10⁻³ 0.989
linearized 0.0558 2.61 × 10⁻³ 0.936
*Correlation coefficient of experimental data and model results.
Photolysis
The results obtained for the zero- and first-order kinetic expressions are presented in Table 4. The parameter estimation procedures were also compared, with the original model always used with the maximum likelihood method and the linearized model with the least squares one. It is noteworthy that, as a differential equation was used, an integration method was used simultaneously with the parameter estimation procedure. The integration routine used was the DASSL (Petzold, 1989).
By analyzing the results in Table 4, it can be seen that the original model with first-order kinetics is more suited to describing the experimental data. In Figure 3, it becomes clear that photolysis is not significant in the formic acid mineralization, as after 90 minutes only 15% had been removed.
In all photolysis calculations, the following errors were considered: ± 0.5 mg L–1 for concentrations and ± 0.25 minutes for time. Therefore, the constant figure was
photolysis AB
k = 2.49 × 10⁻³± 0.433 × 10⁻³ mg L–1 min–1.
Table 4: Formic acid photolysis
Model Order kAB C0 CC*
0 0.739 328 0.922
original
1 2.49 × 10⁻³ 328 0.928
0 0.514 314 0.886
linearized
1 1.73 × 10⁻³ 314 0.898
0 10 20 30 40 50 60 70 80 90 100 0
50 100 150 200 250 300 350
Experimental data (with error bars) Zero-order original model First-order original model
First-order original model upper limit First-order original model lower limit
F
o
rm
ic
ac
id
co
nc
en
tr
a
ti
o
n
[
m
g
L
-1 ]
Time [min]
Figure 3: Formic acid photolysis.
Photocatalysis
a) P25 Photocatalyst
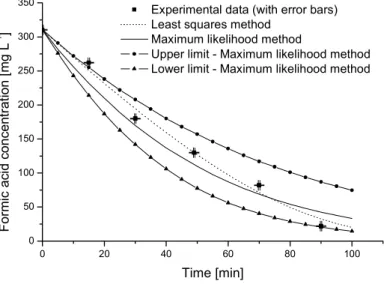
Five experiments were performed in order to obtain its characteristic parameters for the formic acid and the experimental setup in particular. The initial concentration of the formic acid was 310 ± 0.5 mg L–1. The results achieved are presented in Table 5 and Figure 4.
Another significant result is the correlation coefficient between the parameters kAB and KA, which
was - 0.979, indicating that they are strongly
correlated. The introduction of the CO2 competitive adsorption constant during parameter estimation, as suggested by Azevedo (2003) and Azevedo et al. (2004), was not successful because it resulted in a nonsignificant parameter.
b) PC100 Solid
Three experiments were performed in order to estimate the Langmuir-Hinshelwood parameters. The initial concentration of the formic acid was 287
± 0.5 mg L–1. The results achieved are presented in Table 6 and Figure 5.
Table 5: Photocatalysis with P25.
Method kAB KA CC*
Maximum likelihood 4.41 × 10⁻² 2.25 × 10⁻² 1.00
Maximum likelihood**
2.13 × 10⁻¹ 1.21 × 10⁻³ 0.998
Least squares 5.13 × 10⁻² 1.27 × 10⁻² 0.995
*Correlation coefficient of experimental data and model results. ** Only kAB was estimated; KA was taken from adsorption experiments.
0 20 40 60 80 100
0 50 100 150 200 250 300 350
Experimental data (with error bars) Least squares method
Maximum likelihood method
Upper limit - Maximum likelihood method Lower limit - Maximum likelihood method
For
m
ic
ac
id
c
oncen
tr
at
ion [
m
g L
-1 ]
Time [min]
Table 6: Photocatalysis with PC100.
Method kAB KA CC*
Maximum likelihood 3.92 × 10⁻¹ 4.05 × 10⁻³ 1.00
Maximum likelihood** 3.10 × 100 3.56 × 10⁻⁴ 1.00
Least squares 2.44 × 10⁻¹ 1.04 × 10⁻² 0.996
*Correlation coefficient of experimental data and model results. ** Only kAB was estimated; KA was taken from adsorption experiments.
0 10 20 30 40 50 60 70 80 90 100
0 50 100 150 200 250 300 350
Experimental data (with error bars) Least squares method
Maximum likelihood method
Upper limit - Maximum likelihood method Lower limit - Maximum likelihood method
F
o
rm
ic
ac
id
co
n
c
en
tr
at
io
n
[m
g
L
-1 ]
Time [min]
E x p e r i m e n t a l d a t a ( w i t h e r r o r b a r s )
L e a s t s q u a r e s m e t h o d
M a x i m u m l i k e h o o d m e t h o d
U p p e r l i m i t - M a x i m u m l i k e h o o d m e t h o d
L o w e r l i m i t - M a x i m u m l i k e h o o d m e t h o d
F
o
rmic a
c
id
conc
e
n
trati
on [
mgL
-1 ]
Figure 5: Formic acid photocatalysis with PC100.
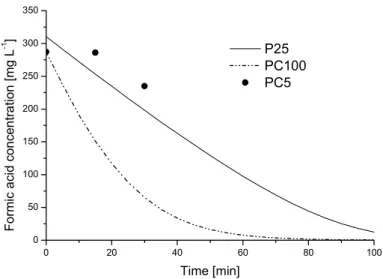
c) Supported Catalysts (PC13 and PC5)
The PC13 solid showed no photocatalytic activity at all, even after 30 minutes of irradiation. The PC5 solid had very little photocatalytic activity, as depicted in Figure 6, where its activity is compared to those of the P25 and PC100. These results are compatible with
those obtained by Loddo et al. (1999), suggesting that it is necessary for the anatase layer to be thick enough so that a complete and characteristic crystalline phase is formed. This is a sine qua non condition for adequate adsorption and maintenance of the necessary charge carrier separation (avoiding their recombination), resulting in photocatalytic activity.
0 20 40 60 80 100
0 50 100 150 200 250 300 350
P25 PC100 PC5
Fo
rm
ic
a
c
id
con
c
en
tr
a
ti
on
[m
g L
-1 ]
Time [min]
CONCLUSIONS
The results obtained confirm the hypotheses regarding bulk photocatalysts characteristics, making clear the lack of photocatalytic activity of the supported catalysts. PC13 and PC5 supported catalysts showed insignificant reaction rates, while
PC100 had an initial reaction rate 2.43 times that of the P25.
The adsorption constants estimated for the photocatalysts P25 and PC100 in independent experiments were different from the ones estimated in the kinetic experiments. This fact reinforces the concept of apparent adsorption constant, that is, a constant different from the real one due to reaction and mass transport aspects.
The adsorption and kinetic constants were obtained through simultaneous solution of the set of differential equations of the kinetic model. The adsorption constant, although strongly correlated with other parameters, gave coherent results when the maximum likelihood estimation procedure was used.
The results allow one to conclude that bulk catalysts have enhanced photocatalytic activity, making it necessary to develop preparation methods that produce solids with larger specific surface areas and higher concentrations of surface anatase.
As the adsorption and kinetic constants are used for comparing catalysts, their estimation errors and significance must be analyzed. P25 and PC100
catalysts had quite different photocatalytic behaviors. This can be observed regardless of the model, the estimation procedure, and the type of adsorption constant. However, when the parameter confidence intervals are assessed for a variation of ± 1σ (standard deviation), the differences between the catalysts are not statistically significant. There is a significant superimposition of the confidence regions. Moreover, the establishment of a ± 1σ deviation means a confidence interval of less than 90%. Even at this confidence level, the validity of some parameters, such as the adsorption parameters for PC100, should be discussed.
These comparisons were mainly made in order to draw attention to the use of estimation procedures without the experimental errors associated with the parameters or that do not evaluate these errors. The results presented are valid for guiding in the preparation of photocatalysts, although there is still the need to perform additional experiments to further clarify this issue.
NOMENCLATURE
C formic acid concentration, mg L–1
Ceq formic acid equilibrium
concentration,
mg L–1
CC correlation coefficient between the estimated figures and the experimental data
(-)
photolysis AB
k photolytic kinetic constant, mg L–1 min–1 (zero-order) and min–1 (first-order)
kAB photocatalytic kinetic
constant, 2
1 1
TiO 1
mg L mg min
− − −
KA formic acid adsorption
equilibrium constant,
L mg–1
mcat mass of catalyst in
suspension,
mg
q equilibrium mass ratio of adsorbate to adsorbent
(-)
qm initial mass ratio of
adsorbate to adsorbent
(-)
r kinetic rate of reaction, mg L–1 min–1
t elapsed time, min
REFERENCES
Azevedo, E.B., Identificação e Toxicidade de Intermediários Formados na Degradação Fotocatalítica e na Ozonização de Fenol em Meio Salino. D. Sc. dissertation, PEQ / COPPE/ Universidade Federal do Rio de Janeiro (2003). Azevedo, E.B., Aquino Neto, F.R. and Dezotti, M.,
TiO2-Photocatalyzed Degradation of Phenol in Saline Media: Lumped Kinetics, Intermediates, and Acute Toxicity, Applied Catalysis B: Environmental 54, 165 (2004).
Bideau, M., Claudel, B. and Otterbein, M., Photocatalysis of Formic Acid Oxidation by Oxygen in Aqueous Medium, Journal of Photochemistry 14, 291 (1980).
Colón, G., Hidalgo, M.C. and Navío, J.A., A Novel Preparation of High Surface Area TiO2 Nanoparticles from Alkoxide Precursor and Using Active Carbon as Additive, Catalysis Today 76, 91 (2002).
Egues, S.M.S., Catalisadores Óxidos para Redução Seletiva de NO com NH3 em Fontes Estacionárias. D.Sc. dissertation, PEQ / COPPE / UFRJ (2002).
Ettinger, M., Highly Dispersed Metallic Oxides Produced by the AEROSIL Process, Degussa’s Technical Bulletin Pigments 56. Frankfurt, Germany (1995).
Hague, D.C. and Mayo, M.J., Controlling Crystallinity During Processing of Nanocrystalline Titania, Journal of the American Ceramic Society 77, 1957 (1994).
Herrmann, J.-M., Heterogeneous Photocatalysis: Fundamentals and Applications to the Removal of Various Types of Aqueous Pollutants, Catalysis Today 53, 115 (1999).
Hoffmann, M., Martin, S., Choi, W. and Bahnemann, D., Environmental Applications of Semiconductor Photocatalysis, Chemical Reviews 95, 69 (1995). Ito, S., Inoue, S., Kawada, H., Hara, M., Iwasaki, M.
and Tada, H., Low-Temperature Synthesis of Nanometer-Sized Crystalline TiO2 Particles and Their Photoinduced Decomposition of Formic Acid, Journal of Colloid and Interface Science 216, 59 (1999).
Loddo, V., Marcì, G., Martín, C., Palmisano, L., Rives, V. and Sclafani, A., Preparation and Characterization of TiO2 (anatase) Supported on TiO2 (Rutile) Catalysts Employed for 4-Nitrophenol Photodegradation in Aqueous Medium and Comparison with TiO2 (Anatase)
Supported on Al2O3, Applied Catalysis B: Environmental 20, 29 (1999).
Nicolella, C. and Rovatti, M., Mathematical Modeling of Monolith Reactors for Photocatalytic Oxidation of Air Contaminants, Chemical Engineering Journal 69, 119 (1998).
Noronha, F.B., Pinto, J.C., Monteiro, J.L., Lobão, M.W. and Santos, T.J., ESTIMA – Pacote Computacional para Estimação de Parâmetros e Projeto de Experimentos, PEQ Internal Report (1993).
Petzold, L.R., DASSL Code, Version 1989, Computing and Mathematics Research Division, Lawrence Livermore National Laboratory, L316, PO Box 808, Livermore, CA 94559 (1989). Plaza, D.M. and Malato, S., Introduction by the EU
Project Coordinators, Catalysis Today 54, 193 (1999).
Saadoun, L., Ayllón, J.A., Jiménez-Becerril, J., Peral, J., Domènech, X. and Rodríguez-Clemente, R., Synthesis and Photocatalytic Activity of Mesoporous Anatase Prepared From Tetrabutylammonium-Titania Composites, Material Research Bulletin 35, 193 (2000).
Serpone, N. and Pelizzetti, E., Photocatalysis — Fundamentals and Applications. John Wiley & Sons, New York (1989).