A
R
T
I
G
O
T
É
C
N
I
C
O
C
I
E
N
T
Í
F
I
C
O
Luciane L. MonteavaroCurso de Pós Graduação em Ciência dos Materiais, UFRGS
Izabel C. Riegel Instituto de Ciências Exatas e Tecnológicas, Centro Universitário Feevale
Cesar L. Petzhold, Dimitrios Samios Instituto de Química, UFRGS
Abstract: New types of polyurethanes were prepared by reacting diisocyanates and formiated soy polyols with different OH functionalities. Thermal properties and degradation kinetics were investigated by TGA. All prepared PU’s showed at least two-weight loss steps, the first one, around 210 °C. Thermal stability of these PUs depends strongly on urethane groups per unit volume and an increase in the weight loss was observed as a result of the increased amount of urethane groups. Degradation kinetics behavior of the soy-based polyurethanes was investigated according to the Flynn method. Different average activation energy values were obtained from isothermal and isoconversional curves, 140.6 KJ/mol and 62.8 KJ/mol, respectively, indicating the complexity of the PUs degradation process.
Keywords: Thermal stability, soy-based polyurethanes, degradation kinetics.
Introduction
Nowadays the use of renewable resources has attracted much attention because of their great potential to replace petrochemical derivatives[1-3]. Soybean oil is an
inexpensive, readily available renewable resource, consisting of triglycerides of fatty acids, and provides an excellent platform for valuable polymeric materials [4]. The
knowledge of the properties of these biomaterials is essential for successful applications.
Polyurethanes prepared from vegetable oils have a number of excellent properties due to the hydrophobic nature of triglycerides [5]. On the other hand, these materials
have relatively low thermal stability, primarily due to the presence of urethane bonds. The onset of urethane bond dissociation is somewhere between 150 and 220 °C, depending on the type of substituents, on the isocyanate and polyol side[6]. Saturated hydrocarbons are known to
have relatively good thermal and thermo-oxidative resistance compared to polyether and polyester polyols derived from petrochemicals.
Thermal stability of polyurethanes based on soy polyols will depend on the functionality of the polyol, i.e., on the number of the urethane groups per unit volume, as well as structural differences.
Javni and coworkers [5] reported a study of thermal
stability of polyurethanes based on vegetable oils such as corn, safflower, sunflower, peanut, olive, soybean, canola and castor oil. In their study, the polyols were obtained by
a two-step reaction. The vegetable oils were first epoxidized and further reacted with alcohol introducing hydroxyl and methoxy groups at the position of double bonds. Oil-based polyurethanes showed better initial thermal stability,when the analysis was performed in air than the commercial PU from poly(propylene glycol), but the situation is reverse in nitrogen atmosphere.
Degradation kinetic of polymers has been studied using by thermogravimetry (TG) with experimental data being processed using the Flynn method, which includes three isothermal and one dynamic TG curves[5-8]. The use of several
isothermal curves combined with a dynamic curve assures more reliable results. The experiments involve running a single dynamic TG at a selected heating rate, β; selecting the region of conversions for which activation energy (E) will be determined; selecting conversions, Ca, Cb, Cc; and their
corresponding absolute temperatures Tβa, Tβb, Tβc. The next
step involves selecting several isothermal temperatures T1,
T2, T3 (which are lower than Tβa), and running isothermal
TG experiments. From the first isothermal curve, the same conversions must be selected as in the dynamic TG curve, Ca, Cb, Cc, and corresponding times, t1a, t1b, t1c. This procedure
is repeated with the second and third isothermal curves to obtain times t2a, t2b, t2c and t3a, t3b, t3c.
The results obtained from the experiment were employed in the construction of a diagram similar to that shown in Figure 1, plotting log tiso against temperatures Tβ, corresponding to different conversions. If a relatively simple degradation process takes place, a grid of straight lines are
obtained. The slope of the isothermal straight lines (T1, T2, T3)
is equal to (-0.457 E/R), where R is the universal gas constant. Activation energy (E) can also be determined from the distance between isoconversional lines. From the distance between times at a given conversion i.e, at isothermals T2 and T1, one can
determine E:
⎟⎟ ⎠ ⎞ ⎜⎜
⎝ ⎛
− =
−
1 2 1
2
1 1 3 . 2 log log
T T R E t
ti i (1)
This method provides the activation energy dependence with conversion and temperature.
Generally, kinetics parameters are meaningful if they refer to a particular chemical reaction. Unfortunately, polymer degradation is always a complex process consisting of a number of parallel and consecutive reactions. Activation energy in such cases refers to the degradation reactions, and a better comprehension of the process should be obtained from the study of the mechanism of degradation.
In this work we have investigated thermal properties of polyurethane networks from formiated soybean oil polyols with different OH contents and diisocyanates. Besides, studies
on the degradation kinetics of the polyurethane prepared from polyol with lower OH functionality (1.9) were also performed. Formiated soy polyols synthesis and the mechanical characterization of the polyurethanes were studied in a previous work[9]. The formiated soy polyols were prepared
by one-step synthesis using the formic acid/H2O2 system. This
method allows preparing soy polyols with OH functionality from 1.9 to 3.2 as shown in Table I. Figure 2 shows the structure of a formiated soy polyol with OH functionality around 3.0 having a saturated hydrocarbon structure with one OH and one formiate group per double bond and one residual epoxy group.
Experimental
Materials
MaterialsMaterials
MaterialsMaterials
Toluenediisocyanate (TDI) was purified by distillation under reduced pressure; 4,4’-methylene bis(phenylisocyanate) (MDI) and 1,6-hexamethylene diisocyanate (HDI) were degassed and used as received.All diisocyanates were supplied by Bayer AG (Leverkusen, Germany). The index of NCO was determined according to the ASTM D5155-96 method.
Figure 1. Schematic representation of the plot of isothermal reaction time vs. reciprocal temperature for selected conversions from dynamic TGA. T1, T2, T3, are isothermal temperatures and Ca, Cb, Cc are selected conversions [5].
e n a h t e r u y l o P
l o y l o P
e t a n a y c o s
I CureTemperature ) C ° (
n o i t c a e R e m i T
) h (
r e b m u N H O
g / H O K g
m Functionality
1 0 U
P 104 1.9 TDI 60 24
2 0 U
P 136 2.5 TDI 60 24
3 0 U
P 152 2.9 TDI 60 24
4 0 U
P 166 3.2 TDI 60 24
5 0 U
P 104 1.9 MDI 60 24
6 0 U
P 104 1.9 HDI 60 24
7 0 U
P 104 1.9 TDI 100 15
8 0 U
P 104 1.9 TDI 100 24
9 0 U
P 104 1.9 TDI 100 48
Table 1. Soy polyol characteristics and cure conditions of PU.
Formiated soybean polyol was synthesized as described elsewhere[9]. The OH content was determined according to
the AOCS Official Method Te2a-64.
Synthesis of P Synthesis of P Synthesis of P Synthesis of P
Synthesis of Polyurolyurolyurolyurolyurethanesethanesethanesethanesethanes
Formiated soy polyols were maintained under vacuum for 2h before polymerization. The polyurethanes were prepared by mixing the polyols with different diisocyanates at 60 °C or 100 °C, and pouring the mixtures into molds. Samples were heated to complete curing. The NCO/OH ratio used was 0.80. The complete cure of PU was determined by infrared spectroscopy by monitoring the disappearance of isocyanate absorption at 2270 cm-1. Table 1 summarized the polyurethanes
cure conditions. Methods Methods Methods Methods Methods
Thermogravimetric analysis was carried out under nitrogen atmosphere (50 mL/min) on a TG Analyzer, model TGA-50, from Shimadzu. The heating rate of 10 °C min-1 was used for
the dynamic TG. Isothermal measurements were carried out at 230, 240 and 250 °C.
Results and Discussion
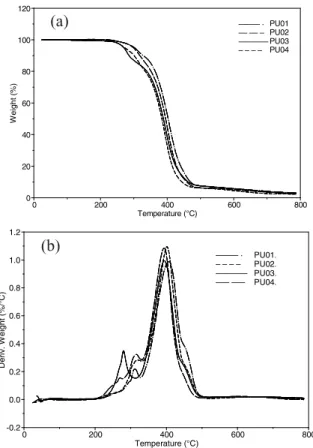
Dynamic TG curves of polyurethanes prepared from polyols with different OH contents and TDI (PU01-PU04) are shown in Figure 3a. The corresponding derivative curves reveal two or three main degradation processes (Figure 3b). All polymers showed an initial weight loss in the range of 210-310 °C, suggesting that degradation starts at the urethane bond[10]. It can be observed that the initial degradation
temperature is shifted to lower temperature with increasing the polyol OH-functionality. Urethanes are known to be relatively thermally unstable materials[11-12]. Decomposition of the
urethane bond starts at about 150-220 °C leading to the formation of primary amine and olefin or to the formation of secondary amine and carbon dioxide[5]. The weight loss with a
maximum at 400 °C is associated with others segments of the remaining structure. Thermal stability of these PUs depends strongly on urethane groups per unit volume and an increase in the initial weight loss was observed as a result of the increase in the amount of urethane groups. We observed an initial weight loss of around 10% for PU01, 14% for PU02, 15% for PU03 and 19% for PU04, which were prepared, respectively, with soy-polyols of 1.9, 2.5, 2.9 and 3.2 OH-functionality. Javni et al.[5] in their study with PU´s from different vegetable polyols
obtained a higher initial weight loss temperature of 270 °C. However it was observed the same weight loss percentage of around 20% for the initial step for all polyurethanes irrespective of the polyol OH-functionality.
TG curves corresponding to polyurethanes prepared from polyol with OH-functionality of 1.9 and different diisocyanates (PU01, PU05, PU06) are showed in Figure 4a. They all presented a similar weight loss profile with the first step appearing at around 10% weight loss, since the soy-PU´s have the same amount of urethane groups. In Figure 4b are
PU01 PU02 PU03 PU04 0 20 40 60 80 100 120 W e ight ( % )
0 200 400 600 800
Temperature (°C) ––––– · –– –– – ––––––– – – – – -0.2 0.0 0.2 0.4 0.6 0.8 1.0 1.2 D e ri v . W e ig ht (% /° C )
0 200 400 600 800
Temperature (°C)
––––– · PU01.001 – – – – PU02.001 ––––––– PU03.001 ––– ––– PU04.001
(a)
(b)
Figure 3. TG curves (a) and Derivative TG (b) of polyurethanes prepared by polyols having different OH functionality with TDI (PU01, PU02, PU03 and PU04). (10 °C. min-1, nitrogen)
0 20 40 60 80 100 120 We ig h t ( % )
0 200 400 600 800
Temperature (°C)
––––––– PU01.001 – – – – PU05.001 ––– ––– PU06.001
0 20 40 60 80 100 120 We ig h t ( % )
0 200 400 600 800
Temperature (°C)
––––––– PU01.001 – – – – PU05.001 ––– ––– PU06.001
0 20 40 60 80 100 120 W e ight ( % )
0 200 400 600 800
Temperature (°C)
––––––– PU01.001 – – – – PU07.001 ––––– · PU08.001 ––– ––– PU09.001
0 20 40 60 80 100 120 W e ight ( % )
0 200 400 600 800
Temperature (°C)
––––––– PU01.001 – – – – PU07.001 ––––– · PU08.001 ––– ––– PU09.001
Figure 4. (a) TG curves of polyurethanes prepared by the same polyol with different diisocyanates: TDI (PU01), MDI (PU05) and HDI (PU06) (b) TG curves of polyurethanes cured at 100oC during 15h (PU07), 24h (PU08) and 48h (PU09). To comparison the TG curve of the PU01, cured at 60 °C during 24h is also showed. (10 °C.min-1, nitrogen).
(a)
calculated from the slope of isothermal curves and distance between isoconversionals are given in Table 2. If the isothermals are fairly parallel, the activation energy does not appreciably change with temperature. However, Figure 5b illustrates irregular spacing (nonparallel) between isothermals, demonstrating the complexity of the process. Average activation energy for the temperature region of 230-250 °C of 140.6 KJ/mol and average activation energy for the conversion region below 10% of 62.8 KJ/mol were calculated. This large difference between the activation energy reflected the complex nature of the degradation process, which can be observed by the decrease of the activation energy with increasing conversion. Very similar behavior was observed by Javni et al[5] for the degradation of polyurethanes
based on soybean oil in air. Nonetheless, in nitrogen parallel isothermals were obtained. They stated that the initial mechanism of urethane decomposition is the same both in air and nitrogen and further oxidation of the products in air introduces the differences. Based on these results we suppose that the different kinetics degradation observed in our study is related to the different chemical structure of the soy-polyol, i. e., the presence of formiate and epoxy groups, which should influence the initial degradation step (below 10% conversion) becoming the degradation process more complex.
Conclusions
Thermal degradation of soy-based polyurethanes was studied by TG. Polyurethanes prepared from formiated polyols with different OH functionalities showed an initial weight loss process at 210 °C, which was dependent of urethane groups concentration. Conversely, when comparing the weight loss behavior of PU from the same polyol with different diisocyanates, it was found that the weight loss curves were almost identical and the first step showed a 10% weight loss for all samples.
The kinetics degradation study in nitrogen resulted in nonparallel isothermals indicating the complexity of the PU degradation, probably due to the influence of the formiate groups, present in the chemical structure of the soy polyols, on the initial degradation step.
Acknowledgments
CNPq, CAPES, FAPERGS
References
1. Zhang, Y., Hourston, D. J. - J. Appl. Polym. Sci., 69, p.271 (1998).
2. Roy, T. K., Mannari, V. M., Raval, D. A. - J Scientific and Indust. Research, 56, p.159 (1997).
3. Ahmad, S., Ashraf, S. M., Sharmin, E., Zafar, F., Hasnat, A. – Prog. in Crystal. Growth Charact. Mat., 45, p.83 (2002).
4. John, J., Bhattacharya, M., Turner, R. B. - J. Appl. Polym. Sci., 86, p.3097 (2002).
, s l a m r e h t o s I m o r f E
l o m / J K
, s l a n o i s r e v n o c o s I m o r f E
l o m / J K
C ° 0 3
2 240°C 250°C 4% 5% 7%
3 . 2 3
1 149.0 140.4 65.7 63.8 58.8 Table 2. Activation energy of the initial step of degradation (below 10% weight loss) in nitrogen of PU04.
presented TG curves of PU07, PU08 and PU09 prepared from the same polyol, but at a higher cure temperature (100 °C) and at different reaction times (15, 24 and 48h). The TG curves are identical to the PU01, cured at 60 °C and 24h, indicating that the cure temperature and time have no influence on the thermal stability.
Figure 5a presents the rate of weight loss of the isothermal measurements at 230, 240 and 250 °C for PU01. As expected the curves showed an increase in the rate loss with temperature. From dynamic TG curves, the temperatures corresponding to 4, 5 and 7% weight loss were measured. From isothermal curves, the corresponding times to achieve these conversions at 230, 240 and 250 °C are defined as tiso (isoconversional time). Figure
5b showed the dependence of degradation times in nitrogen upon conversion at three different temperatures. Activation energy
Figure 5. (a) Isothermal TG curves for PU04 at 230, 240 and 250 °C in
nitrogen, (b) Dependence of degradation times in nitrogen on conversion at three temperatures (isothermal and isoconversional lines) for PU04.
(a)
5. Javni, I., Petrovic, Z.S., Guo, A., Fuller, R. - J. Appl. Polym. Sci., 77, p.1723 (2000).
6. Wirpsza, Z. - “Polyurethanes, Chemistry, Technology and Application”, Ellis Horwood, New York (1993).
7. McCaffery, E.M. - “Laboratory Preparation for Macromolecular Chemistry”, McGraw-Hill Book Co, New York (1970).
8. Flynn, J.H., Wall, L.A. - J. Polym. Sci., B4, p.323 (1966).
9. Monteavaro, L.L., da Silva, E.O., Costa, A.P.O., Samios, D., Gerbase, A.E., Petzhold, C.L. – Journal of the American Oil Chemists’ Society, 82(5), p365 (2005).
10. Saunders, J.R. – Rubber Chem Technol, 32, p.337 (1985).
11. Gaboriaud, F., Vantelon, J.P. - J. Polym. Sci Polym Chem, 20, p. 2063 (1982).