z
Tiago Gil da Silva Paiva
Licenciado em Química Aplicada – Perfil de Química Orgânica
Synthesis and characterization of
C
3-symmetric 1,3,5 -
Benzenetricarboxamide
derived supramolecular systems
Dissertação para obtenção do Grau de Mestre em Química Bioorganica
Orientador: Marta Cristina Parracho Cançado Corvo, Investigador Pós-Doc, FCT-UNL
Co-orientador: Eurico José da Silva Cabrita, Professor Auxiliar, FCT-UNL
Júri:
Presidente: Prof. Doutora Paula Cristina de Sério Branco
Arguente: Doutora Maria Manuel Martinho Sequeira Barata Marques Vogal: Doutora Marta Cristina Parracho Cançado Corvo
Synthesis and characterization of C3-symmetric 1,3,5 – Benzenetricarboxamidederived supramolecular systems
Copyright © Tiago Gil da Silva Paiva, Faculdade de Ciências e Tecnologia da Universidade Nova de Lisboa.
A Faculdade de Ciências e Tecnologia e a Universidade Nova de Lisboa têm o direito,
perpétuo e sem limites geográficos, de arquivar e publicar esta dissertação através de
exemplares impressos reproduzidos em papel ou de forma digital, ou por qualquer outro meio
conhecido ou que venha a ser inventado, e de a divulgar através de repositórios científicos e
de admitir a sua cópia e distribuição com objectivos educacionais ou de investigação, não
Agradecimentos
Gostaria de agradecer ao professor Dr. Eurico Cabrita e à Dra. Marta Corvo pela sua orientação e pela oportunidade que me deram de desenvolver a tese no seu grupo num ambiente de aprendizagem constante.
Resumo
O objetivo deste trabalho foi estudar o processo de self-assembly de moléculas C3
-simétricas. Para atingir este objectivo derivados de 1,3,5 - benzenotricarboxamidas (BTA) foram preparados. Cinco moléculas C3-simétricas foram sintetizados com rendimentos de
moderados a bons (39-72%) usando azo-benzeno, anilina, benzilamina, triptofano e tirosina. O comportamento de agregação dos derivados de BTA foi estudado por espectroscopia de
1
H-NMR, 1H-1H 2D Nuclear Overhauser Effect Espectroscopia (NOESY) e Diffusion Ordered Spectroscopy (DOSY). Estas experiências permitiram estudar a influência de grupos que estabelecem ligações de hidrogénio, anéis aromáticos, ligações insaturadas e a geometria global de self-assembly molecular associado com os diferentes padrões estruturais presentes em tais moléculas.
O empilhamento e comportamento de grande molécula é observado em BTA 1, derivado de anilina, BTA 4, derivado tirosina ou BTA 5, derivado do triptofano, com vários desses grupos funcionais discutidos tais como ligações insaturadas e grupos que estabelecem pontes de hidrogénio.
Abstract
The aim of this work was to study the self-assembly process of C3-symmetric
molecules. To accomplish this objective 1,3,5 – benzentricarboxamides (BTA) derivatives were obtained. Five C3-symmetric molecules were synthesized in moderate to good yields
(39-72%) using azo-benzene, aniline, benzylamine, tryptophan and tyrosine. The aggregation behavior of the BTA derivatives was probed with 1H-NMR spectroscopy, 1H-1H 2D Nuclear
Overhauser Effect Spectroscopy (NOESY) and Diffusion Ordered Spectroscopy (DOSY). These experiments allowed to study the influence of H-bonding groups, aromatic rings, unsaturated bonds and the overall geometry in the molecular self-assembly associated with the different structural patterns present on these molecules.
The stacking and large molecule behavior where observed in BTA 1, aniline derivative, BTA 4, tyrosine derivative or BTA 5, tryptophan derivative, with several of those discussed functional groups such as unsaturated bonds and H-bonding groups.
Keywords
AK Attenuated equilibrium constant model ar Aromatic
BBO Broadband Observe Br Broad
BTA Benzenetricarboxamide BTC Benzenetricarbonyl
COSY Correlation Spectroscopy δ
IR Deformation vibration NMR Chemical shift d Doublet
DCM Dicloromethane dd Doublet of doublets
ddd Doublet of doublets of doublets DMF Dimethylformamide
DMSO Dimethylsulfoxide
DOSY Diffusion Ordered Spectroscopy EK Equal equilibrium constant model HF Hartree-Fock
HMBC Heteronuclear Multiple-bond Correlation Spectroscopy HSQC Heteronuclear Single Quantum Coherence Spectroscopy K Equilibrium constant
Ip In-plane m Multiplet
NOE Nuclear Overhauser Effect
NOESY Nuclear Overhauser Effect Spectroscopy STO Slater Type Orbitals
mp Melting point ppm Parts per million q Quartet
s
IR Strong NMR Singlet Sh Sharp
st Stretch sy symmetric t Triplet
TEA Triethylamine THF Tetrahydrofuran
TLC Thin layer chromatography TMS Tetramethylsilane
w Weak
Table of contents
Agradecimentos ii
Resumo iv
Abstract v
Keywords vi
Table of contents 1
Index of figures 2
1. Introduction 6
2. Objectives 13
3. Experimental 14
3.1 Synthesis 15
3.2 Self-assembly studies 25
3.3 Preliminary interaction studies 27
4. Results and discussion 28
4.1 Synthesis 28
4.2 Self-assembly studies 33
4.3 Preliminary interaction studies 49
5. Conclusions and future perspectives 54
Annexe 56
Index of figures
Figure 1 - Example of several non-covalent forces in supramolecular chemistry 7
Figure 2 - Structure of acylhydrazone derivatives cappable of assembly into spherical aggregates 7
Figure 3 - Chemical equilibrium in a growing stack14 (image adapted from ref 14) 7
Figure 4 - Structure of 5,10,15,20-Tetra(4-pyridyl)-21H,23H-porphine opposed to an overview of
the condition/morphologies that can be obtained with this compound 8
Figure 5 - Model of a 3:3 complex between CD40 and CD40L opposed to CD40 mimetic compounds
(taken from ref37) 9
Figure 6 – C3 symmetric basket type receptor for organophosphates (adapted from ref 47) 10
Figure 7 - Inclusion complex of ammonium ion in an oxazoline-based receptor 10
Figure 8 - Structure of compound 1 opposed to hollow spheres in 1:1 THF-H2O and fibers in 1:1
DMSO-H2O 11
Figure 9 - Scheme for the Curtius synthesis of BTA derivative 11
Figure 10 – Scheme for Rohm and Haas patented BTA derivative synthesis 11
Figure 11 - Scheme for common synthesis of BTA derivatives 12
Figure 12 - Scheme of the reaction of the synthesis of BTA derivative 1 15
Figure 13 - Scheme of the reaction of synthesis of BTA derivative 2 16
Figure 14 - Scheme of the reaction of synthesis of BTA derivative 3 17
Figure 15 - Scheme of the reaction of synthesis of Tyrosine Methyl Ester Hydrochloride 18
Figure 16 - Scheme of the reaction of synthesis of BTA derivative 4 19
Figure 17 - Scheme of the reaction of synthesis of BTA derivative 4 19
Figure 18 - Scheme of the reaction of synthesis of BTA derivative 4 20
Figure 19 - Scheme of the reaction of synthesis of BTA derivative 4 20
Figure 20 - Scheme of the reaction of synthesis of BTA derivative 4 21
Figure 21 - Scheme of the reaction of synthesis of BTA derivative 4 21
Figure 22 - Scheme of the reaction of synthesis of Tryptophan Methyl Ester Hydrochloride 22
Figure 23 - Scheme of the reaction of synthesis of BTA derivative 5 23
Figure 24 - General scheme for the synthesis of BTA 1-5. 28
Figure 25 – Correlation of the amide proton and vicinal proton in the COSY spectrum of BTA 5 in
DMSO-d6 30
Figure 26 – Correlation of the amide and BTC core with the amide carbonyl in the HMBC spectrum
of BTC 5 in DMSO-d6 31
Figure 27 – 1H-1H NOESY correlation between the amide proton and the BTC core in the BTA 5 31
Figure 28 - Comparison of dispersion of aggregates size in a cooperative and isodesmic
Figure 29 - Comparison of BTA 1 spherical aggregates obtained in THF-H2O a) 60:40 b) 80:20 c)
100:0 34
Figure 30 – Stacked spectra of dilution experiment of BTA 1 in THF 35
Figure 31 - Zoom in the aromatic region of BTA 1 in the water titration experiment in THF-d8:THF
(1:9) 36
Figure 32 – Overview of the signals shift in BTA 1 1H-NMR water titration experiment 36
Figure 33 - Plot of Δδ against concentration of BTA 1 38
Figure 34 – Aromatic region of 1H-NMR concentration dependent spectra of compound 1 in
DMSO-d6 39
Figure 35 – Overview of the Δδ in the BTA 1 concentration dependent 1H-NMR experiments 40
Figure 36 - Origin fits to eq. 4 for BTA 2 a) amide proton, b) BTC core proton and c) H6, H6’ 41
Figure 37 - Plot of Δδ against concentration of BTA 4 42
Figure 38 - Overview of the Δδ in the BTA 4 concentration dependent 1H-NMR experiments 42
Figure 39 - Plot of Δδ against concentration of BTA 5 43
Figure 40 - Overview of the Δδ in the BTA 5 concentration dependent 1H-NMR experiments 43
Figure 41 – HF/STO-3G results of the geometry optimizations of a. BTA 1, b. BTA 2, c. BTA 3, d. BTA
4 and e. BTA 5 44
Figure 42 - Proposed assembly for a reported molecular basket (image adapted form ref. 74) 44
Figure 43 - NOESY spectrum of BTA 1 at 12.7 mM in DMSO-d6 45
Figure 44 - NOESY spectrum of BTA 1 at 2.68 mM in DMSO-d6 46
Figure 45 - NOESY spectrum of BTA 2 at 20mM in DMSO-d6 47
Figure 46 - Aromatic region of BTA 5 in the titration experiment with glucose 49
Figure 47 - Zoom in the aromatic region of BTA 5 stacked 1H-NMR spectra in the titration
experiment with ammonium chloride at 25 ºC. Guest/host ratio is displayed on the spectra
starting from a condition (*) with only host present at 6.23 mM 50
Figure 48 - Zoom in the aromatic region of BTA 5 stacked 1H-NMR spectra in the titration
experiment with ammonium chloride at 35 ºC. Guest/host ratio is displayed on the spectra
starting from a condition (*) with only host present at 6.84 mM 50
Figure 49 - Overview of the Δδ in the BTA 5 ammonium chloride titration experiments 51
Figure 50 – Proposed ammonium-BTA 5 interaction 51
Figure 51 - Δδ against guest/host proportion in the BTA 5 ammonium chloride titration
experiment at 25 ºC 52
Figure 52 - Δδ against guest/host proportion in the BTA 5 ammonium chloride titration
experiment at 35 ºC 52
Figure 53 – Possible BTA derived compound with 4-styrylaniline as asubstituent 55
Figure 54 – Melamine core 55
Figure 55 - 1H NMR spectrum of BTA 1 in DMSO-d6 67
Figure 56 - 13C NMR spectrum of BTA 1 in DMSO-d6 67
Figure 57 - COSY spectrum of BTA 1 in DMSO-d6 68
Figure 59 - HMBC spectrum of BTA 1 in DMSO-d6 69
Figure 60 - 1H NMR spectrum of BTA 2 in DMSO-d6 69
Figure 61 – 13C NMR spectrum of BTA 2 in DMSO-d6 70
Figure 62 - COSY spectrum of BTA 2 in DMSO-d6 70
Figure 63 - HSQC spectrum of BTA 2 in DMSO-d6 71
Figure 64 - HMBC spectrum of BTA 2 in DMSO-d6 71
Figure 65 - 1H NMR spectrum of BTA 3 in DMSO-d6 72
Figure 66 – 13C NMR spectrum of BTA 3 in DMSO-d6 72
Figure 67 - COSY spectrum of BTA 3 in DMSO-d6 73
Figure 68 - HSQC spectrum of BTA 3 in DMSO-d6 73
Figure 69 - HMBC spectrum of BTA 3 in DMSO-d6 74
Figure 70 – Water suppressed 1H NMR spectrum of tyrosine methyl ester hydrochloride in D2O 74
Figure 71 – 13C NMR spectrum of tyrosine methyl ester hydrochloride in D2O 75
Figure 72 – COSY spectrum of tyrosine methyl ester hydrochloride in D2O 75
Figure 73 - HSQC spectrum of tyrosine methyl ester hydrochloride in D2O 76
Figure 74 - HMBC spectrum of tyrosine methyl ester hydrochloride in D2O 76
Figure 75 - 1H NMR spectrum of BTA 4 in DMSO-d6 77
Figure 76 – 13C NMR spectrum of BTA 4 in DMSO-d6 77
Figure 77 - COSY spectrum of BTA 4 in DMSO-d6 78
Figure 78 - HSQC spectrum of BTA 4 in DMSO-d6 78
Figure 79 - HMBC spectrum of BTA 4 in DMSO-d6 79
Figure 80 - Water suppressed 1H NMR spectrum of tryptophan methyl ester hydrochloride in D2O
79
Figure 81 – 13C NMR spectrum of tryptophan methyl ester hydrochloride in D2O 80
Figure 82 - COSY spectrum of tryptophan methyl ester hydrochloride in D2O 80
Figure 83 - HSQC spectrum of tryptophan methyl ester hydrochloride in D2O 81
Figure 84 - HMBC spectrum of tryptophan methyl ester hydrochloride in D2O 81
Figure 85 - 1H NMR spectrum of BTA 5 in DMSO-d6 82
Figure 86 – 13C NMR spectrum of BTA 5 in DMSO-d6 82
Figure 87 - COSY spectrum of BTA 5 in DMSO-d6 83
Figure 88 - HSQC spectrum of BTA 5 in DMSO-d6 83
Figure 89 - HMBC spectrum of BTA 5 in DMSO-d6 84
Figure 90 - NOESY spectrum of BTA 2 at 20.90 mM in DMSO-d6 84
Figure 91 - NOESY spectrum of BTA 3 at 20.94 mM in DMSO-d6 85
Figure 92 - NOESY spectrum of BTA 3 at 0.84 mM in DMSO-d6 85
Figure 93 - NOESY spectrum of BTA 4 at 9.80 mM in DMSO-d6 86
Figure 94 - NOESY spectrum of BTA 4 at 0.98 mM in DMSO-d6 86
Figure 95 - NOESY spectrum of BTA 5 at 20.97 mM in DMSO-d6 87
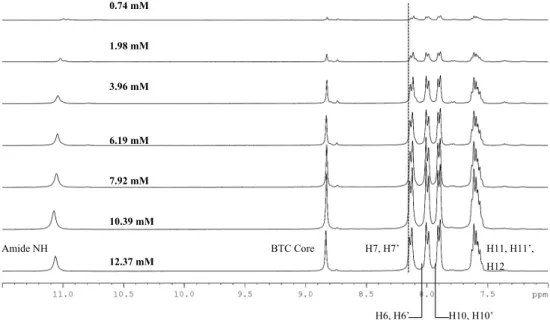
Figure 97 - Aromatic region of BTA 1 concentration dependent spectra from 0.74 mM to 12.37 mM
88
Figure 98 - Full stack of BTA 2 concentration dependent spectra from 0.84 mM to 20.90 mM 88
Figure 99 - Aromatic region of BTA 2 concentration dependent spectra from 0.84 mM to 20.90 mM
89
Figure 100 - Full stack of BTA 3 concentration dependent spectra from 0.84 mM to 20.94 mM 89
Figure 101 - Aromatic region of BTA 3 concentration dependent spectra from 0.84 mM to 20.94
mM 90
Figure 102 - Full stack of BTA 4 concentration dependent spectra from 0.98 mM to 9.80 mM 90
Figure 103 - Aromatic region of BTA 4 concentration dependent spectra from 0.98 mM to 9.80 mM
91
Figure 104 - Full stack of BTA 5 concentration dependent spectra from 0.86 mM to 21.58 mM 91
Figure 105 - Aromatic region of BTA 5 concentration dependent spectra from 0.86 mM to 21.58
mM 92
Figure 106 – Full stack of 1H-NMR spectra in the water titration experiments of BTA 1 in THF from
2.0% of added H2O to 15.3% 92
Figure 107 - Full stack of 1H-NMR experiments in the glucose titration 93
Figure 108 - Full stack of 1H-NMR experiments in the ammonium chloride titration at 25 ºC
starting with only host present until a guest/host ratio of 1.45 93
Figure 109 - Full stack of 1H-NMR experiments in the ammonium chloride titration at 35 ºC
1.
Introduction
Supramolecular chemistry as stated by Lehn1 is the “chemistry beyond the molecule”, structures that by intermolecular or intramolecular non-covalent interactions give rise to higher complexity and ordered architectures.
Traditionally, chemistry relies upon the covalent bond in step by step reactions until the formation of the desired compound, that fact makes it quite hard to build very large and complex systems.2 By synthetizing a molecule that can assemble in solution into the desired final structure one can overcome that problem, so the interest in going beyond the covalent bond is in the building of large and complex molecules in an easier way.
The term supramolecule (or supermolecule as it was first named) is first employed by Wolf3 in his paper about hydrogen bonding in acetic acid dimers. Since then is a general description for a wide range of different types of assemblies such as dendrimers4,5, micelles6, vesicles7 or liquid crystals8. With the exception of dendrimers that are covalently bonded, non-covalent forces usually form these assemblies.
The process that forms these types of molecules is called self-assembly which is the spontaneous and reversible self-organization of molecules in solution9.
It is found in nature many examples of biological self-assembled structures such as protein-based complexes, hemoglobin10 or nucleic acid derivatives such as DNA double chain.11 Self-assembly and organization typically occurs between at least two molecules, one exception to that are proteins in which the tertiary structure, and quaternary if existent, assemble from one molecule intramolecular interactions only.
Forces such as hydrogen bonding, π-π stacking, hydrophobic interactions govern the assembly process, it’s the cumulative effect of these interactions that held the supramolecular structure together. Shown in
Figure 1 is an example of several forces involved in the assembly of a reported acylhydrazone derivative (Figure 2).13
Figure 1 - Example of several non-covalent forces in supramolecular chemistry
Figure 2 - Structure of acylhydrazone derivatives cappable of assembly into spherical aggregates
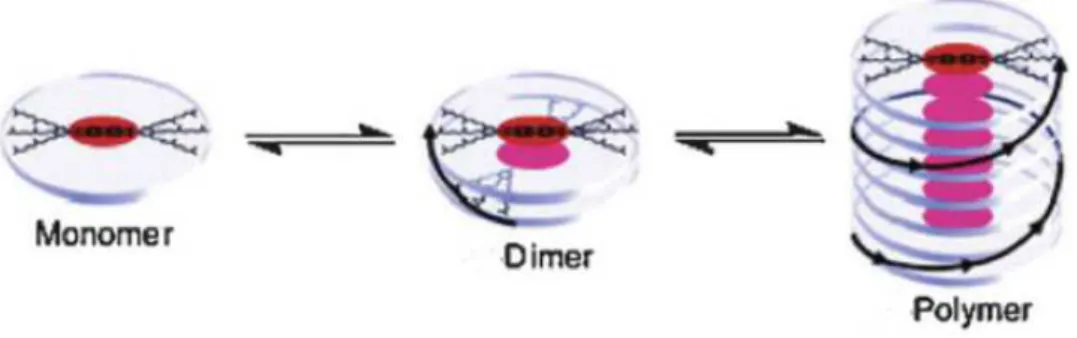
The assembly process can be quite different depending on the involved molecules (the monomers) and that translate it into the chemical equilibrium. One can have a simple dimerization in solution or it can grow into a superior size aggregate (Figure 3).
Figure 3 - Chemical equilibrium in a growing stack14 (image adapted from ref 14)
N
N N H
O
C17H35
N N H
O
C17H35
N N H O
An organisation of molecules in solution results in the loss of degrees of freedom that has an entropic penalty in the thermodynamics of the assembly process. In order to overcome the loss in entropy of the system, the enthalpic contribution of each interaction as to make the final structure thermodynamically favoured and that makes the binding interactions a crucial point of the assembly process.
Overall the type of assembly achieved depends on the structure of the monomers and how they interact in order to assemble into a higher ordered structure. That can result in different morphologies and shapes of aggregates such as fibers15, rods16 or spherical aggregates.17
For the controllability of this type of structures, one has to understand how their assembly occurs and how the chemical equilibrium is established in solution. Qiu et al in their 2010 paper discovered that by controlling the surface tension and the nano particle aging time could obtain different final morphologies like bulk spheres, hollow spheres and nanotubes18.
Figure 4 - Structure of 5,10,15,20-Tetra(4-pyridyl)-21H,23H-porphine opposed to an overview of the condition/morphologies that can be obtained with this compound
The control of the morphology of the aggregate is important in the development of smart responsive materials19,20,21 that can be used for biomedical applications, environmental sciences or information technologies.22 A possible medical application is the development of drug delivery methods. Those can be made to encapsulate a drug and deliver it by the application of an external stimulus that disrupts the structure and delivers the drug on the intended target.
Because of biocompatibility macromolecules such as peptides,23,24 lipids, 25–
27
sugars28,29 or nuclei acids30–32 are usually employed.
There are other types of structures and compounds that can be used and are under different stages of development, for instance metallic nanoparticles33–35 are one used for drug delivery and imaging agents,36 others being non-lipidic polymeric materials, but they lack the controllability factor that one can achieve using small responsive organic compounds.
N N
N
N
N N
N N
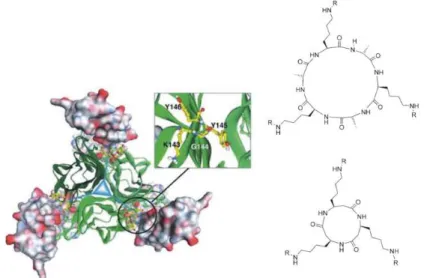
C3-Symmetry is a known ordering motif found in nature.37,38 In 2005 Fournel39at al
developed a low molecular weight CD40L receptor based on CD40 a natural receptor that by binding its ligand contributes to regulation of B cell proliferation, immunoglobulin production, immunoglobulin class switching, germinal center formation and development of B cell memory.
Figure 5 - Model of a 3:3 complex between CD40 and CD40L opposed to CD40 mimetic compounds (taken from ref. 37)
C3-Symmetric compounds have been studied for several applications, such as the
development of catalysts in the area of asymmetric catalysis,40,41 and in the area of chiral separation. These compounds have also been employed in the development of chiroptical devices42 since chiral helical gels become non-random coiled, if some monomer molecules are chiral or in the presence of a small quantity a second optical active compound enclosed in the stack. That principle of a few molecules that governs the bulk assembly process is called the “sergeants-and-soldiers“ principle43,44 and has been fairly reported in literature.
The field of molecular recognition for the development of sensors which has always been a part of the study of supramolecules in host-guest interactions and sensing applications.45
Several C3-symmetric compounds are reported to act as molecular receptors39 for sensing
Figure 6 – C3 symmetric basket type receptor for organophosphates (adapted from ref. 47)
A C3-symmetric compound bearing oxazoline groups has been reported to bind
ammonium ions49 there are also several studies that report that amino acid aromatic side-chains interact with cation by cation-π interactions.50,51 In Figure 7 is presented a complex made by the recognition of a ammonium ion by a oxazoline based receptor.52
Figure 7 - Inclusion complex of ammonium ion in an oxazoline-based receptor
The assembly process of a 1,3,5 - C3-symmetric benzenetricarboxamide (BTA) was
Figure 8 - Structure of compound 1 opposed to SEM images of hollow spheres in 1:1 THF-H2O and fibers in 1:1 DMSO-H2O
On the synthesis of these kind of molecules, the first BTA molecule was reported in 1915 by Curtius54 the reaction involved the use of benzene-1,3,5-tricarboxylic acid as the starting material obtaining the triacyl triazide via the triester. The triacyl triazide was then treated with aniline resulting in the formation of a triphenyl substituted BTA. The highly explosive triacyl triazide, however, does not allow large-scale preparation of BTAs.
Figure 9 - Scheme for the Curtius synthesis of BTA derivative
In 1954 Rohm and Haas patented55 the preparation of the tris(vinyloxyethyl) BTA analogue, starting from trimethyl benzene-1,3,5-tricarboxylate and 2-vinyloxyethylamine. This amidation reaction required high reaction temperatures and long reaction times.
Figure 10 – Scheme for Rohm and Haas patented BTA derivative synthesis
In 1959, the tris(ortho-nitrophenyl) analogue was obtained56 by first reacting benzene-1,3,5-tricarboxylic acid with thionyl chloride, the acid chloride formed then reacted with an amine at room temperature. This synthetic procedure significantly reduced the reaction time, as a result of the reactive acid chloride intermediate.
O
N3
O N3
O N3 O HO O OH O OH O N H O N H O NH O N H O NH O NH O O O O O O
H2N
The most common57 synthetic strategy to prepare C=O-centred BTAs today is the reaction of benzene-1,3,5-tricarbonyl trichloride with the appropriate amine in the presence of base, although direct functionalization of benzene-1,3,5-tricarboxylic acid with the appropriate amine by using coupling agents is also frequently applied.
Figure 11 - Scheme for common synthesis of BTA derivatives
O Cl
O Cl O
Cl
O NHR
O RHN
O
NHR NHR
2.
Objectives
It is imperative to gain a molecular detailed knowledge of the self-assembly process to be able to tune it for specific applications. As was mentioned before the assembly process of 1,3,5 - C3-symmetric benzenetricarboxamide (BTA) was earlier described in literature.53
One problem with this kind of molecules is that they are usually insoluble in water and this narrows its possible applications (medical applications for instance), so it is also important to tune their solubility properties by introducing structural modifications.
NMR spectroscopy can be a valuable tool to gain structural insight into the self-assembly process since it can be used to probe local effects such as chemical shift differences, relaxation times, intramolecular or intermolecular interactions and diffusion measurements that correlates with molecular size.
Based on the already reported C3-symmetric 1,3,5 BTA compounds that stack into
supramolecular helical gel and fibbers, the approach employed in this work was to introduce structural modification in the 1,3,5 – C3-symmetric BTA. This can be achieved by
synthetizing several derivatives with different substituents that will induce changes in conformation of the molecule, H-bonding capability and how the extent of the aromatic system relate with π- π stacking in order to relate these structural features with the stacking (self-assembly) process itself. This knowledge of how to fine tune the aggregation process on a molecular level is imperative in the development of smart materials.
To study the aggregation and self-assembly process NMR spectroscopy was explored as the main tool. Since C3-symmetric compounds have been reported to bind ions and small
3.
Experimental
Materials and methods
FTIR absorption spectra were recorded using 16 scans on a Perkin Elmer Spectrum BX spectrometer using KBr as support, the most intense and/or characteristic vibrations are presented stating their intensity and shape with the following abbreviations: br, broad; sh, sharp; s, strong; m, medium; w, weak; ar aromatic; st strech; sy symmetric; ip in plane vibration; δ deformation vibration.
NMR experiments were acquired in a Bruker Avance III 400 spectrometer operating at 400.15 MHz for hydrogen, 100.61 MHz for carbon using 5mm tubes and a gas flow of 400 l/h either in a Bruker High Resolution BBO probe or TXI probe. Spectra description is presented stating the deuterated solvent used and for each signal, chemical shift value, multiplicity, integration and atom assignment. The following abbreviations were used to indicate signal multiplicity: s, singlet; d, doublet; t, triplet; q, quartet; m, multiplet.
Analytical grade solvents and commercially available reagents were used without further purification, except where noted.
3.1
Synthesis
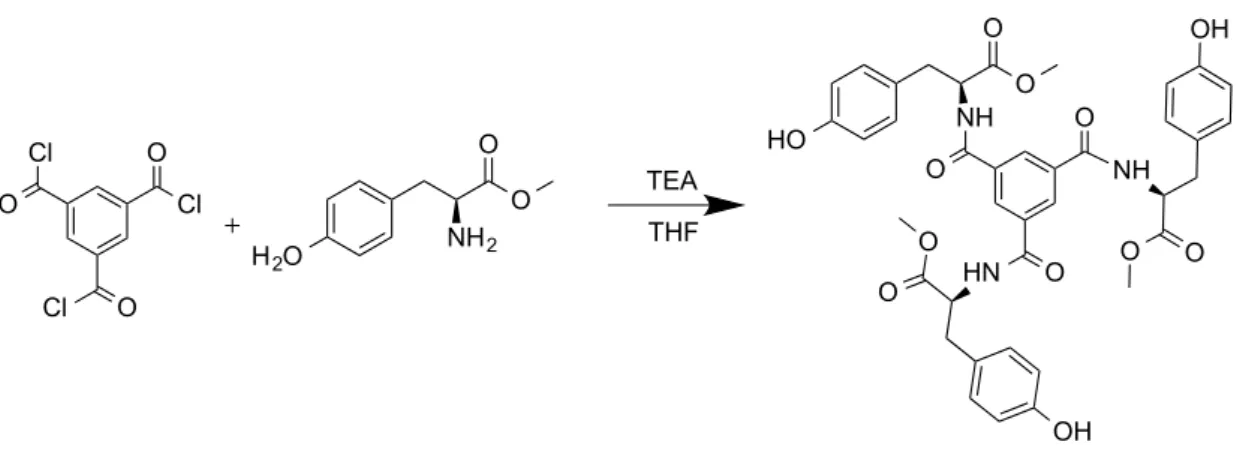
Synthesis of N1,N3,N5-tris(4-((E)-phenyldiazenyl)phenyl)benzene-1,3,5-tricarboxamide (BTA 1)
Figure 12 - Scheme of the reaction of the synthesis of BTA derivative 1
To a solution containing 4-phenylazoaniline (766.5 mg, 3.89 mmol) and distilled triethylamine (1 mL, 7.53 mmol) in THF (5 mL) was added dropwise a THF solution (10 mL) of 1,3,5-benzenetricarbonyl trichloride53 (149 ul, 0.75 mmol). The resulting mixture was stirred at room temperature for 24 h and filtered. The filtrate was concentrated in vacuum and MeOH was added to the residue. The resulting mixture was filtered under vacuum and the solid precipitate, (400 mg, 71% yield) washed with methanol until discoloration53.
Mp (ºC) >250
IR (KBr/cm-1) 1664 (m, sh, C=O st), 1654 (m, sh, C=O st), 1597 (m, sh, ar C-C st), 1534 (s, sh, N-C=O st sy), 1442 (w, sh, N=N st) 1406 (m, sh, ar C-C st), 1325, 1254 (m, sh, C-N st), 1154 (w, sh, NH δ ip ), 846, 768, 729, 686, 448.
1
H NMR (400 MHz, DMSO) δ 10.99 (s, 3H, H4), 8.83 (s, 3H, H1), 8.12 (d, J = 8.8 Hz, 6H, H7, H7’), 8.00 (d, J = 8.7 Hz, 6H, H6, H6’), 7.90 (d, J
= 7.2 Hz, 6H, H10, H10’), 7.72 – 7.45 (m, 9H, H11, H11’, H12).
13
C NMR (101 MHz, DMSO) δ 165.25 (C3), 152.56 (C9), 148.56 (C8), 142.56 (C5), 135.71
N N O Cl O Cl O Cl O N H O N H O NH N N N N H2N
TEA THF, r.t N N N N 1 1 2 233
O N H 4 4 O N H O HN N N 8 8 7 7 6 6 5 5 6' 6' 7' 7' 99
(C2), 131.64 (C1), 130.79 (C11), 129.92 (C12), 124.05 (C6, C6’), 122.86 (C10, C10’), 121.10 (C7, C7’).
Synthesis of N1,N3,N5-triphenylbenzene-1,3,5-tricarboxamide (BTA 2)
Figure 13 - Scheme of the reaction of synthesis of BTA derivative 2
To a solution containing freshly distilled aniline (110 µl 1.21 mmol) and distilled triethylamine (263 µl, 1.88 mmol) in dicloromethane (5 mL) was added dropwise a dicloromethane solution (10 mL) of 1,3,5-benzenetricarbonyl trichloride58 (74 µl, 376 umol). The resulting mixture was stirred at room temperature for 24 h and concentred in vacuum. The resulting solid was dissolved in cold THF and filtered in silica to obtain the product as a white solid (109.1 mg, 67 % yield).
Mp (ºC) >250
IR (KBr/cm-1) 3458 (br, m, ), 3292 (br, m ), 1664 (m, sh, C=O st), 1648 (s, sh, C=O st), 1602 (m, sh, ar C-C st), 1548 (m, sh, N-C=O st sy), 1520 (m, sh, ar C-C st), 1496, 1444, 1322, 1258 (m, sh, C-N st), 908, 752, 718, 688, 586, 506, 492.
1
H NMR (400 MHz, DMSO) δ 10.60 (s, 3H, H4), 8.72 (s, 3H, H1), 7.84 (d, J = 7.6 Hz, 6H, H6, H6’), 7.41 (t, J = 7.9 Hz, 6H, H7, H7’), 7.16 (t, J = 7.4 Hz, 3H, H8).
13
C NMR (101 MHz, DMSO) δ 165.02 (C3), 139.40 (C5, C5’), 135.99 (C2), 130.23 (C1), 129.21 (C6, C6’), 124.48 (C7), 120.91 (C5).
Synthesis of N1,N3,N5-tribenzylbenzene-1,3,5-tricarboxamide (BTA 3)
Figure 14 - Scheme of the reaction of synthesis of BTA derivative 3
To a solution containing benzilamine (263 µl, 2.41 mmol) and distilled triethylamine (336 µl, 2.41 mmol) in THF (5mL) was added dropwise a THF solution (10mL) of 1,3,5-benzenetricarbonyl trichloride (149 µl, 0.75 mmol). The resulting mixture was stirred at room temperature for 24 h and filtered. The filtrate was concentrated in vacuum. The solid was washed with sodium carbonate and ammonia chloride solution to obtain the desired product as a white solid (240 mg, 67 % yield).
Mp (ºC) 230-232
IR (KBr/cm-1) 3233, 3066, 2935, 1645(s, sh, C=O st), 1635 (s, sh, C=O st), 1556 (s, sh, N-C=O st sy), 1456, 1292 (s, sh, C-N st), 1080, 1027, 906, 696, 607, 486.
1
H NMR (400 MHz, DMSO) δ 9.27 (t, J = 5.7 Hz, 3H, H4), 8.51 (s, 3H, H1), 7.45 – 7.14 (m, 15H, H7, H7’, H8, H8’, H9), 4.51 (d, J = 5.8 Hz, 6H , H5).
13
C NMR (101 MHz, DMSO) δ 165.94 (C3), 139.86 (C6), 135.39 (C2), 129.22 (C1), 128.76 (C8), 127.85 (C7), 127.29 (9), 43.32 (C5).
THF, r.t TEA O Cl O Cl O Cl
H2N
O O O NH NH HN 1 1 2 233
O O O NH 9 9 8 8 7 7 6 6 7' 7' 8' 8' 5 5
NH44
Tyrosine Methyl Ester Hydrochloride
Figure 15 - Scheme of the reaction of synthesis of Tyrosine Methyl Ester Hydrochloride
Thionyl Chloride (0.8 ml, 7.34 mmol) was added dropwise to a suspension of L-Tyrosine (1.81 g, 9.99 mmol) in 25 ml of dry methanol.59 The mixture was refluxed for 18 h and concentrated in vacuum. The resulting crude product was triturated with hexane resulting in tyrosine methyl hydrochloride ester as a cream coloured solid (2.26 g, 98 % yield).
Mp (ºC) 188-190
IR (KBr/cm-1) 3384 (s, br, N-H st), 3348 (s, br, N-H st), 3012(s, sh, ar C-H st), 2904 (s, br, C-H st), 1744 (s, sh, C=O st), 1616 (m, sh, ar C-C st), 1592 (m, sh, ar C-C st), 1516 (s, sh, ar C-C st), 1450, 1434, 1396, 1348, 1276 (m, sh, C-N st), 1250 (s, sh, C-O st), 1224 (s, sh, C-O st), 1108, 1056, 990, 934, 866, 840, 734, 618, 600, 514.
1
H NMR (400 MHz, D2O) δ 7.09 (d, J = 8.0 Hz, 2H, H7, H7’),
6.83 (d, J = 8.0 Hz, 2H, H8, H8’), 4.31 (t, J = 6.3 Hz, 1H, H3), 3.77 (s, 3H, H1), 3.14 (ddd, J = 21.9, 14.6, 6.5 Hz, 2H, H5).
13
C NMR (101 MHz, D2O) δ 170.13 (C2), 155.29 (C9), 130.88
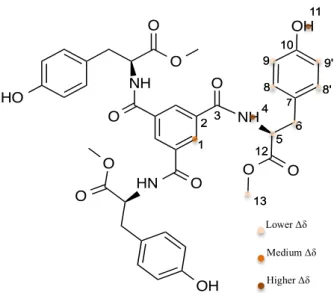
Synthesis of trimethyl 2,2',2''-((benzene-1,3,5-tricarbonyl)tris(azanediyl))(2S,2'S,2''S
)-tris(3-(4-hydroxyphenyl)propanoate) (BTA 4)
Figure 16 - Scheme of the reaction of synthesis of BTA derivative 4
To a solution containing tyrosine methyl ester hydrochloride (279.2 mg, 1.21 mmol) and distilled triethylamine (336 µl, 1.29 mmol) in THF (5mL) was added dropwise a THF solution (10mL) of 1,3,5-benzenetricarbonyl trichloride (74 µl, 376 umol). The resulting mixture was stirred at room temperature for 6 h and filtered. The reaction didn’t proceed to completion as revealed by NMR spectroscopy and the product wasn’t isolated.
Figure 17 - Scheme of the reaction of synthesis of BTA derivative 4
To a solution containing tyrosine methyl ester hydrochloride (261.9 mg, 1.13 mmol) and distilled triethylamine (308 µl, 2.21 mmol) in CH2Cl2 (5mL) was added dropwise a
CH2Cl2 solution (10mL) of 1,3,5-benzenetricarbonyl trichloride (74 µl, 376 umol). The
resulting mixture was stirred at room temperature for 18 h and filtered. The reaction didn’t proceed to completion as revealed by NMR spectroscopy and the product wasn’t isolated.
O
Cl
O Cl
O
Cl
TEA
NH2
HO
O
O
THF
O
NH
O NH
O
HN
OH
O O
OH O
O HO
O
O
Figure 18 - Scheme of the reaction of synthesis of BTA derivative 4
To a solution containing tyrosine methyl ester hydrochloride (215.4 mg, 929.8 umol) and distilled triethylamine (325 µl, 2.33 mmol) in THF (5mL) was added dropwise a THF solution (10mL) of 1,3,5-benzenetricarbonyl trichloride (74 µl, 376 umol). The resulting mixture was stirred at room temperature for 26 h and filtered. The reaction didn’t proceed to completion as revealed by NMR spectroscopy and the product wasn’t isolated.
Figure 19 - Scheme of the reaction of synthesis of BTA derivative 4
To a solution containing tyrosine methyl ester hydrochloride (285.0 mg, 1.23 mmol) and distilled triethylamine (336 µl, 2.41 mmol) in THF (5mL) was added dropwise a THF solution (10mL) of 1,3,5-benzenetricarbonyl trichloride (74 µl, 376 umol). The resulting mixture was stirred at room temperature for 24 h and filtered. The reaction didn’t proceed to completion as revealed by NMR spectroscopy and the product wasn’t isolated.
O Cl O Cl O Cl TEA NH2 HO O O THF O NH O NH O HN OH O O OH O O HO O O HCl O Cl O Cl Cl TEA NH2
H2O
Figure 20 - Scheme of the reaction of synthesis of BTA derivative 4
Tyrosine methyl ester hydrochloride (302.4, 1.55 mmol) was taken in ethyl acetate and washed with 1 mM HCl solution and a sodium bicarbonate saturated solution. The organic phase was dried with anhydrous magnesium sulphate and evaporated.
The resulting solid was dissolved in THF (5 ml), added distilled triethylamine (336 µl, 2.41 mmol) and stirred.
A THF solution (10 mL) of 1,3,5-benzenetricarbonyl trichloride (74 µl, 376 umol) was then added dropwise60. The resulting mixture was stirred at room temperature for 24 h and filtered. The reaction didn’t proceed to completion as revealed by NMR spectroscopy and the product wasn’t isolated.
Figure 21 - Scheme of the reaction of synthesis of BTA derivative 4
Tyrosine methyl ester hydrochloride (300.0 mg, 1.29 mmol) was taken in ethyl acetate and washed with 1 mM HCl solution and a sodium bicarbonate saturated solution. The organic phase was dried with anhydrous magnesium sulphate and evaporated.
The resulting solid was dissolved in THF (5 ml), added distilled triethylamine (336 µl, 2.41 mmol) and stirred.
O Cl O Cl O Cl TEA NH2
H2O
A THF solution (10 mL) of 1,3,5-benzenetricarbonyl trichloride (74 µl, 376 umol) was then added dropwise60. The resulting mixture was stirred at room temperature for 24 h and filtered. The obtained solid was taken in ethyl acetate and washed with 1 mM HCl solution and a sodium bicarbonate saturated solution. The organic phase was dried with anhydrous magnesium sulphate and evaporated resulting in a yellow coloured solid (108 mg, 39% yield).
Mp (ºC) 120-130
IR (KBr/cm-1) 3366 (s, br, O-H st) 2956 (w, sh, C-H st), 1736 (m, sh, ester C=O st), 1652 (m, sh, amide C=O st), 1516 (m, sh, N-C=O st sy), 1438 (w, sh, ar C-C st), 1354, 1226 (s, sh, C-N st), 1108, 830.
1
H NMR (400 MHz, DMSO) δ 9.22 (s, 3H, H11), 9.12 (d,
J = 7.5 Hz, 3H, H4), 8.39 (s, 3H, H1), 7.08 (d, J = 8.2 Hz, 6H, H9 H9’), 6.67 (d, J = 8.2 Hz, 6H, H8 H8’), 4.60 (dd,
J = 14.6, 7.7 Hz, 3H, H5), 3.64 (s, 9H, H13), 3.03 (t, J = 7.0 Hz, 6H, H6).
13
C NMR (101 MHz, DMSO) δ 172.61 (C12), 166.10 (C3), 156.41 (C10), 134.69 (C2), 130.43 (C8), 129.78 (C1), 128.02 (C7), 115.58 (C9), 55.40 (C5), 52.40 (C13), 35.98 (C6).
Triyptophan Methyl Ester Hydrochloride
Figure 22 - Scheme of the reaction of synthesis of Tryptophan Methyl Ester Hydrochloride
Thionyl Chloride (0.6 ml, 8.22 mmol) was added dropwise to a suspension of L-Tryptophan (1.50 g, 7.34 mmol) in 25 ml of dry methanol.59 The mixture was refluxed for 18 h and concentrated in vacuum. The obtained white solid was recrystallized at 0 ºC with
1 1 2 233
O
NH44
methanol/diethyl ether to obtain the tryptophan methyl ester hydrochloride as a cream coloured solid (1.40 g, 75 % yield).
Mp (ºC) 220-224
IR (KBr/cm-1) 3424 (m, br, N-H st), 3294(s, br, N-H st), 3268 (s, br, N-H st), 3002 (s, br, ar C-H st), 2954(s, br, C-H st), 2022 (CO2), 1750 (s, sh, C=O st), 1620 (w, sh, ar C-C st), 1580(s, sh,
ar C-C st), 1504(s, sh, ar C-C st), 1438, 1352, 1286, 1230 (s, sh, C-N st), 1212 (s, sh, C-N st), 1110, 732.
1
H NMR (400 MHz, D2O) δ 7.53 (d, J = 7.9 Hz, 1H, H10), 7.47
(d, J = 8.2 Hz, 1H, H13), 7.26 – 7.17 (m, 2H, H7, H11), 7.13 (t,
J = 7.5 Hz, 1H, H12), 4.37 (t, J = 6.2 Hz, 1H, H3), 3.73 (s, 3H, H1), 3.46 – 3.31 (m, 2H, H5).
13
C NMR (101 MHz, D2O) δ 170.49 (C2), 136.36 (C9), 126.48
(C14), 125.45 (C7), 122.31 (C11),119.67 (C12), 118.12 (C13), 112.14 ( C10), 106.09 (C6), 53.65 (C1), 53.41 C3), 25.73 (C5).
Synthesis of trimethyl 2,2',2''-((benzene-1,3,5-tricarbonyl)tris(azanediyl))(2S,2'S,2''S
)-tris(3-(1H-indol-3-yl)propanoate) (BTA 5)
Figure 23 - Scheme of the reaction of synthesis of BTA derivative 5
Tryptophan methyl ester hydrochloride (400.0 mg 1.57 mmol) was taken in ethyl acetate and washed with 1 mM HCl solution and a sodium bicarbonate saturated solution. The organic phase was dried with anhydrous magnesium sulphate and evaporated.
The resulting solid was then taken in THF (5 ml) and added distilled triethylamine (336 µl, 2.41 mmol) and stirred.
Then a THF solution (10 mL) of 1,3,5-benzenetricarbonyl trichloride (74 µl, 376 umol) was added dropwise. The resulting mixture was stirred at room temperature for 24 h filtered and washed with cold THF. BTA 5 was obtained as a yellow coloured solid (219 mg, 72 % yield).
Mp (ºC) 120-135
IR (KBr/cm-1) 3408 (s, br, ), 3058(w, sh, ar C-H st), 2954 (w, sh, C-H st), 1736 (m, sh, ester C=O st), 1656 (m, sh, amide C=O st), 1528 (s sh, N-C=O st sy), 1438, 1342, 1220 (s, sh, C-N st), 1102, 742.
1
H NMR (400 MHz, DMSO) δ 10.84 (s, 3H, H14), 9.17 (d,
J = 7.4 Hz, 3H, H4), 8.46 (s, 3H, H1), 7.57 (d, J = 7.8 Hz, 3H, H12), 7.33 (d, J = 8.0 Hz, 3H, H9), 7.20 (s, 3H, H15), 7.07 (t, J = 7.5 Hz, 3H, H11), 6.99 (t, J = 7.4 Hz, 3H, H10), 4.81 – 4.59 (m, 3H, H5), 3.64 (s, 9H, H17), 3.31 – 3.21 (m, 6H, H6).
13
3.2
Self-assembly studies
NMR Spectroscopy
NMR experiments were acquired in a Bruker Avance III 400 spectrometer equipped
with a temperature control unit and a pulsed field gradient unit capable of producing
magnetic pulsed field gradients in the z-direction of 56.0 G/cm, operating at 400.15 MHz for
hydrogen, 100.61 MHz for carbon using 5mm tubes and a gas flow of 400 l/h either in a
Bruker High Resolution BBO probe or TXI probe.
DOSY experiments were acquired using the Oneshot61 sequence or Bruker pulse sequence (ledbpgp2) with a LED (longitudinal eddy delay) using bipolar gradient pulses for diffusion. Each experiment consisted in acquiring 32 spectra of 64k data points. The pulse gradients (g) were incremented from 5 to 95 % of the maximum gradient strength in a linear
ramp.
Concentration dependent spectra were obtained by acquiring 1H-NMR spectra of the compounds at different concentrations, samples were prepared by diluting a concentrated solution of each compound in DMSO-d6 or a mixture of THF:THF-d8 (9:1) inside the NMR tubes.
The water titration experiment of BTA 1 was done by acquiring 1H-NMR spectra at each step of addition of D2O from 0% to 18% of added water.
Concentration dependent spectra with an added percentage of water were made by acquiring 1H-NMR spectra of solutions of the studied compound at different concentrations prepared by de dilution of a concentrated solution of the compound with an organic solvent-water mixture inside the NMR tubes.
Variable Temperature NMR experiments were obtained by varying the temperature of
the samples used in the concentration dependent chemical shift measurement inside the NMR
spectrometer.
2D COSY, HSQC, NOESY Spectra were acquired by using Bruker standard pulse
programs.
1D 1 H,13
C and 2D COSY, HSQC, NOESY Spectra were processed using Bruker
Topspin 3.5 software and MestreLab Metrenova 6.0.2. DOSY spectra were processed using
3.3
Preliminary interaction studies
1
H-NMR and Oneshot DOSY61 were employed in order to probe for interaction between glucose and ammonium chloride with BTA 5.
Chemical shifts were measured in 1H-NMR experiments by titrating a DMSO-d6
solution of compound 5 in a NMR tube with the guest compound. Titration was made by adding 40 ul of guest compound in 10 ul steps. Each experiment started by acquiring a 1 H-NMR spectrum of 5 without any guest added.
4.
Results and discussion
4.1
Synthesis
In order to understand how the structural variations in 1,3,5 – BTA compounds would influence their assembly process, several BTA derivatives were synthetized according to figure 24 and Table 1. C3-symmetric BTA derivatives were obtained in moderate to good
yields from the reaction of 1,3,5-BTC chloride with aromatic amines in the presence of a base, triethylamine, to deprotonate the aromatic amines increasing its nucleophilicity. The stoichiometry of the reaction for the synthesis of compound 1-5 involves the addition of three molecules into one. Because of that it was necessary to use a small excess of the substituent in order to obtain the fully substituted core with three molecules.
Figure 24 - General scheme for the synthesis of BTA 1-5.
Table 1 – Results of the synthesis of BTA 1-5 O Cl O Cl O Cl O NHR O RHN O NHR NHR NEt3 N N H N O OMe HO O OMe
BTA 1
BTA 2
BTA 3
BTA 4
BTA 5 R=
H2N
NH2 HO
O
OMe H2N
NH2 O
OMe HN
Core Substituent Solvent Conditions Yield (%)
THF r.t.24 h 71
CH
2Cl2
r.t.18h 67
THF r.t.18 h 67
THF Reflux, 24 h 39
THF Reflux, 20 h 72
O Cl O Cl O Cl N N H2N 1
To evaluate the influence of the aromatic rings and molecular size in the aggregation process aniline and benzylamine derivatives were obtained (BTA 2 and 3, respectively). These compounds would also allow to check how the structure rigidity would influence the assembly.
BTA derivatives are known to be only soluble in organic solvents such as THF, DMSO or DMF. In order to improve solubility in water and also biocompatibility, substitution with amino acids was a pursued, in the reaction of BTC with aromatic amino acids - tyrosine for BTA 4 and tryptophan for BTA 5. With these two latter compounds it was possible to add more unsaturated bonds to the final structure thus increasing its ability to establish π-π interactions.
The amino acids addition to 1,3,5-BTC chloride was preceded by the introduction of a protecting group. The carboxamide formation requires the use of a base, however for tyrosine and tryptophan the presence of the carboxylic acid moiety, a group with a lower pKa than the amine would not allow a clean reaction. The esterification of the amino acids using methanol and thionyl chloride was the selected protecting strategy. The methyl group wouldn´t bring much bulk to the final molecule, a factor that could affect the assembly capabilities because of steric hindrance. Deprotection was a possibility that was desired to keep, hydrolysis of the methyl ester would yield the BTA derivatives with the carboxylic acid group. While harder to deprotect then a silane ester or a tert-butyl group, requiring a concentrated strong base, the methyl ester was the compromise between steric bulk, and ease to protect/deprotect the carboxylic acid while doing its function in the reaction for the preparation of BTA 4 and 5.
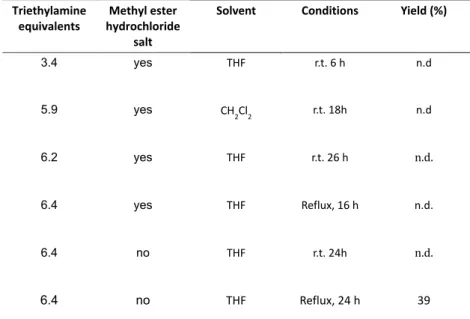
BTA 1, 2, 3 and 5 were obtained in good yield, for the synthesis of 4 it was necessary to optimize the reaction.
The phenol group in the tyrosine side-chain might affect the completion of the reaction in the desire path because its pKa is similar with the amine, 10 for the phenol and 9 for the amine, it is a potential reaction centre in the action of the triethylamine and result in several addition products in benzene tricarbonyl trichloride in several side-reactions, lowering the yield of the reaction on the BTC core.
In the synthesis of 4 it was also needed to deprotonate the hydrochloride salt in the tyrosine methyl ester, which was formed during the esterification reaction.
and saturated sodium bicarbonate solution and then to react the resulting product with the free amine with benzene-1,3,5-tricarbonyl trichloride. It was necessary to heat the reaction mixture to reflux in order to drive the reaction to completion, which can be justified because of the steric bulk of the tyrosine methyl ester.
After the optimization of the reaction conditions the same methodology was employed in the synthesis of 5.
The measured melting points for 4 and 5 have a large temperature interval and might suggest several changes in possible conformations.
Regarding the analysis of the NMR spectra there were some similarities between the synthetized BTA that could be used to simplify the characterization procedure and ensure that the desired product was formed.
The molecular symmetry of compounds, C3 point symmetry group, made the analysis
of the 1H-NMR easy to check if the desired product was obtained. The pattern of the chemical shifts for the amide and the aromatic core could be used as a probe the degree of substitution. Only complete substitution of the core leads to a C3-symmetric molecule, where
the magnetic and chemical equivalence of the protons give rise to single proton signals for each. On the COSY spectra it was possible to observe for BTA 3-5 the coupling of the amide proton with the vicinal proton, the COSY correlation is depicted in Figure 25.
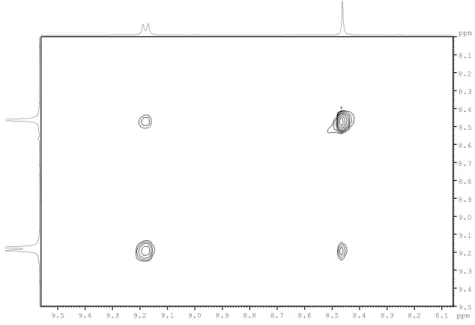
That information combined with the integration in the 1H-NMR spectra and the change in the multiplicity, shape and chemical shift compared to the more easily exchangeable amine signal on the free substituent is a proof that de amide was formed. The formation of the amide bond could be later confirmed by the multiple bond correlation in the HMBC spectra as depicted in Figure 26 where is shown the amide correlation with carbonyl on the BTC core. Spatial correlation in the NOESY spectra between the BTC core proton and the amide proton was also observed and it is shown in Figure 27.
For BTA 1 and 2 all of those analyses were applicable, except the COSY correlation since in those compounds the amide doesn´t have a vicinal proton.
Figure 26 – Correlation of the amide and BTC core with the amide carbonyl in the HMBC spectrum of BTC 5 in DMSO-d6
Table 2 – Overview of the condition for the synthesis of BTA 4
!
Triethylamine, equivalents,
Methyl,ester, hydrochloride,
salt,
Solvent Conditions Yield&(%)
3.4 yes THF r.t.!6!h n.d
5.9 yes CH
2Cl2 r.t.!
18h n.d
6.2 yes THF r.t.$26!h n.d.
6.4 yes THF Reflux,(16!h n.d.
6.4 no THF! r.t.$24h! n.d.!
4.2
Self-assembly studies
Dimerization is the simplest case of assembly where the process is governed by a global equilibrium constant, that can have one, two or several different chemical equilibrium steps governed by different equilibrium constants.
Equation 1 - Equilibrium constant in a dimerization process
Equation 2 - Equilibrium constant in several aggregation steps
From the reported models in literature the most employed for the description of a growing molecular stack to form a supramolecular gel or fibres are the Equal K (EK) model or the Attenuated K (AK) model. The first model works for the case in which each equilibrium step is equal, meaning there is only one K governing each monomer addition to the growing stack, for that reason it is also called isodesmic mechanism. In that case there is a wide range of aggregate sizes in solution.
In the case of a higher aggregate after the dimerization process, each following K is different than the latter, being smaller at each addition because each following monomer addition to the stack will have a lower probability. From the data handling point of view it would be very difficult to employ this methodology to experimental data.
a number of different size aggregates that would be less disperse regarding size comparing to the EK model.
Figure 28 - Comparison of dispersion of aggregates size in a cooperative and isodesmic mechanism
There are two different cases in an aggregation study by a spectrometric technique, if the process happens in a timescale that is observable by the technique one can observe at least two different states in solution like monomer, dimer or higher aggregate or aggregates if existent. The other option, which is fairly reported in literature66,67 and is the case of the present work, one can observe a property that is an average of every state of the studied compound in solution, which changes with the concentration of the species. As for the spectrometric technique employed it can be NMR67,68 or UV/Vis absorption.69,70
Regarding NMR spectroscopy, a measurable propriety that correlates with molecular size can be a diffusion coefficient, as a larger aggregate moves slower in solution, relaxation (T1 or T2) or a chemical shift, since the chemical environment is changed by the aggregation process that results in changes in relaxation times and in the shielding of the observed nucleus. The chemical shift deviation was one of the chosen techniques to study the assembly process of the BTA derivatives. The first approach however was starting from macroscopic information by optical microscopy of BTA 1 before moving to NMR the results are presented below. BTA 1 solutions at different THF-H2O ratio were observed under the optical
microscope the results are shown below (Figure 29).
Figure 29 - Comparison of BTA 1 spherical aggregates obtained in THF-H2O a) 60:40 b) 80:20 c) 100:0
The size of the aggregates decreases at higher THF-H2O ratios and when there is only
the trace water on THF (Figure 29c) the aggregates have a very small size. It is clear that water is needed for the aggregation process.
To fully understand the aggregation process, a more suitable technique that provides information at the molecular level is needed.
So using NMR to check for a critical aggregation concentration a dilution experiment was carried out in THF. The stacked spectra are presented in Figure 30.
Figure 30 – Stacked spectra of dilution experiment of BTA 1 in THF
Note: For the sake of clarity H7’, H6’, H10’ and H11’ labels were omitted
At the working concentration range, from 10.16 mM to 2.90 mM, working in a non-deuterated solvent and without a internal chemical shift reference it wasn’t possible to observe a trend in chemical shift difference by referring the shifts to the 1.78 ppm signal of THF and in the dilution experiment. The observation of the formation of other species in solution by aggregation and a critical concentration point in aggregation was also not possible with these experiments.
Since it was known from literature that water was necessary in the solvent used in order have the formation of the supramolecular assembly. To gain further insight in the effect of water in the assembly process a water titration experiment was done. The stacked spectra are presented in Figure 31.
10.16 mM 5.81 mM 5.08 mM 4.52 mM 4.07 mM 3.70 mM 3.39 mM
6.78 mM
8.13 mM 2.90 mM
3.13 mM
Figure 31 - Zoom in the aromatic region of BTA 1 in the water titration experiment in THF-d8:THF (1:9)
Note: For the sake of clarity H7’, H6’, H10’ and H11’ labels were omitted
From the spectra, a shift of the amide group, H6; H6’ doublets and H11; H11’ and H12 multiplet to lower field is observable with the increase in the percentage of water in THF while the BTC core protons, the H7; H7’ doublet shift to higher field as shown in Figure 32.
Figure 32 – Overview of the signals shift in BTA 1 1H-NMR water titration experiment
These signals show a larger variation in chemical shift upon the increase in concentration, this can be interpreted as being an indication of their higher involvement in the assembly process. In the Langmuir article53 it is discussed that the BTA 1 hollow spheres are THF rich based on a solvatochromism experiment with fluorescein so the compound could be
N N
1 1 2 233
O N H 4 4 O N H O HN N N 8 8 7 7 6 6 5 5 6' 6' 7' 7' 9 9 10' 10' 11' 11' 12 12 11 11 10 10 N N
Lower field shift
Higher field shift
2.0 % added water 3.8 % added water 5.7 % added water 7.4 % added water 9.1 % added water 10.7 % added water 12.3 % added water 13.8 % added water 15.3 % added water
Amide NH BTC Core
adopting a supramolecular spherical arrangement in order to show less surface to the water in solution changing the chemical environment and shielding of some of the signals.
Since water is also needed for the assembly it is not unexpected to find that it interferes with the measured chemical shifts. The amide for its H-bonding capabilities would be fairly expected to change, but it could be also a consequence of proton exchange with water that results in that shift. In sum, the aromatic protons are being affected by the addition of water, getting more shielded has the structure could be packing more tightly in order to avoid contact with water.
For the concentration dependent 1H-NMR experiments some changes were made in the methodology. At the ratios of water:organic solvents described in literature for macroscopic observation of BTA 1 the compound aggregates resulting in a heterogeneous phase that caused broadening in the NMR spectra. At this point it was clear that the trace water in the organic solvents was enough to observe the aggregation process. BTA 1 was reported to form hollow spheres in THF, a 3D complex structure. The study of the variation in the chemical shifts was then pursued in DMSO, a solvent in which the compound displays stacking into fibres.
Table 3 - 1H-NMR concentration dependent Δδ of BTA 1
C (mM) N-H BTC Core H7, H7' H6, H6' H10,H10'
12.37 0.000 0.000 0.000 0.000 0.000
10.39 -0.012 0.006 0.004 0.001 0.001
7.92 0.009 0.008 0.007 0.000 0.001
6.19 0.016 0.004 0.005 0.000 0.001
3.96 0.020 0.009 0.008 0.000 0.001
1.98 0.042 0.008 0.010 -0.001 0.002
0.74 0.068 0.011 0.014 -0.051 -0.047
Figure 33 - Plot of Δδ against concentration of BTA 1
With the change in concentration some of the signals as presented in Figure 33 show a trend with the change in concentration. The amide proton being the one that has the greatest shift having the same trend as the BTC core proton and H7, H7’ also shown in Figure 35.
NN
1 1 2 233
O N H 4 4 O N H O HN N N 8 8 7 7 6 6 5 5 6' 6' 7' 7' 9 9 10' 10' 11' 11' 12 12 11 11 10 10 N N -0.020 -0.010 0.000 0.010 0.020 0.030 0.040 0.050 0.060 0.070 0.080
0 2 4 6 8 10 12
Δδ (ppm)
C (mM)
chemical shift is sensible by being more involved in the stacking process and since BTA 1 has a helical conformation the torsion involved in the chemical bonds some interactions could be more difficult to observe like in H10-H12 where the values of the measured concentration dependent chemical shifts are scattered. The packing of these helical monomers into the supramolecular fibre assembly could also influence the chemical environment and since different groups are involved in different kind of interactions like the amide NH in H-bonding with the carbonyl of an adjacent molecule or the aromatic groups π-π stacking depending on the torsion of the chemical bonds the anisotropy of effects based on the chemical centres can be justified.
A zoom in the aromatic region of the BTA 1 concentration dependent 1H-NMR spectra is shown in Figure 34.
Figure 34 – Aromatic region of 1H-NMR concentration dependent spectra of compound 1 in DMSO-d6 12.37 mM
10.39 mM 7.92 mM 0.74 mM
1.98 mM
3.96 mM
6.19 mM
Amide NH BTC Core H7, H7’
H10, H10’ H6, H6’
H11, H11’,
Figure 35 – Overview of the Δδ in the BTA 1 concentration dependent 1H-NMR experiments
From this data it is possible then to find out of the chemical shift value of the monomer and one of the aggregate and also the equilibrium constant or constants of the process.
The mathematical basis for that is well known from literature71 and it is done by fitting the chemical shift data using an appropriate software to the following equations.
Equation 3
Equation 4
Equation 3 and Equation 4 are suitable for the fitting in the isodesmic case in order to obtain the equilibrium constant of the process. Equation 3 is suited for the dimerization process and Equation 4 for the larger stacking. It has to be noted for the same system both equation would give the same fitting quality despite the process since they are very similar simply the equilibrium constant calculated by Equation 3 would be the double of Equation 4. Because of that for the discrimination of a dimerization from a bigger stacking other strategies should be taken into account.
δobs=δm+(δag−δm)(1+(1− 8KCt+1
4KCt )
δobs=δm+(δag−δm)(1+(1− 4KCt+1
2KCt )
N N
1 1 2 233
O N H 4 4 O N H O HN N N 8 8 7 7 6 6 5 5 6' 6' 7' 7' 9 9 10' 10' 11' 11' 12 12 11 11 10 10 N N
Lower Δδ
Medium
Δδ
It was noted that those equations had a great dependence on the experimental data errors so in order to have more statistical relevant data the measurements were made in triplicate for each concentration range.
The chemical shift data was fitted to Equation 4, using Origin software by OriginLab and the results for two of the experiment arrays are presented below in Table 4.
Table 4 - Results of the isodesmic model fit for BTA 2 and 3
BTA 2 BTA 3
K (mM) Standard error K (mM) Standard error
0.046 0.027 0.019 0.010
0.046 0.010 0.017 0.013
Only the BTA 2 and BTA 3 could be fitted. In Figure 36 is shown one of the BTA 2 fittings for the signals of the amide NH, the BTC core and H6, H6’.
Figure 36 - Origin fits to eq. 4 for BTA 2 a) amide proton, b) BTC core proton and c) H6, H6’
From the fitting results to the isodesmic model several aspects should be taken in account, only the nuclei that displayed a trend with the change in concentration could be fitted. It has to be noted that the BTA 4 and 5, bigger compounds with more unsaturated bonds showed that linear behaviour in every proton, shown in Figure 37 and Figure 39 for BTA 4 and 5 respectively. The fitting however showed a large standard error what indicates that the model is not correct to describe the assembly of those molecules, the same fitting issues happen with BTA 1 for the amide, BTC core and H7; H7’. So with this approach, only the BTA 2 and BTA 3 could be fitted according to the isodesmic model, in spite of that with the added structural mobility introduced in in BTA 3 because of the CH2 bonded to the amide
only the amide proton and the BTC core could be used for the fit. The equilibrium constant determined from the fitting for BTA 3 is half of the one determined for BTA 2, so there is less molecules in the aggregate compared to the free monomer in BTA 3 as opposed to BTA 2, that correlates with the fact that the structural flexibility given by the rotation of the single
NH-CH2 bond can increase the difficulty for the molecules of BTA 3 to stack as opposed to
the more rigid and planar system in BTA 2.
It is not unexpected that the isodesmic model could only be used to describe BTA 2 and 3 since it is reported in literature has an assembly theory to model the growth of 1D stacks by planar molecules.72 However, the model fails to predict the process in bigger helical systems such as BTA 173 and in more complex systems like BTA 4 and 5 with more functional groups and more conformational freedom.
Figure 37 - Plot of Δδ against concentration of BTA 4
Figure 38 - Overview of the Δδ in the BTA 4 concentration dependent 1H-NMR experiments 0.000 0.001 0.002 0.003 0.004 0.005 0.006 0.007 0.008 0.009 0.010
0 1 2 3 4 5 6 7 8
Δδ (ppm)
C (mM)
PhOH Amide NH BTC Core H9, H9'
H8, H8' H5 H13 H6
1 1 2 2 33
O
NH44
O NH O HN 12 12 5 5 6 6 7 7 8 8 9 9 10 10 OH 11 11 9' 9' 8' 8' O O 13 13 OH O O HO O O
Lower Δδ
Medium Δδ
Figure 39 - Plot of Δδ against concentration of BTA 5
Figure 40 - Overview of the Δδ in the BTA 5 concentration dependent 1H-NMR experiments
In order to relate molecular geometry to the observed chemical shift variation BTA 1 -5 geometries were minimized using the Hartree-Fock level of theory and a minimal basis set, STO-3G, in Gaussian 0974. The HF/STO-3G optimized structures are shown below in Figure 41. -0.002 0.000 0.002 0.004 0.006 0.008 0.010 0.012 0.014 0.016 0.018
0.00 2.00 4.00 6.00 8.00 10.00 12.00 14.00 16.00 18.00
Δδ (ppm)
C (mM)
Indol NH Amide NH BTC Core
H12 H9 H15
H11 H10 H5
H17 NH H N O O 2 2 1 1 3 3 O O O NH NH O O 16 16 N H 4 4 5 5 7 7 NH 14 14 13 13 12 12 11 11 10 10 9 9 8 8 O O 15 15 17 17
Higher Δδ
Medium Δδ