A MULTI-CRITERIA DECISION MODEL FOR SELECTING PROJECT PORTFOLIO WITH CONSIDERATION BEING GIVEN TO A NEW CONCEPT FOR SYNERGIES
Adiel Teixeira de Almeida
*and Marina D.O. Duarte
Received December 30, 2008 / Accepted February 15, 2011
ABSTRACT.Project Portfolio Selection (PPS) is a kind of problem found in a variety of practical situati-ons, such as research and development planning. Several different approaches have been proposed to deal with Project Portfolio Selection (PPS). However, the consideration on benefits synergies between projects is little addressed in the literature. The main focus of this paper is on synergy between projects, which is related to the interactions between the benefits of the projects. In this paper, a method has been developed to meet some of the major limitations of existing models: the inadequacy of the treatment of multiple criteria and inter-relationships between projects and the absence of the recognition and incorporation of managers’ experience and knowledge, concerning to synergy between projects. The decision model is formulated as a non-linear 0-1 optimization problem, which considers the evaluations of projects and the benefit synergies of theses projects.
Keywords: multi-criteria decision aid, Project Portfolio Selection, synergy of projects.
1 INTRODUCTION
Applications of Project Portfolio Selection (PPS) have been published in several areas, particu-larly for Research and Development (Coffin & Taylor III, 1996; Coldricket al., 2005; Wang & Hwang, 2005; Carlssonet al., 2006), pharmaceuticals (Prabhu, 1999), financial analysis (Fer-reiraet al., 2009) and Information Systems (Lee & Kim, 2001; Klapka & Pi ˜nos, 2002). Despite the large range of papers, only a few of them really address the issue of synergies (Golabiet al., 1981; Hallet al., 1992; Santhanam & Kyparisis, 1995; Chien, 2002).
In general, many methods can be applied to solve the PPS problem, including Economic Analy-sis, Decision Theory, Optimization and Multi-criteria methodologies. Despite the wide appli-cability of optimization methods, there is a tendency to apply selection structures to the PPS (see,e.g., Archer & Ghasemzadeh, 1999). This approach can make use of the best characte-ristics of a combination of existing methods and consists of a way to consider the structure of
*Corresponding author
preferences and experience of the decision makers. Multicriteria methods may also be integra-ted within PPS, incorporation the analysis of several different objectives. Multicriteria decision models are applied in many different problems and areas, such as: civil construction engine-ering, (Szajuboket al., 2006), suppliers selection (Alencar & Almeida, 2008; Alencar & Al-meida, 2010), water management (Morais et al., 2010), energy planning (Albuquerque et al., 2009), management in oil companies (Meirelles & Gomes, 2009), and evaluation of rental values (Rangel & Gomes, 2007).
With regard to the synergies issue, the main focus of this work, there are several ways of defining it. Although the knapsack approach is seen as a way itself of dealing with synergy, there are other definitions related to the interaction between the projects in the value function, rather than in the constraint. In this case, the synergy is related to the benefits of these projects interactions, although in some cases this is implemented in the constraints, as a modelling procedure.
A small set of papers dealing with this kind of view is below. In this paper a different way of dealing with synergy is proposed based on experiences achieved in the context of R&D (Research and Development) portfolio for power electricity companies.
In the context of synergy, Golabiet al.(1981) express a concern about the existence of this type of project interrelationship, although it is considered only after the application of the selection method, during meetings of the selection committee. Hallet al.(1992) incorporate this concept into a linear programming model by means of constraints that meet the requirements for diversity needed for the R&D portfolio of the National Cancer Institute, in the United States. This can be as an indirect procedure to deal with a multi-objective process; that is, including some objective issues within the constraints.
Another way to consider synergies was used by Santhanam & Kyparisis (1995). They develo-ped a nonlinear 0-1 goal programming model for Information Systems (IS) project selection that assumes the existence of interdependencies among some projects. The benefit-related objective accounts for interdependencies among different projects by considering synergistic benefits de-rived from implementing related projects. These interdependencies are also considered in the cost-related objective and in the constraint on resources, through the assumption that costs and resources can be shared among one or more projects. The model considers that such syner-gistic effects occur among three, at most, related projects. These synergies are represented by additional benefits derived from implementing two or three projects together.
attributes by considering the different types of interrelations between them that can be indepen-dent, interrelated or synergistic.
This paper sets out to address the synergies considered in the PPS as added benefits due to the joint presence of projects in the portfolio. An alternative approach for measuring such benefits is proposed. In addition, a multi-criteria methodology will be used to compile the objective function of the developed optimization model, which allows the decision maker’s preferences to be incorporated.
The rest of the paper is organized as follows. In Section 2, the PPS problem is defined and the synergy aspect is explained. In Section 3, the nonlinear 0-1 optimization model is presented. In Section 4, an application is developed. Finally, Section 5 sets out the main conclusions of this paper.
2 DEFINITION OF THE PROBLEM
The selection of the project portfolio to be undertaken has a high impact on organizations, espe-cially in strategic terms, as a consistent decision has the power to drive the strategy and generate competitive advantages for the organization. Overall, the selection of the appropriate portfolio must meet the goals in a desirable way without violating the possible constraints.
In this context, some difficulties are observed: usually multiple goals must be considered; it may be necessary to measure strategic benefits; the projects may consider uncertain aspects (the deadline for completion, for example); and the number of feasible portfolios is often high. Moreover, the identification and measurement of synergy contributions to the portfolio deserve great attention, due to the holistic nature of the synergies.
A project portfolio is a set of projects considered for implementation by a particular organiza-tion. Thus, project portfolio selection is a regular activity that involves selecting a portfolio, from available project proposals and projects in progress, which achieves organizational goals without exceeding the available resources or violating other constraints (Archer & Ghasemza-deh, 1999). Belton & Stewart (2002) consider portfolio selection a problematic (i.e. a category of problems) to which the methods of MCDA can be applied. They argue that the portfolio pro-blematic consists of choosing a sub-set of alternatives from a wide range of possibilities, taking into consideration not only the characteristics of the alternatives individually, but also the way they interact and their positive and negative synergies.
Due to the large range of studies in the literature, it is necessary to distinguish project selection from project portfolio selection. Project selection aims at selecting a sub-set of the set of pro-ject proposals available, by considering the characteristics of individual propro-jects and possibly the constraints imposed. Moreover, PPS aims to compile a portfolio, which means that it is inten-ded for choosing a sub-set of projects, taking into account the limitations and characteristics of individual projects as well as the synergy relationships between them.
3 THE MODEL
The model proposed employs the Combinatorial Optimization approach to the PPS problem, where the objective function is an additive aggregation function. Additive models is quite com-mon as an aggregation procedure in multicriteria modeling (Almeida, 2011; Campos & Almeida, 2006; Alencar & Almeida, 2008). As it is a 0-1 model, the problem can be considered a knapsack problem, which is a well-known combinatorial optimization problem (Han & Kim, 2002).
The goal to be maximized includes two aspects: (1) scores, assigned by the decision-maker to projects, obtained through an additive value function, and (2) an indicator of the value of synergy between projects. The synergy consists of the main focus of this paper. It is evaluated by means of the decision maker’s judgement on the relative gain proportionate to a project due to its presence jointly with another project in the portfolio.
3.1 Project Evaluation
Consider m projects proposed for implementation in a given period, the evaluation of which is performed onn criteria. Let X be the set of considered projects, such that X = {X1,X2, . . . ,
Xm}. It is assumed that projects are indivisible. Therefore, fractions or possible versions of the
same proposal are introduced in the model as separate projects. Each project presents an array of scores(zi), which describes its performance in relation to the criteria.
zi =zi1,zi2, . . . ,zi n, for I =1, . . . ,m (1)
The set of available projects can be represented by the score matrixZ, the rows of which are the score arrays of each project.
Z =
z11 z12 . . . z1n z21 z22 . . . z2n
..
. ... . . . ... zm1 zm2 . . . zmn
(2)
scaling constants may be obtained through the elicitation process, using the trade-off concept to build a system of multi-attribute values from the single attribute scores (Keeney & Raiffa, 1976; Almeida, 2005; Almeida, 2011).
Given these considerations, the scaling constants array is represented byw:
w=w1, w2, . . . , wn, where
n
X
j=1
wj =1 (3)
For each project Xi the value of its overall evaluation in terms of all then criteria is expressed by equation 4.
ν(Xi)= n
X
j=1
wjzi j (4)
So,νi =
ν(X1), ν(X2), . . . , ν(Xm)
T
is the overall evaluation array of the projects considered.
3.2 Synergy Evaluation
Denote the set of all possible portfolios by P. A project portfolio is a sub-set of all available projects. Thus, Pis the power set of X, so the number of elements of Pis given by|P| =2m. A portfolio can be represented as a binary vectorpr:
pr =
x1, . . . ,xm
wherexi =
(
1 if projectXi is contained in the portfolio
0 otherwise (5)
for r =1, . . . ,2m.
To establish a measure of the synergy provided by the projects to the portfolio it is necessary that the decision maker determines the individual contribution added to each project by the joint presence with other projects in the portfolio. We define the elements of the synergy matrix
Si j = ⌊si j⌋as the degree of contribution of the projectXjto the projectXi, in percentage values
ofXi.
Si j =
S11 . . . S1m ..
. . . . ... Sm1 . . . Smm
(6)
Therefore, the rows of the matrixSi jrepresent the contributions of all other projects to the project
Xi and the columns are related to the contributions of the projectXj to all the other projects.
projects are included in the portfolio. Furthermore, the DM may be supported by experts in the company related to the portfolio management staff, a so common specialization nowadays in the project management career. This support by experts may consider their knowledge in the additional benefits over the multiples objectives that can be achieved when two projects are simultaneously implemented. The application of elicitation procedures is quite usual in applica-tions involving multicriteria decision and may involve the presence of an analyst, who has the role of supporting the DM in the process of given information in a structured way (Almeida, 2011).
The meaning of this matrix is quite clear to the DM. Actually this proposition arisen in the context of a real application of research and development (R&D) portfolio in power electricity companies. The DM felt that for some projects there was a clear improvement in the value of the objectives, by the implementation of some projects simultaneously.
The very concept of synergy implies the order of magnitude of the gain that it represents. It seems quite unlikely that the synergy due to the presence of certain projects in the portfolio generates a gain equal or superior to the value of the project considered. Intuitively, this gain should be small enough to describe its value compared to the benefit provided by the project itself, but high enough to justify the consideration of synergies in the model. Thus, it is necessary to define the
β parameter, so that it is not possible that a project’s potential contribution to synergies in the portfolio exceeds the value ofβ.
X
i
si j ≤βj, for j =1,2, . . . ,m (7)
The use of β is required as a condition in order to examine the consistency of the subjective assessment on the value of the synergiessi j. In order to choose eachβjthe decision maker must
consider two main aspects:
(1) the benefit of executing projectXj alone;
(2) the additional benefit that projectXjbrings to the portfolio when considered in conjunction
with other projects.
The second aspect can be estimated by the decision maker’s perception of the interaction between project Xj and the other candidate projects. This assessment must consider the number of
inte-ractions, that is, with how many projectsXj can interact, and the degree of influence that it can
exert over them. For example, consider a set of projects whereX1andX2are included. Suppo-sing that the synergies of X1with the other projects are of the same magnitude of the synergies amongX2and the others, ifX1interacts synergistically with more projects thanX2it has grea-ter potential to contribute synergistically to the portfolio and this reflects on the choice of theβ
parameters, so thatβ1should possibly be greater thanβ2.
the individual contributions should be used. For this purpose, the contribution in synergy for a projectXi is defined as:
C S(Xi)= m
X
j=1
xjsi jν(Xi) (8)
However, it is necessary to notice that the existence of the contribution in synergy to a project also makes it a condition that this project is present in the portfolio.
This way of modelling the synergy was found very suitable to practical situations in an actual study conducted in the context of power electricity companies.
3.3 Objective Function
After having established the measures for evaluating projects and synergies, it is possible obtain an overall value for the portfolio, conditioned to the binary decision variablesxi:
V(pr)= m
X
i=1
xi
m
X
j=1
wjzi j
+
m
X
i=1
xiν(Xi)
m
X
j=1
xjsi j
(9)
Or in terms ofν(Xi)andC S(Xi),
V(pr)= m
X
i=1
xiν(Xi)+ m
X
i=1
xiC S(Xi) (10)
The first parcel of equations 9 and 10 provides a comprehensive evaluation of the projects con-tained in the portfolio against the criteria, while the second gives a measure of the contribution of the synergies active in the portfolio.
Therefore, what is required is to maximize the value of the portfolio, so that the objective function is given byV(pr). The problem of optimization can then be formulated as follows:
max
pr∈P
V(pr)
subject to pr =x1, . . . ,xm, xi binary∀i =1, . . . ,m.
(11)
But for the model better to represent the class of problems of portfolio selection, consideration should still be given to a set of constraints that are capable of capturing some peculiarities of the cases examined.
3.4 Constraints
3.4.1 Resource constraints
In this model, the consumption of resources will be treated as a set of constraints on the sharing of each resource. Consider thatqcategories of resources are available and each project presents a resource consumption array(ci):
ci⌊ci1,ci2, . . . ,ci q⌋, for i =1, . . . ,m (12)
Consequently, the consumption of all the available projects can be represented by the consump-tion matrix, the rows of which are the consumpconsump-tion arrays of each project.
C=
c11 . . . c1q ..
. . . . ... cm1 . . . cmq
(13)
In order to set the constraints, considerBthe array of available resources:
B= ⌊b1,b2, . . . ,bq⌋ (14)
Therefore, the set of resource constraints will be such that:
pr ∙C ≤B (15)
3.4.2 Cost constraints
Commonly, limitations on funding projects are considered in the selection process. The cost constraint must ensure that the set of projects being implemented is compatible with the capital provided by the organization for this purpose. Consider the cost array of projects(R):
R=r1,r2, . . . ,rmT (16)
Denoting byF the available capital, the cost constraint becomes:
pr ∙R≤ F (17)
3.4.3 Mandatory Project Constraints
LetSM be the set of mandatory projects considered in the portfolio selection. The set of cons-traints related to the mandatory projects are such that
xi =1, ∀Xi ∈ SM (18)
3.4.4 Logical Constraints
Other interdependencies between projects may be considered by a selection model and can be de-alt with as constraints. The main relations existing between projects in this context are dependent projects and mutually exclusive projects.
– Dependent Projects: it is said that a project is dependent on another if for the first to be selected, the second necessarily must be included in the portfolio. Moreover, the second project can be included in the portfolio even though the first is not. This type of inter-dependence between projects will be modelled by the constraint represented in equation 19:
xi−xj ≥0, where the projectXj depends on the execution of projectXi (19)
– Mutually Exclusive Projects:a set of projects is considered mutually exclusive if only one of them can be included in the portfolio, which means that, once a project is selected from the set, all the others should be excluded from the portfolio. The constraint that reflects this interdependence is given by equation 20.
X
Xi∈SMC
xi ≤1, whereSMC is the set of mutually exclusive projects. (20)
3.5 General considerations on the Proposed Model
The portfolio selection model presented may have various formulations, but in general, it is summarised by:
max
pr∈P
V(pr)
subject to:
pr ∙C≤B pr ∙R≤F
xi =1 ∀Xi ∈SM
xi−xj ≥0 Xjdepends onXi
P
xi ≤1 Xi ∈SMC
pr =x1, . . . ,xm xibinary∀i =1, . . . ,m
(21)
scaling constants and criteria. In order to the model application be useful to the portfolio selec-tion problem decision making, the analyst must ensure that the evaluaselec-tions provided depict the preferences of the decision maker. The elicitation process to obtain this information from the decision maker must be comprehensive and thorough. When a group decision making process is considered, the model can be applied to the input level aggregation. This paper considers the situation of individual decision maker. Group decision process involves others issues that are not approached in this paper.
4 NUMERICAL APPLICATION
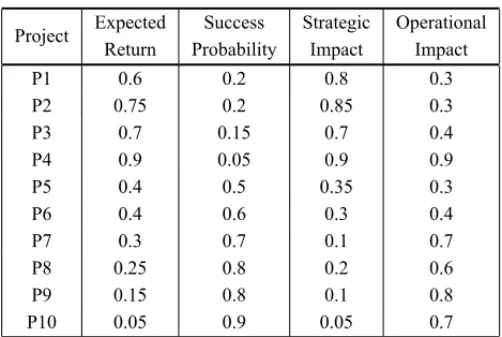
A numerical application is presented in order to illustrate the use of the model. This application is based on a real context, although real data have not been applied for reasons of confidentiality. The criteria and general structure are also based on a real situation. The objective of using rea-listic data in this case is to provide a general view of the model to the decision maker, clarifying aspects over the assessment of scores, scaling constants and synergies. It is extremely important the understanding of these concepts so as the decision maker can provide judgments that really portray his preferences.
The problem being addressed is that of choosing a portfolio from ten available R&D projects evaluated against four criteria. The criteria were chosen based on a real case study, as already mentioned, and on several empirical studies found in the literature (Coffin & Taylor III, 1996; Liberatore & Titus, 1983). The criteria considered for this application are expected return, the probability of success associated with the project, the degree of strategic impact on the organi-zation and the degree of impact on the operational processes. The first criterion, the expected return, will be treated as the percentage represented by the estimated net profit on investments. The other three criteria will also be evaluated on a scale of zero to one, because it is conside-red that the percentage values are easily understood by the decision maker in the context of the criteria presented.
values of the assessment scale were not reached by the available projects. Nevertheless, they are considered viable.
The scores elicitation process led to the normalized scaling constants arrayw(equation 3) pre-sented in Table 2.
Table 1– Project evaluation.
Project Expected Success Strategic Operational Return Probability Impact Impact
P1 0.6 0.2 0.8 0.3
P2 0.75 0.2 0.85 0.3
P3 0.7 0.15 0.7 0.4
P4 0.9 0.05 0.9 0.9
P5 0.4 0.5 0.35 0.3
P6 0.4 0.6 0.3 0.4
P7 0.3 0.7 0.1 0.7
P8 0.25 0.8 0.2 0.6
P9 0.15 0.8 0.1 0.8
P10 0.05 0.9 0.05 0.7
Table 2– Criteria scaling constants.
Criterion Expected Success Strategic Operational Return Probability Impact Impact Constant
0.3 0.3 0.25 0.15
scale
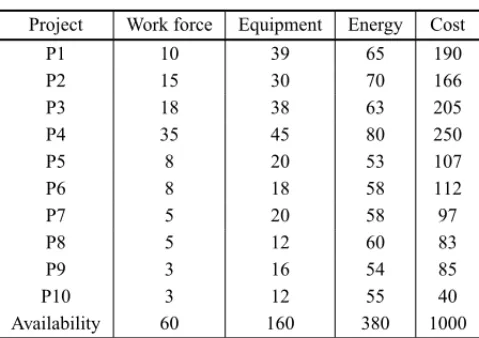
Only three resource constraints and the cost constraint are considered. The three resources are:
(1) labour – expressed as the number of individuals needed;
(2) equipment – amount of hours of use of certain equipment;
(3) energy – expressed in megawatts (MW) consumed by the project.
Table 3 presents the consumption of resources and the cost (in $103) for each project and their availability. These are the input data for the constraints, where from the second to fourth columns are the data related to the resource constraints (equation 15) and the fifth column are the data for the cost constraint (equation 17).
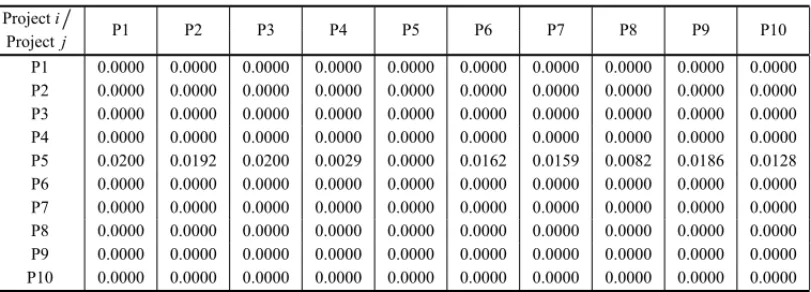
The scenarios are distinguished by their synergy matrixSi j (equation 6). These scenarios were designed with the purpose of portraying the model operation, thus allowing the decision maker to understand its logic before the start of the application. Therefore, the five scenarios discussed below depict extreme situations for illustrative purposes. This does not mean that they represent common conditions.
Table 3– Constraints.
Project Work force Equipment Energy Cost
P1 10 39 65 190
P2 15 30 70 166
P3 18 38 63 205
P4 35 45 80 250
P5 8 20 53 107
P6 8 18 58 112
P7 5 20 58 97
P8 5 12 60 83
P9 3 16 54 85
P10 3 12 55 40
Availability 60 160 380 1000
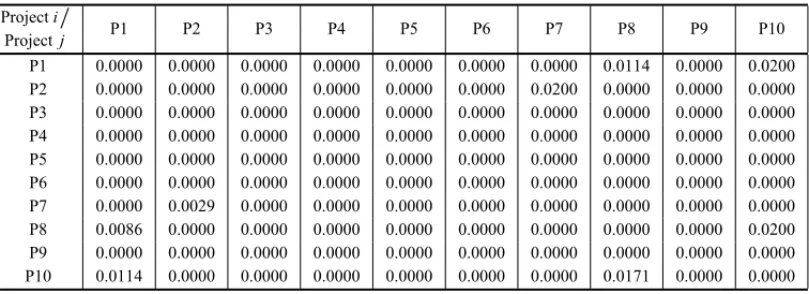
synergistic contributions from other ones. Such scenarios allow evaluating the trade-off between project values and synergy gains. Scenario 4 presents mutually synergistic projects, which ma-kes the synergy matrix symmetrical in relation to the main diagonal. Despite the symmetry, it cannot be said that the synergy value added to a project is equal to the value it adds, because the percentages are related to the value of the project that receives the contribution. Scenario 5 portrays the existence of synergy groups by considering two groups:{P1, P8, P10}and{P2, P7}. Given the set of available projects X, a synergy group is a sub-set of Xin which the constituent projects interact synergistically with each other.
The value of β used throughout the application is 0.2. Given the explanatory nature of the application, this value was obtained as an appropriate upper bound for the synergy contribution of each project, considering the aspects for the definition of β. These values could be better refined, but this task was left over the decision maker after the first contact with the data. The concern here is to provide parameters for the understanding of the model and the concepts linked to it.
The synergy matrices for each scenario are presented in the appendix, except for scenario 1, where they do not exist. It can be observed that due to the fact that the main diagonal of the matrices represents, in theory, the gain from the synergistic interaction of a project with itself, non-zero values make no sense.
The model formulation applied to this problem is given by equation 22, where the input data are specified in the previous tables and the decision variables array prconsists of ten binary variables related to the presence of the considered projects in the portfolio.
max
pr∈P
V(pr)
subject to:
pr ∙C ≤B pr ∙R≤F pr =
x1, . . . ,x10 xibinary∀i =1, . . . ,10
Table 4 presents the main results for the scenarios described. For each scenario were obtained, by applying the model, the portfolio to be selected and the final evaluation for each of these represented in the third column by the Portfolio Value(V p), which was calculated based on equation 9. The fourth column presents an indicator, the synergy gain, which allows evaluating how much the synergies represent in terms of the sum of the absolute values of the projects to the portfolio. The synergy gain is obtained by dividing the second parcel of equation 9 by its first parcel, according to equation 23. In the other four columns are shown the values obtained for the constraints in each scenario.
SG(pr)= m
P
i=1
xiν(Xi) m
P
j=1
xjsi j
!
m
P
i=1
xi n
P
j=1
wjzi j
! (23)
Table 4– Scenario Results.
Scenario Selected Portfolio Synergy Work Force Equipment Energy Portfolio Portfolio Value(Vp) Gain Consumption Consumption Consumption Cost
1 P1 P2 P3 2.8375 – 59 153 370 841
P6 P8 P9
2 P1 P2 P3 2.8556 0.8% 56 155 370 826
P7 P8 P9
3 P1 P2 P3 2.8396 1.2% 59 155 365 836
P5 P8 P9
4 P1 P2 P3 2.9282 5.4% 59 151 366 791
P5 P8 P10
5 P1 P2 P3 2.8568 1.8% 56 151 371 781
P7 P8 P10
In the first scenario, it is observed that the projects selected are those with the greatest overall evaluations and lowest consumption of resources. Despite this, projectP4 was not selected due to its high consumption of resources, in addition to the high cost when compared to other projects with a lower overall value, since this does not allow other projects with a good evaluation to be considered in conjunction withP4. Although project P9 has the same overall value as project
P7, it consumes fewer resources, and therefore has been selected. The projects with the lowest individual value were not considered in the selected portfolio (P5 andP10).
be noted that the absence of other gains resulting from synergies in these scenarios is merely illustrative, because in real situations this type of interaction rarely occurs alone.
In scenario 4, the increase of the synergistic contribution occurs due to the comparatively larger amounts of synergistic interactions between the available projects. Consequently, the value of some projects plus the amounts due to the synergies exceeds the gain provided by projects of greatest value, which receive few or no contributions. Moreover, the resulting portfolio consumes fewer resources, compared to those obtained in the first scenario, as Table 4 shows. This fact illustrates that, in this case, the values attributed to the synergy relations are determinants in portfolio selection.
Scenario 5 allows the observation that there are thresholds for synergy values from which the projects of the two groups are considered in the portfolio. This fact occurs because these two synergy groups have low value projects together with other high-value ones. Therefore, the synergy value should be sufficient, when added to the portfolio, to overcome the presence of a high-value project, thus justifying the selection of the entire group.
These scenarios enabled the decision maker to identify the impact of synergies in the value of projects and the trade-off between project values and the synergy contributions in the model. If this analysis were developed, the decision maker could easily identify and measure the existing synergies in his business context, so that the model was easily applied and allowed a satisfactory portfolio to be generated.
5 CONCLUSIONS
The model developed contributes as an alternative approach to the incipient study of synergies between projects and provides a multi-criteria approach for project portfolio selection. The ad-vantage that the optimization approach provides for the model is its versatility for application to different types of problems, as it allows for the particularity of the relationships between projects.
Therefore the main contribution in this model is the proposition for dealing with synergies, which is based on a real situation faced in a study conducted for R&D projects portfolio in the context of power electricity companies. Furthermore, it has been discussed the facility for the decision maker to understand and deal with this view for synergies. The elicitation procedure to obtains the synergies matrix may be supported by experts in the management project staff, an usual organizational issue found in project management nowadays. Moreover, in order to facilitate the elicitation of the synergies, a consistency parameterβ has been introduced. The use of the parameterβ allows some coherence to be introduced to the model, thus setting limits on the contributions from synergies.
The main constraints for problems of project and portfolio selection have been presented, but the model is not limited to them, so that other constraints can be considered.
solution for incorporating synergies in the portfolio decision, but this does not solve the problem related to the value that should be added. The model presented in this paper offers an alternative measure based on the value of the project considered that seems to be easy for the specialist to deal with.
Further work to be addressed on this kind of problem might focus on investigating the appli-cability of other types of objective functions that also aggregate the synergy aspect. Another important issue is the situations where the synergies occur due to the interaction between more than two projects. In this case it may be difficult to separate the contributions into individual project measures. So, other measures should be developed in order to deal with this kind of interrelationship.
APPENDIX: SINERGY MATRICES
Table 5– Synergy matrix for scenario 2.
Projecti
P1 P2 P3 P4 P5 P6 P7 P8 P9 P10
Projectj
P1 0.0000 0.0000 0.0000 0.0000 0.0000 0.0000 0.0126 0.0000 0.0000 0.0000 P2 0.0000 0.0000 0.0000 0.0000 0.0000 0.0000 0.0193 0.0000 0.0000 0.0000 P3 0.0000 0.0000 0.0000 0.0000 0.0000 0.0000 0.0025 0.0000 0.0000 0.0000 P4 0.0000 0.0000 0.0000 0.0000 0.0000 0.0000 0.0126 0.0000 0.0000 0.0000 P5 0.0000 0.0000 0.0000 0.0000 0.0000 0.0000 0.0026 0.0000 0.0000 0.0000 P6 0.0000 0.0000 0.0000 0.0000 0.0000 0.0000 0.0056 0.0000 0.0000 0.0000 P7 0.0000 0.0000 0.0000 0.0000 0.0000 0.0000 0.0000 0.0000 0.0000 0.0000 P8 0.0000 0.0000 0.0000 0.0000 0.0000 0.0000 0.0092 0.0000 0.0000 0.0000 P9 0.0000 0.0000 0.0000 0.0000 0.0000 0.0000 0.0025 0.0000 0.0000 0.0000 P10 0.0000 0.0000 0.0000 0.0000 0.0000 0.0000 0.0200 0.0000 0.0000 0.0000
Table 6– Synergy matrix for scenario 3.
Projecti
P1 P2 P3 P4 P5 P6 P7 P8 P9 P10
Projectj
Table 7– Synergy matrix for scenario 4.
Projecti
P1 P2 P3 P4 P5 P6 P7 P8 P9 P10
Projectj
P1 0.0000 0.0129 0.0047 0.0182 0.0200 0.0000 0.0040 0.0000 0.0082 0.0171 P2 0.0129 0.0000 0.0000 0.0160 0.0171 0.0029 0.0014 0.0182 0.0000 0.0084 P3 0.0047 0.0000 0.0000 0.0124 0.0143 0.0000 0.0092 0.0000 0.0000 0.0114 P4 0.0182 0.0160 0.0124 0.0000 0.0140 0.0061 0.0005 0.0037 0.0000 0.0042 P5 0.0200 0.0171 0.0143 0.0140 0.0000 0.0058 0.0092 0.0058 0.0000 0.0171 P6 0.0000 0.0029 0.0000 0.0061 0.0058 0.0000 0.0000 0.0000 0.0066 0.0075 P7 0.0040 0.0014 0.0092 0.0005 0.0092 0.0000 0.0000 0.0197 0.0000 0.0000 P8 0.0000 0.0182 0.0000 0.0037 0.0058 0.0000 0.0197 0.0000 0.0067 0.0187 P9 0.0082 0.0000 0.0000 0.0000 0.0000 0.0066 0.0000 0.0067 0.0000 0.0182 P10 0.0171 0.0084 0.0114 0.0042 0.0171 0.0075 0.0000 0.0187 0.0182 0.0000
Table 8– Synergy matrix for scenario 5.
Projecti
P1 P2 P3 P4 P5 P6 P7 P8 P9 P10
Projectj
P1 0.0000 0.0000 0.0000 0.0000 0.0000 0.0000 0.0000 0.0114 0.0000 0.0200 P2 0.0000 0.0000 0.0000 0.0000 0.0000 0.0000 0.0200 0.0000 0.0000 0.0000 P3 0.0000 0.0000 0.0000 0.0000 0.0000 0.0000 0.0000 0.0000 0.0000 0.0000 P4 0.0000 0.0000 0.0000 0.0000 0.0000 0.0000 0.0000 0.0000 0.0000 0.0000 P5 0.0000 0.0000 0.0000 0.0000 0.0000 0.0000 0.0000 0.0000 0.0000 0.0000 P6 0.0000 0.0000 0.0000 0.0000 0.0000 0.0000 0.0000 0.0000 0.0000 0.0000 P7 0.0000 0.0029 0.0000 0.0000 0.0000 0.0000 0.0000 0.0000 0.0000 0.0000 P8 0.0086 0.0000 0.0000 0.0000 0.0000 0.0000 0.0000 0.0000 0.0000 0.0200 P9 0.0000 0.0000 0.0000 0.0000 0.0000 0.0000 0.0000 0.0000 0.0000 0.0000 P10 0.0114 0.0000 0.0000 0.0000 0.0000 0.0000 0.0000 0.0171 0.0000 0.0000
ACKNOWLEDGMENTS
This study is part of a research program funded by the Brazilian Research Council (CNPq). The authors acknowledge the valuable suggestions made by anonymous reviewers to a previous version of this paper, which have contributed to make this a better final version.
REFERENCES
[1] ALBUQUERQUE LL, ALMEIDAAT & CAVALCANTECAV. 2009. Aplicabilidade da Programac¸˜ao Matem´atica Multi-Objetivo no Planejamento da Expans˜ao de Longo Prazo da Gerac˜ao no Brasil.
Pesquisa Operacional,29: 153–177.
[2] ALENCARLH & ALMEIDAAT. 2008. Multicriteria Decision Group Model for Suppliers Selection.
Pesquisa Operacional,28: 321–337.
[4] ALMEIDAAT. 2011. O Conhecimento e o Uso de M´etodos Multicrit´erio de Apoio a Decis˜ao. 2aEd. Recife: Editora Universit´aria UFPE.
[5] ALMEIDAAT. 2005. Modelagem Multicrit´erio para Selec¸˜ao de Intervalos de Manutenc¸˜ao Preventiva Baseada na Teoria da Utilidade Multiatributo.Pesquisa Operacional,25(1): 69–81.
[6] ARCHERNP & GHASEMZADEHF. 1999. An integrated framework for project portfolio selection.
International Journal of Project Management,17(4): 207–216.
[7] BELTON V & STEWART TJ. 2002. Multiple Criteria Decision Analysis. Kluwer Academic Pu-blishers.
[8] BRADIMA, DAVISD & DAVISD. 2001. A comprehensive 0-1 goal programming model for project selection.International Journal of Project Management,19: 243–252.
[9] CAMPOSVR & ALMEIDAATDE. 2006. Modelo multicrit´erio de decis˜ao para localizac¸˜ao de nova Laguaribara com VIP Analysis.Pesquisa Operacional,26(1): 91–107.
[10] CARLSSONC, FULLER´ R, HEIKKILA¨M & MAJLENDERP. 2006. A fuzzy approach to R&D project portfolio selection.International Journal of Approximate Reasoning, s.n.t..
[11] CHIENC.-F. 2002. A portfolio evaluation framework for selecting R&D Projects.R&D Management,
32(4): 359–368.
[12] COFFIN MA & TAYLORIII BW. 1996. Multiple Criteria R&D Project Selection and Scheduling using Fuzzy Logic.Computers & Operations Research,23(3): 207–220.
[13] COLDRICKS, LONGHURST P, IVEY P & HANNIS J. 2005. An R&D options selection model for investment decisions.Technovation,25: 185–193.
[14] EILATH, GOLANYB & SHTUBA. 2006. R&D project evaluation: An integrated DEA and balanced scorecard approach.European Journal of Operational Research, doi:10.1016/j.omega.2006.05.002.
[15] FERREIRARJP, ALMEIDA-FILHOATDE& SOUZAFMCDE. 2009. A decision model for portfolio selection.Pesquisa Operacional,29(2): 403–417.
[16] GHASEMZADEHF, ARCHERNP & IYOGUNP. 1999. A zero-one model for project selection and scheduling.Journal of the Operational Research Society,50: 745–755.
[17] GOLABIK, KIRKWOODCW & SICHERMANA. 1981. Selecting a portfolio of solar energy projects using multi-attribute preference theory.Management Science,27(2): 174–189.
[18] HALLNG, HERSHEYJC, KESSLERLG & STOTTSRC. 1992. A model for making project funding decisions at the National Cancer Institute.Operations Research,40: 1040–1052.
[19] HANK-H & KIMJ-H. 2002. Quantum-inspired evolutionary algorithm for a class of combinatorial optimization.IEEE Transactions on Evolutionary Computation,6(6): 580–593.
[20] KEENEYRL & RAIFFAH. 1976. Decision with Multiple Objectives: Preferences and Value Trade-offs, John Wiley & Sons.
[21] KLAPKAJ & PINOS˜ P. 2002. Decision support system for multicriterial R&D and information sys-tems projects selection.European Journal of Operational Research,140: 434–446.
[23] LIBERATOREMJ & TITUSGJ. 1983. The practice of management science on R&D project mana-gement.Management Science,29: 962–974.
[24] MEIRELLESCLA & GOMESLFAM. 2009. O apoio multicrit´erio `a decis˜ao como instrumento de gest˜ao do conhecimento: uma aplicac¸˜ao `a ind´ustria de refino de petr´oleo.Pesquisa Operacional,
29(2): 451–470.
[25] MORAISDC, CAVALCANTECAV & ALMEIDAATDE. 2010. Priorizac¸˜ao de ´Areas de Controle de Perdas em Redes de Distribuic¸˜ao de ´Agua.Pesquisa Operacional,30(1): 15–32.
[26] PRABHUGN. 1999. Managing research collaborations as a portfolio of contracts: A risk reduction strategy by pharmaceutical firms.International Journal of Technology Management,18(3): 207–231.
[27] RANGELLAD & GOMESLFAM. 2007. Determinac¸˜ao do valor de referˆencia do aluguel de im ´oveis residenciais empregando o M´etodo TODIM.Pesquisa Operacional,27(2): 357–372.
[28] SANTHANAMR & KYPARISISJ. 1995. A multiple criteria decision model for information system project selection.Computers and Operations Research,22(8): 807–818.
[29] SZAJUBOKNK, MIRANDACMGDE & ALMEIDA ATDE. 2006. Uso Do M´etodo Multicrit´erio ELECTRE TRI Para Classificac¸˜ao De Estoques Na Construc¸˜ao Civil.Pesquisa Operacional, 26: 625–648.