Resumo
A região do Baixo Tocantins oferece uma gama de produtos agrícolas e extrativistas como o açaí, a pimenta-do-reino, o dendê e a mandioca, que são produzidos para os mercados locais e nacional e para a exportação. Esses produtos não somente geram valor no setor agrícola, mas também indiretamente em outros setores como a agroindústria e o comércio.As cadeias produtivas dos produtos agroextrativistas formam a base da economia rural e portanto, do desenvolvimento dos nove municípios da região. Um total de vinte cadeias são analisadas desde a produção primária até o consumo final, incluindo todos os agentes intermediários no meio. A evolução da economia regional é revelada combinando os dados estruturais das cadeias produtivas com dados da produção municipal para os anos 2001-2011. Os resultados mostram que o valor bruto de produção agroextrativista aumentou mais de dez vezes, principalmente devido a um enorme crescimento das plantações de açaí. Um forte aumento de preços também influenciou positivamente o valor de todos os produtos. Não obstante, só na metade dos produtos estudados também houve um aumento na quantidade produzida. O valor agregado regional é 50% do valor de produção agroextrativista. Por conseguinte, o boom dos preços agrícolas deveria ter beneficiado também os setores não-agrícolas, incluindo os comerciantes e processadores de açaí, assim como a indústria do azeite-de-dendê. Estas dinâmicas trazem conseqüências para o desenvolvimento econômico, social e ecológico da região.
Abstract
The Lower Tocantins river region offersa wide range of agricultural and extractiveproducts like açaí palm fruits, pepper, oil palmsand manioc, whichare produced for localand national consumption and for exports. These productsdo not only generate value added in the agricultural sector, but also indirectly in other sectors like agro-industry and commerce. The value chains of agricultural and extractive products form the basis of the rural economy and hence for the development of the nine municipalities of the region.Twentyvalue chains are analyzed from primary producers to final consumers,including all the intermediaries in between. The evolution of the regional economy is then revealed by combining the structural value chain data with production data from the municipal level for the years 2001-2011. The results showthat agricultural and extractiveoutput valuehas increased by more than tenfold, mainly due to an enormous growth of açaí plantations. The strong price increases also influenced positively the output value of all products, but only for halfof them an increase in output volumes could be observed. The regional value added is 50% of the agricultural output value.Therefore, the price boom should also have generatedhigher benefits to the regional non-agricultural sectors, including theaçaí traders and processors as well as the palm oil industry. These dynamics have consequences for the economic, social and ecologicaldevelopment of the region.
Agro-extractivist value chains and regional development: the
case of the Lower Tocantins River in the Brazilian Amazon
Cadeias produtivas agro-extrativistas e o desenvolvimento regional:
o caso do Baixo Tocantins na Amazônia brasileira
Jochen Dürr – Research Associate University of Kassel - Department of Development Economics, Migration and Agricultural Policy, Kassel, Alemanha. E-mail: [email protected]
Keywords
Agro-Extractivist ValueChains. Regional Development.Lower Tocantins River.Input-Output-Tables.
Palavras-chave
Cadeias Produtivas Agro-Extrativistas. Desenvolvimento Regional. Baixo Tocantins. Matrizes Insumo-Produto.
INTRODUCTION
The Lower Tocantins River region is part of the northern Brazilian Federal State of Pará. It is situated down-stream of the Tucuruí-dam which contains one of the biggest hydroelectric power plants of Brazil.The construction of the dam in the early 1980s had various negative ecological, economic and social impacts on this Amazonian region. Since the middle of the 1990s, the regional economy began to recover, but was still dependent on only few main crops like açaí1 palm fruits, pepper, oil palms or manioc flour, produced for local and national
consumption and for exports(DÜRR; COSTA, 2008). In the 2000s, the market growth of açaíled to the expansion of its cultivation inupland areas (terra firma) which allows augmenting production and productivity of this species (HOMMA et al. 2006).
This paper looks closer on what happened in the regional economy since
the year 2001, specifically, on how the different agricultural value chains of the
region evolved. As the agricultural and extractive productsdo not only generate value added in the agricultural sector, but also indirectly in other sectors like industry and commerce, the value chains of these products form the basis of the rural economy and also for the regional development.
To analyze the regional economy, an innovative methodology, developed by Costa (2002) is applied. This methodology allows, by using a value chain approach, constructingan ascending social accounting system („Contabilidade social ascendente“, COSTA 2002:3) of the regional economy. By using this methodology, the paper tries to achieve the following objectives: First, toidentify the main value chains and to quantify their contributions in terms of output and value added
to the regional economy. Second, based on these quantifications, to analyze the
dynamics of the regional economy for the period 2001 to 2011.Third, to give some indications on which are the drivers behind these dynamics.Fourth, to consider the consequences of these dynamics for the regional development.
However, two types of data limitations should already be mentioned: first,
in order toanalyze the evolution of agricultural production on a year-to-year basis, municipality production data,which are not based on surveys or census2,
had to be used. Second, as there was no follow-up study done, the structures of
1 Açaí (Euterpe oleraceamart.) is an indigenous palm of the Amazon estuary. Its fruits are mixed
with water and beaten to produce a mash which is eaten with manioc flour as a basic diet in the region. Because of its anti-oxidant capacities, it has become popular as a drink in fitness studios all over Brazil.
2 The data on municipality level are estimates done by the local authorities and other organizations
the value chains presented in Dürr and Costa (2008)were utilized, not considering possible changes in these structures.
The methodology and data base areelaborated in more detail in the next section. Then, some characteristics of the Lower Tocantins River region are described.The following section presentsthe dynamics of the agricultural and extractive production of the region. Subsequently, the main results of the study, particularly the evolution of the different value chains during the years 2001-2011, are presented. The paper concludes with some remarks on the potential of rural development in an Amazonian region.
METHODOLOGY
The ascending social accounting system (ContasSociaisAscendentes Alfa, COSTA 2002) is based on the Leontief input-output scheme (LEONTIEF, 1983), which allowsconstructing the social accounting of an economy of k products and magents or sectors in a given political-administrative or geographical unit. It can also be used to observe the relationships that occur in the formation of supply and the generation of social income derived from a single product. So the social accounting of an economy can be operated as the aggregate result of the formation of supply and income generation associated with each of the k products that comprise it.
Based on these principles, the system operates from the interrelationship
between five types of matrices: the matrix of intermediate relations or endogenous
demand of the production system (zij), a final or autonomous demand column vector (yi), an column vector of gross value of production (xi), a vector-line ofvalue added (wj) and another vector-line of gross income (yj), for i = j representing the number of sectors of the production system.Each zijof the system is the result of the product of the amount q transacted between agent or sector i with agent or sectorjand its price p recorded in this intermediation. So that
ij ij
ij
q
p
z
=
.
(1)Each row i records the sales of agent i to all other productive agents and
final consumers (yi); each column j records the purchases of agent or sector j, and its sum the value of inputs required by them. That said, we can calculate the remaining elements of the model as being
∑
= + = n j ij i i y zx 1 (2)
∑
=−
=
n i ij ij
x
z
w
1
j n
i ij
j
z
w
y
=
∑
+
=1 (4)
∑
∑ ∑
= = = + = n i i n i n j ij y z X 1 1 1 (5)y
∑ ∑
∑
= = = + = n j n i n j j ij w z
1 1 1
(6)
such that X = Y,where X represents the gross value of production (total output) and Y total gross income (or total outlay).
Agricultural value chains can be defined as a sequence of economic
activities, starting from input production and then passing through transformation
and commercialization processes until reaching the final consumers, including all of the economic agents (like farmers, processing firms, traders etc.) which
add value in these activities. Based on these considerations, the methodology of Costa (2002) is developed by investigating agricultural value chains,which permits to construct the Leontief input-output-matrices. By aggregating and disaggregating the matricesit is possible toquantify for each product, each sector and each geographical level important macro-variables like output, value added and employment (DÜRR, 2011). Also, simulations through input-output-models can be made for the local or regional economy (see for example, RICHARDSON, 1972; HADDAD, 1976).
The bottom-up approachconsists in following the flows of the products from the agricultural (α-) sectors through the different (geographic) levels and sectors until reaching the final consumers. In that process, the transactions of the non-agricultural (β-) sectors are investigated at three different levels (local/
regional3, federal state and national). For each product and sector, a computable
equilibrium is established by equalizing the amounts of supply and demand (COSTA, 2012). This means that the quantities bought and sold by each individual
agent and by each of the β-sectors have to equalize. But the quantities of the
individual agents cannot always simply be summed up. They have to be corrected if another buying or selling sectorcounts with higher quantities. For example, if there is a bottleneck in the value chain consisting of few wholesalers, the total quantities of the numerous small rural traders who sold the produce to the wholesalers have to be the same as the quantities bought by these few agents. This means also that some kind of cross-checking is inherent in the survey process.
3 In this paper, we did not disaggregate the data to the municipality level, therefore the terms
If a product undergoes some transformation and weight loss, a transformation factorwas used in order to correct the prices which are always related to the original weights. The whole process guarantees that the total (original) quantity
produced by the farmers and consumed by the final consumers are equal. The
special software Netz® was used which warrants that for each agent and sector this basic promise holds.
The value added of each sector is calculated by subtracting the value of its produce sold from the value of its produce bought. This allows calculating gross margins or mark-ups (which still include other inputs like energy, packing materials, etc.).
The primary data of the β-sectorsshow the structure of the value chains
in the form of input-output-tables. As these data are based on a survey, they normally do not include total amounts of agricultural production of a certain
region. Therefore, they are merged with official statistical data of the α-sectors.
This is done by multiplying the matrix with an expansion vectorof total agricultural output. This factor eis calculated for each product by first multiplying the (secondary data of)total agricultural output valuevsi, as reported in the Municipal Agricultural Production (PAM-IBGE) and the Vegetable Extractive and Forest Production (PEVS-IBGE) data4, with the share m
i of marketed production to
total production5, derived from IBGE (2006)6, and then dividing the result by
the investigated output values vpi derived from the primarydata of the β-sectors: e = vsimi/ vpi
This factor is calculated for each year of the period 2001-2011, so that
the evolution of the α-sectors can be linked to the evolution of theβ-sectors. As the coefficients of the input-output-table are fixed, it is supposed that the
structure of the value chains did not change during the decade. This means that only the total level of output isregisteredand distributed by this method: if the output of one product increases (decreases), thisincreased (decreased)
output will be allocated to the β-sectors proportionately to their original share
in total output. An unchanged structure of the input-output-tables also means that the value added margins are kept constant and that the distribution of
final demand does not change. For example, it is supposed that if the output
4 The data from the CensoAgropecuário were not used in this paper because this census is carried
out only once in every ten years, being the last ones 1995/96 and 2005/06, so it would not have been possible to do analysis neither of the recent years, nor on a year-to-year-basis.
5 This is necessary because the β-sectors do not receive all of the agricultural output; part ofthe
output is consumed directly by the farmers.
6 For perennial products, no information was available at IBGE (2006), so it was necessary to
value of palm heartsrises by 10% (be it through higher prices and/or higher
production volumes), also the palm heart traders and the processorswill have to augmenttheir output in the same order of 10%.With constant gross margins, this leads to an increaseof value added of each sector of also 10%. And the relative
shares of final demand of palm hearts, distributed between regional, federal state
and national consumption, will remain the same7. Nevertheless, as the different
products evolve differently, for the economy as a whole, there are changes in the
composition of final demand and in the value added margins.
It seems a heroic assumption that the structure of the value chains in general, and the value added margins in particular, did not change over the ten year period. But theoretically, in a competitive market system the transmission of changing prices along the value chain is expected to result in stable margins8
of the economic agents. Empirically, a comparison of value chains from studies in the region, but of different years(DÜRR, 2001; DÜRR; COSTA, 2008; IDESP, 2012), shows similar total and sectorial mark-ups. Also, a comparison between producer prices in the Lower Tocantins regionwith consumer prices in the metropolitan region ofBelém(as reported by IBGE) and with export prices showed similar growth rates between the years 2001-2010 for the most important regional products (manioc, açaí, pepper)9. Therefore, using constant coefficients of the input-output table can be justified to calculate the evolution
of the regional economy.
DATA BASE
The survey was conducted in the nine municipalities of the Lower Tocantins region between June and November 2004. In total, 34 value chains
were included and 600 intermediaries of the β-sectorswere interviewed with a
standardized questionnaire.The questionnaire included questions about volumes and prices, origin and destination of the products, and the value adding activities (like transport, processing and so on) of each transaction of the agents. The structure of the value chains were published in Dürr and Costa (2008). In this paper, only 20 products (out of the 34) for which production data from IBGE
7 With the exception of açaí where changes of final demand were recorded, see footnote 10. 8 The question here is if the absolute or the relative margins are stable. If absolute margins
remain stable, relative margins change with the price level.
9 Nevertheless, it should be mentioned that other products had quite different growth rates,
(PAM, PEVS) existare described10.Five different β-sectors were distinguished
in the value chains: small rural traders (atravessadores), processing industry,
transforming industry, wholesalers and retailers. The β-sectors were interviewed
on the regional and federal state level. Consumer prices on the national level were taken from retailers’ information on the Internet.
THE REGION OF THE LOWER TOCANTINS RIVER
The Lower Tocantins River (Baixo Tocantins) region consists of the micro-region Cametá, which includes seven municipalities: Abaetetuba, Baião, Cametá, Igarapé-Miri, Limoeiro do Ajuru, Mocajubaand Oeiras do Pará. The municipalities ofBarcarena and Moju are not part of the micro-region, but, as they also suffered negative impacts of the Tucuruí-dam, were included in this study. The total area of the nine municipalities comprises 27 thousand square km, and the population is around 600 thousands, 270 thousands of whom live in non-agglomerated rural areas (IBGE, 2010), many of them directly on the river sides (the so-called ribeirinhos).
The region is part of the Amazonian estuary and is characterized by high
precipitation levels and the influence of the tides. The production systems can be divided into flooded areas (várzea) and dry lands (terra firme). In the flooded areas, mainly on the numerous islands in the river and along the many natural canals (igarapés), an extractive production system of açaí palm fruits,palm hearts,
andiroba palm and cocoa predominates, besides fishing. On the dry land, pepper
is the main cash crop, and manioc the main subsistence crop. There is little primary forest cover left. In contrast to other Amazonian regions, little cattle ranching have been introduced so far.
With the construction of the Tucuruí-dam, but also because of diminishing fertility of the dry land, caused by the predominant slash-and-burn agriculture, the two production systems were negatively affected and suffered a crisis at the
end of the 1980s. The region became a net importer of fish, and products like
beans, corn and rice nearly disappeared. In addition, the low international pepper
prices influenced negatively the local economy. Since the middle of the 1990s,
with higher demand for the açaípalm fruits, better pepper prices, and new credit lines from state banks, the regional economy recovered slightly. Nevertheless, despite of attempts to diversify the economy, it still is highly dependent on few products like pepper, açaí and manioc and still has to import basic food like beans, corn, rice and banana. Only a few, mainly small and medium agro-industries exist
10 For açaí, input-output-tables from Costa (2014), based on Dürr and Costa (2008) and IDESP
for palm hearts, Pará nuts, sugar cane, coffee, coco nut, and palm oil, besides the huge number of mini-processing units of açaíand manioc(DÜRR; COSTA 2008).
One problem is the inadequate infrastructure (roads, energy) of the vast region. Most of the transport has to be done by boats. As the majority of the farmers live isolated and far away from the cities, the middlemen (called atravessadores)
have become characteristic and important figuresin the commercialization of
agricultural products. There are only two mayor cities, Cametá and Abaetetuba (with 40 and 80 thousand inhabitants, respectively), which serve as commercial centers. The capital of the Federal State of Pará,Belém, is 150 km away from Cametá (which lies in the center of the region) and, with its two million residents, represents a big market for the regional products and serves as a connectingpoint to the national and export markets.
The region is dominated by peasant systems, which apply mainly family labor:97% of the 30 thousand farms are categorized as family agriculture (agricultura familiar). They employ 95% of the total agricultural work force of 117 thousand persons, possess 72% of the total land (of 1 million ha), and produce 90% of the total agricultural output (of R$ 684 million) (IBGE, 2006). The main exception is oil palmproduction, where a national company has established large plantations primarily in the municipality of Moju.
THE DYNAMICS OF THE AGRICULTURAL AND EXTRACTIVE PRODUCTION
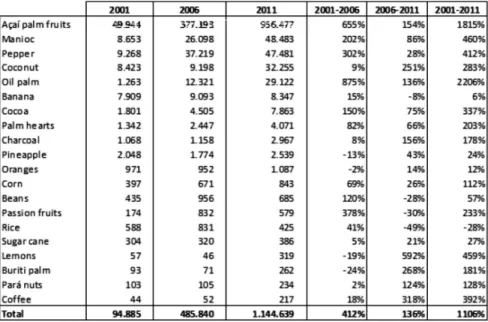
Table 1 presents the total output value in basic year (2001) prices of the twenty products included in this paper for the Lower Tocantins region. In 2011,
the predominance of five products, namely açaípalm fruits, manioc, pepper,
coconut and oil palm, is striking. They account for 91% of the total production value of R$ 353 million. Nevertheless, in 2001, themost prominent product, açaí, accounted for 53% of the total output of R$ 95 million. Ten years later, this percentage has risen to 84% of total output of R$ 1144 million. This means that the agricultural and extractive production has not only increased in real terms by 1100% in the decade 2001-2011, but also that this increase has beendominated mainly by one product: açaí. Even if some other products also increased their output value considerably, for example manioc (460%), pepper (412%), oil palm (2206%), cocoa (337%) and palm hearts (203%).The overall dynamics are more
pronouncedin relative terms in the first half (2001-2006) of the decade (412%
more accentuated in the first half, whereas coconut had its growth mainly in the
second half of the decade.
Table 1 – Agricultural output value in real terms of the nine municipalities of the Lower Tocantins region, in 1.000 R$, and growth rates
Source: IBGE (PAM, PEVS), own calculations
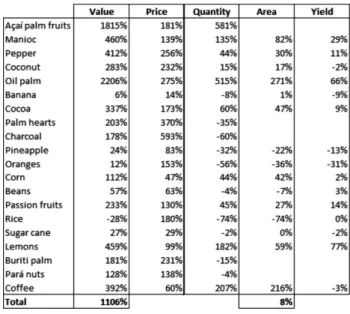
What are the drivers behind these overallhighly positive growth rates? In order to analyze this, the output value growth is divided in its main components: production volume, which can be subdivided in area (ha), yields per ha, and price. Table 2 shows the results. First, the output growth was only in a small proportion due to an increase in the cultivated area of the annual and perennial
crops (there are no figures of the extractive products, which are by definition, not
cultivated in a certain area), which was just 8%. Second, the prices of all products increased in real terms, and some of them quite drastically. The prices of all products but açaí, palm oil, lemon and coffee, grew more than their respective quantities. This means that in these cases the growth has mainly been due to the hike in prices which in some cases even could compensate for negative rates in output volumes. Third, output volumes decreased for half of the products (10 out of 20),including some important products like banana and palm hearts.It is also worrying that the output of nearly all extractive crops with the exception of cocoaand açaí11has been fallingbetween 2001 and 2011. It is not clear if these are
11 There is a data problem with the quantities of açaí reported in the PEVS-IBGE. In the
natural variations or if there is a trend behind these figures, caused for example
by a depletion of the natural resource basis. Forth, if there was growth in output quantities, it was mainly due to an expansion in the cultivated area. Only lemons,
manioc and oil palmsregistered significant increases also in their yields. For the
other products, yields did not change much. There are no data available for the extractive products, which are considered natural, “wild” products where
yields can hardly be influenced by the farmers.Fifth, all these dynamics were
overshadowed by the boom of açaí plantations which resulted in a 581% increase in production volume. Coupled with a price boom of 181%, this led to an increase in the value of production which in 2011 was nearly twenty times higher than ten years before. In absolute terms, the production of açaí plantations as recorded in the PAM-IBGE augmented from nearly zero to 430 thousand tons. Whereas the quantities coming from extractive production systems stagnated, accountingonly for 86 thousand tons in 2011. Of course, this raises the question of the reliabilityof the PAM-IBGE data on açaí. But even if the data areto some extent exaggerated, it seems that the regional economy underwent a structural change towards the predominance of açaí plantations.
Table 2 - Growth rates of agricultural output value, prices, quantities, areas and yields, between 2001-2011, Lower Tocantins region
Source: IBGE (PAM, PEVS), own calculations
THE EVOLUTION OF THE VALUE CHAINS
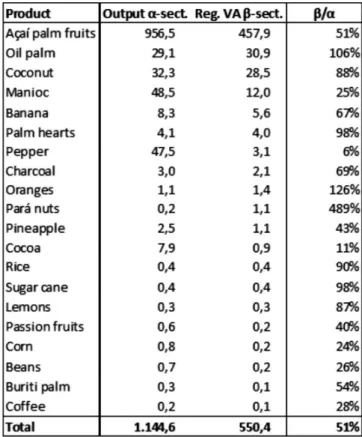
The produce not consumed at the farmer’s household is taken to the market and adds additional value in transport, marketing, processing etc.Table 3 shows the value chains, which contributemost to the value adding process in the nine municipalities of the Lower Tocantins region. The most important product in terms of agricultural output value12 (R$ 956 million in 2011)is açaí,and it is the
one which makes the highest contribution to the regional value added in industry and commerce (R$ 458 million). This palm fruit is collected from the farmers and then transported to the market by numerous small traders (atravessadores) and afterwards processed by countless small açaíbeating units (batedores de açaí), besides some medium agro-industries. The second most important value chainin 2011 ispalm oil production, with an industrial value added in of R$ 31 million. It is followed by coconuts(R$ 28 million), where value is aggregated mainly in
the commercialization process, but also in the production of coco fiber.Manioc
only appears with a value added of R$ 12 million, but this does not include the
production of manioc flour, which is done almost exclusively by the farmers themselves. There are only few manioc flour plants (casas de farinha) in the region. This means that the distribution between agricultural output value and industrial value added would be quite different if all the transformation process of manioc
roots into flour was industrialized.
The last column of Table 3 shows the value added of the local β-sectors
in relation to agricultural output. In relative terms, the product which most
aggregates value isPará nut: thelocal exporting industry aggregates five times the
value which farmers generate. Nevertheless, absolute value added is small (R$ 1,1 million).Other local industries which aggregate a lot value in relative terms (but little in absolute terms), are palm hearts processing, rice mills, and sugar cane liquor (cachaça). The percentages of the other products where regional processing
industriesdo not existreflect the margins of the regional traders. These can be
quite high, up to 87% in the case of lemons.In total, the agricultural output of R$ 1144 million generates additional value added at the regional level of R$ 550 million. In other words, for each Real produced by the α-sectors, another 50Centavosare aggregated by the regionalβ-sectors.
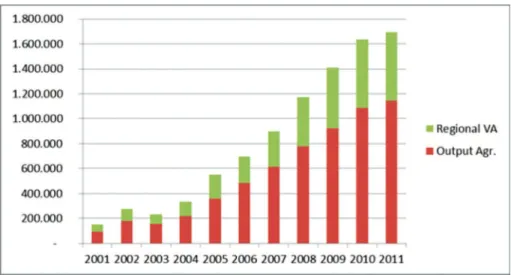
The regional value chains evolved quite dynamically during the decade 2001-2011, with the only exceptions of 2002-03, where growth rates were
12 We have no data available of agricultural value added. But, considering that the extractive
negative, see Diagram 1. The growth of agricultural output from R$ 94 million (2001) to R$ 1144 million (2011) was accompanied by an increase in regional value
added in the β-sectors from R$ 54 million to R$ 550 million. Together, they rose
from R$ 149 million to R$ 1695 million. This means that the regional economy has gained not only through higher agricultural output, but also through higher absolute mark-upsof R$ 497 million for the regional traders and processors. This highly dynamic process was dominated by the açaí economy, which accounted for 83% of total increase in agricultural output and regional value added.
Table 3 - Output of agricultural (α-) sector and regional value added (VA) of agro-industry and commerce (Reg. β-sectors), in millionR$,Lower Tocantins
region,2011
Source: Own data combined with IBGE (PAM, PEVS)and COSTA (2014)
The other sources of the value added growth in industry and commerce are mainlythree value chains: palm oil, whose value added increased by R$ 30
taking into account the exorbitant value added of açaí, this means that 43% of the growth of the other value chains is due to the palm oil industry situated in the municipality of Moju. This implies that the growth of the regional value added is not only geographically highly concentrated (in only one municipality), but also socially: in contrast to most of the other regional value chains, where numerous petty traders and small and medium industries dominate, the palm oil industry is
represented by one single national firm. It is also questionable if the value, which
is generated at the local level, remains there or if it is transferred to the national
level in the form of profits. This would mean that only the wage component of value added remains at the local level, and the local economy benefits much less
than expected (see ALONSO FRADEJAS; ALONZO; DÜRR, 2008).
Diagram 1 - Evolution of output of agriculture and regional value added between 2001-2011, in 1.000 R$, Lower Tocantins region
Source: Own data combined with IBGE (PAM, PEVS)and COSTA (2014)
The value chains which have their origin in the Lower Tocantins region also create wealth on the State level (Federal State of Pará) and on the national level. In 2011, they contributed with R$ 1142 million and R$ 947 million, respectively, to the State and national economy. Together, this is four times more than the R$ 550million of value added generated regionally. The main value chains which are important for the State of Paráeconomy are açaí(value added of R$ 1089 million), because the region is one of the major suppliers of the capital Belém,
(R$ 20 million), because of final consumption at the State level, and palm hearts
(R$ 7 million), because of its processing industries in Belém. The national value added is mainly due to selling of açaí (R$ 876 million), to cocoa processing and exporting (R$ 41 million)and topalm heart and palmoil commercialization (R$ 15 and R$ 11 million, respectively) to the national consumers.
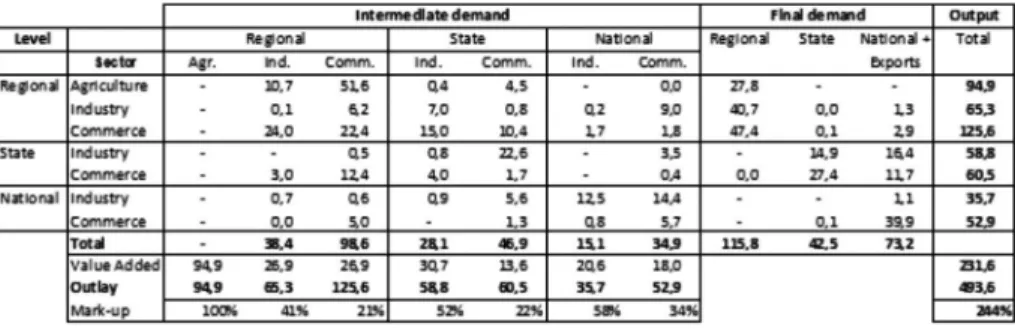
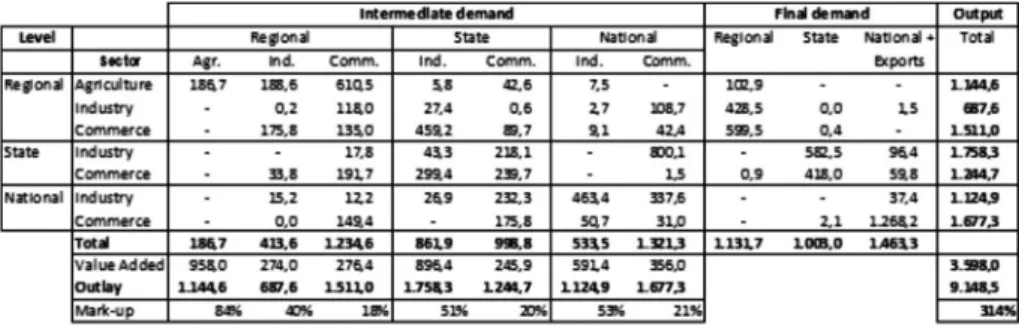
Finally, Table 4 and Table 5 present an aggregated Input-Output-Matrix for the twenty value chains of the Lower Tocantins region for the years2001 and 2011. Besides the intermediate demand, i.e., the inter-sectorial transactions,
the changes in the distribution of final demand can be observed: In 2001, the
total demand of R$ 232 million was divided between regional (R$ 116million or 50%), federal state (R$ 42 million or 18%) and national demand, including exports (R$ 73 million or 32%). In 2011, the total value has immensely increased (in real terms) to R$ 3598 million. The local market now only accounts for 31%
of final demand, whereas on the federal state level 28% and on the national level,
including exports, 41% of the regional products are sold. This means that the regional economy is strongly connected to the (inter-) national economy and that this dependency has risen drastically due to the expansion of the markets of açaí. The mark-ups of the regional, federal state and national industries range between 50%-60%, whereas the gross trade margins on the three levels are around 20-30%. Even if for some products, as we have seen above, trade margins can be excessively high; on the average, they are relatively modest, especially if considered that these are gross margins.13
Table 4 - Input-Output-Matrix for twenty value chains of Lower Tocantins region, in million R$, 2001
Source: Own data combined with IBGE (PAM, PEVS) and COSTA (2014)
13 As agricultural inputs were not taken into account, agricultural output equals its value added,
Table 5 - Input-Output-Matrix for twenty value chains of Lower Tocantins region, in million R$, 2011
Source: Own data combined with IBGE (PAM, PEVS) andCOSTA (2014)
CONCLUSIONS
The analysis of the structure and evolution of the value chains of an Amazonian region like the Lower Tocantins can give some hints on the potentials, risks and challenges for their rural development process. The different value chains include different actors who aggregate value at different levels. Local agriculture and extractive productions form the basis for value aggregation activities in industry and commerce. Some products like açaíor manioc are not only important for agricultural production, but they also contribute considerably to the regional economy by their transportation, processing and marketing activities. Other products, like Pará nuts or rice, have a high potential for value adding which is not used because of the small production basis of the region. Export products like cocoa or pepper contribute considerably to value added at the federal state and national level. In general, while some of the Amazonian products are enriching mainly national and international agents, this does not mean that they cannot generate wealth and development at local level.
national and international demand is or will be sufficient to absorb the increase
in açaí production, if the plantation techniques are adapted to the ecological conditions of the region (for example, by using agro-forestry systems) and if theses plantations are managed by family agriculture or if big açaíplantations are already expanding in the region at the expense of smallholdings.
The price hikes experienced by most of the products, basic food as well as commodities, resulted in additional gains for the farmers and the intermediaries. The combination of both price increases at the local, national and international level caused these positive developments. Although there is no guarantee that prices will remain at high levels. Especially commodity prices are prone to instability. For example, the price increase for pepper for the period 2001-2011 of more than 250% raised agricultural output by R$ 24 million, but a similar reduction in prices would hit the regional economy nowadays (considering the higher pepper production) by R$ 34 million. The region is dependent on (inter-)
national markets, as 40% of final demand consists of national consumption
and exports.Nevertheless, it seems that the price increases had a strong positive impact on the production of only few products likeaçaí, manioc and oil palms. Half of the studied products experienced no increase in their output volume, because yields and cultivated areas stagnated or were even reduced.
The gross trade margins on average are relatively modest, even if for some products, they seem to be excessively high, indicating exploitive behavior of the middlemen (INHETVIN, 2000). But, as these are gross margins, they also
reflect the costly and sometimes risky transportation and marketing services of
the traders. If the markets are competitive, and the farmers can negotiate with different traders, margins go down to “normal” levels. This may not be true for farmers who live far away from the markets in isolated areas, but is common where the traders compete with each other for the farmers’produce.
level, it has been argued in other studies (ALONSO FRADEJAS; ALONZO; DÜRR,2008) that only part (mainly the wages) of this locally created wealth remains on this level, but the biggest part is transferred to the national level in
form of profits of the agri-business owners. Therefore, it is highly questionable if the expansion of huge plantationswill benefit the region in social, ecological
and economic terms. The alternative is a socially inclusive, sustainable rural development based on the vast majority of family farms, by developing value adding activities at the local level, for example through processing of fruits or seeking niche markets for bio-diversity products like native palms. The additional resources that the price boom has granted to the region should be invested in order to diversify the agricultural systems; increase the yields of basic food like manioc; andupgrade the value chains.
As mentioned in the beginning, it is difficult to analyze the evolution
of a rural economy without up-to-date, reliable and consistent information on economic activities at the local level. With the limited data availability in mind, this paper has tried to outline some general trends of the economic development in an Amazonian region. Other Amazonian regions might face quite different developments, but all of them require reliable, updated information as a solid basis on which decisions of the local, regional and national actors can be made.
REFERENCES
ALONSO FRADEJAS, Alberto; ALONZO, Fernando; DÜRR, Jochen. Caña de azúcar y palma africana: combustibles para un nuevo ciclo de acumulación y dominio
en Guatemala. Guatemala: IDEAR/CONGCOOP, 2008.
COSTA, Francisco de Assis. Corporations and local economies in the Brazilian Amazon: the impacts of the mining sectors scheduled investments in Southeastern Pará (2004-2012). Applied Economics, v.44, n. 10, p. 1285-1302, 2012.
A dinâmica da economia de base agrária do Pólo Marabá (1995-2000): Uma
aplicação da metodologia de Contas Sociais Ascendentes (CSα). Novos Cadernos
NAEA, Belém, v. 5, n.1, p. 35-71, 2002.
(Ed.). A Economia do Açaí no Pará: Exercícios para gestão territorial e
planejamento do desenvolvimento na Amazônia. UFPA/NAEA, Belém, 2014.
Texto submetido à Revista em 17.04.2014 Aceito para publicação em 20.09.2014 DÜRR, Jochen; COSTA, Francisco de Assis. Cadeias produtivas de base agrária e desenvolvimento regional: o caso da região do baixo Tocantins. Revista Amazônia Ciência & Desenvolvimento,Belém, v. 3, n. 6,p. 55-92, 2008.
HADDAD, Paulo Roberto.Contabilidade Social e Economia Regional: análise de insumo-produto. Rio de Janeiro: Zahar, 1976.
HOMMA, Alfredo Kingo Oyama; NOGUEIRA, Oscar Lameira; MENEZES, Antônio José Elias Amorim de; CARVALHO, José Edmar Urano de; NICOLI, Clarisse Maia
Lana; MATOS, Grimoaldo Bandeira de. Açaí: novos desafios e tendências. Revista
Amazônia Ciência & Desenvolvimento, Belém, v. 1, n. 2, p. 7-24, 2006.
Instituto de Desenvolvimento Econômico, Social e Ambiental do Pará (IDESP). Cadeias de Comercialização de Produtos Florestais não Madeireiros na Região de Integração Tocantins, Estado do Pará - Relatório técnico. Belém, 2012.
Instituto Brasileiro de Geografia e Estatística (IBGE).Produção Agrícola Municipal
(PAM)2001-2011. Rio de Janeiro, 2011. Disponível em: <http://www.sidra.ibge.gov.br/
bda/acervo/acervo2.asp?e=v&p=PA&z=t&o=11> Acesso em: 5 jun. 2013.
. Produção da Extração Vegetal e da Silvicultura (PEVS)2001-2011. Rio
de Janeiro, 2011. Disponível em: <http://www.sidra.ibge.gov.br/bda/acervo/acervo1. asp?e=v&t=1&p=VS&z=t&o=3> Acesso em: 15 jun. 2013.
. Índice Nacional de Preços ao Consumidor Amplo Especial (IPCAE)2001-2010.
Rio de Janeiro, 2010. Disponível em: <http://www.sidra.ibge.gov.br/bda/acervo/ acervo1.asp?ti=1&tf=99999&e=c&t=9&p=IG&v=75&z=t&o=3> Acesso em: 20 jun.
2013.
. CensoDemográfico 2010.Rio de Janeiro, 2010. Disponível em: <http://www.
ibge.gov.br/home/estatistica/populacao/censo2010/> Acesso em: 20 jun.2013
. Censo Agropecuário 2006. Rio de Janeiro, 2006. Disponível em: <http://
www.sidra.ibge.gov.br/bda/acervo/acervo1.asp?e=v&t=1&p=CA&z=t&o=3> Acesso
em: 10 jun. 2013
INHETVIN, Tomas.Produção camponesa e redes mercantis. In: COSTA, F. de A. Agricultura familiar em transformação no Nordeste Paraense: o caso de Capitão
Poço.Belém: NAEA/UFPA,p.155-272, 2000.
LEONTIEF, Wassily. A economia do Insumo-Produto. Abril Cultural, São Paulo, 1983.