Efect of La Doping on the Crystal Structure, Electric, Magnetic and Morphologic
Properties of the BSCCO System
Vivian Delmute Rodriguesa, Gisele Aparecida de Souzaa, Claudio Luiz Carvalhoa, Rafael Zadorosnya*
Received: Octuber 6, 2016; Revised: June 26, 2017; Accepted: July 7, 2017
Studies of the doping process can provide a better understanding of the superconducting mechanisms in cuprous oxide materials. In this work, we studied the doping efects on the crystal structure, electric, morphologic and magnetic properties of the BSCCO system with the nominal composition Bi1.6Pb0.4Sr(2-x)RExCa2Cu3O(10-δ). Here, the rare earth element (RE) was replaced by La in the sites of
Sr. The x was ranged from 0.0 to 2.0, in steps of 0.5. The samples were prepared based on Pechini’s method. The resulting powder was pressed at room temperature and the pellets were submitted to several heat treatments. The characterizations conirm the La in the sites of Sr however; the superconducting properties of the sample were not improved.
Keywords: Doping, La, BSCCO, superconductivity.
* e-mail: [email protected]
1. Introduction
Since the discovery of the superconducting copper-oxides, the doping or the substitution processes have been used to improve some of their properties as the critical current density1-3 and some applications4,5.
BSCCO (Bi-Sr-Ca-Cu-O) is one of the most studied superconducting systems. The TCs of such system ranged from 7 K to 110 K and are directly related to the four possible superconducting phases, i.e., Bi2Sr2CuO6 (Bi-2201), Bi2Sr2CaCu2O8 (Bi-2212), Bi2Sr2Ca2Cu3O10 (Bi-2223) and Bi2Sr2Ca3Cu4O12 (Bi-2234)2,6-8. Some goals of the BSCCO
system are: (i) more acceptable, ecologically speaking, when compared with systems that have Tl and Hg in their compositions; (ii) presents a high critical current density and (iii) the HC2 is higher than of the other systems. All these features make such material promising for future applications6,7.
There are several studies that analyze various doping elements in diferent sites of BSCCO, such as rare earth elements4,9-18,23,27,29, oxides as the Cr
2O3
26, and some alkali
metals and transition elements (Na, Li, Ba, Zn, Y, V, Fe, Hg, Pb)1,6,9,19-22,24,25,28,29,30. Those studies have shown changes
in crystal structure, electric, morphologic and magnetic properties above a certain dopant content4,5,9-24,31.
However, the speciic methodologies used in the doping processes remain unclear. The doping with Pb in the Bi sites is often performed to obtain thermodynamic stability of the Bi-2223 phase, and some works suggest that the presence of Pb enhances the connections between grains1,9,25.
In this work, we studied the doping efects on the crystal structure, electric, magnetic and morphologic properties of the BSCCO system. The samples were prepared with nominal composition Bi1.6Pb0.4Sr2-xLaxCa2Cu3O10+δ, where the rare earth element lanthanum (La) was inserted into the Sr sites. The x parameter was ranged from 0 to 2.0 in steps of 0.5.
2. Material and Experimental Procedure
The precursor solutions were prepared based on the Pechini´s method29,32,33. The used reagents were: Bi
2CO5,
SrCO3, CaCO3, CuCO3.Cu(OH)2, 2PbCO3.Pb(OH)2 (Vetec), La2(CO3)3.H2O (Apache Chemicals), C6H8O7, HNO3, C2H8N2, and C2H6O2 (Vetec and Synth).
The metallic carbonates (MC) were dissolved in an aqueous solution of citric acid (C6H8O7) (CA) in a ratio of 3:1 (MC:CA). After that, a polyol, in this case, the ethylene glycol (C2H6O2) was added to obtain a better distribution of the cations in the polymeric structure. We used the proportion of 3:2 mol of ethylene glycol:citric acid and then, the solution was heated at 80ºC-90ºC to be dried. Consequently, heat treatments at 200ºC/10h, 400ºC/6h, 600ºC/6h, 800ºC/6h and 810ºC/68h, with a heating rate of 2ºC/min were done. The resulting powder was grounded at each heat treatment interval and then an amount of (1.2000±0.0001) g was separated and pressed uniaxially. The thickness of all pellets was (1.03±0.01) mm. The pellets were calcined in an air atmosphere at 810ºC/31h with a heating rate of 2ºC/min.
The samples were characterized by X-ray difraction (XRD) with Cuα radiation (λ= 1,542 Å). The measurements ranged from 2θ = 5º to 70º in steps of 0.2º. The dc four-probe method was used to the electric characterization (77K≤T≤300K). For the morphology characterization, it was used a scanning electron microscopy (SEM) coupled with an energy dispersive spectroscopy X-ray (EDX) detector. Ac magnetic susceptibility and Raman Spectroscopy (with excitation at λ = 514.5 nm) were also used. The samples were labeled as La(0), La(0.5), La(1.0), La(1.5) and La(2.0), according to the La content in the nominal composition.
3. Results and Discussion
Fig. 1 shows the XRD patterns for all samples. In the analysis it were used the follow references: JCPDS 80-2029 for Bi-2212, JCPDS 80-2030 and JCPDS 42-0450 for Bi-2223,
JCPDS 39-0283 for Bi-2201, JCPDS 50-0686 for (SrxCa2-x)
CuO3 and JCPDS 76-2128 for Ca2PbO4. We observed that
most of the La(0) peaks were due to Bi-2212 and Bi-2223 phases with some of them overlapped. We also observed the presence of other phases and sub products such as Bi-2201 and Ca2PbO4. All peaks related to Bi-2212 and Bi-2223 were indexed based on an orthorhombic symmetry.
and stability of the Bi-2223 phase can be modiied by the addition or substitution of elements with diferent ionic radius and bonding characteristics.
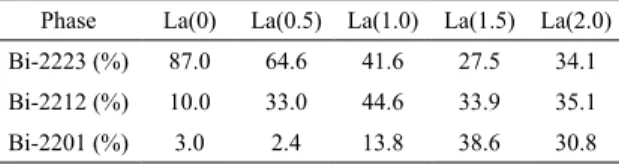
For a qualitative analysis, the relative volume fractions of Bi-[22(n-1)n] were estimated by Eq.(1), where [n= 1,2,3] indicates the phases 2201, 2212 and 2223. The peaks used in these calculations were chosen in the range of 2θ= 5-50º as done in the work of Taghipour et al.35.
(1)
Here, I is the intensity of the peaks of each phase. Table 1 shows the relative volume fractions. In general, the substitution of La in Sr sites increase the formation of the BSCCO phases, which are associated with the lower values of TC. We can also infer that the doping process with La avoids the formation of the Bi-2223 phase.
Figure 1. XRD of samples with diferent doping contents. The igure shows that the indexed peaks which are related to Bi-2212
and Bi-2223 superconducting phases. The subproducts were (#) Ca2PbO4, ($)(SrxCa2-x)CuO3 and (x)Bi-2201.
When compared with La(0), the La(0.5) did not show signiicant changes in its XRD with the presence of 2223 and 2212 phases. The other doped samples showed changes in the positions of the peaks when compared to the La(0) and La(0.5). For contents greater than x ≥ 1.0, the samples were indexed as containing mostly the Bi-2201 and Bi-2212 phases. The peaks near 7.3º and 25.7º are associated with the Bi-2201 phase. This suggests that as the dopant content is increased, it allows the formation of the lower TC phases such as Bi-2201 and Bi-2212, and not improve the stability of the Bi-2223 phase. According to Abbas et al. 34, the formation
%
Bi n n
I I I
I
22 1 100
Bi Bi Bi
Bi n n
2223 2212 2201
22 1 # . -+ +
-Q Q Q
V V V
! "
$ %
/
/
/
/
Table 1. Relative volume fractions of the Bi-2223, Bi-2212 and Bi-2201 phases for all fabricated samples.
Phase La(0) La(0.5) La(1.0) La(1.5) La(2.0)
Bi-2223 (%) 87.0 64.6 41.6 27.5 34.1
Bi-2212 (%) 10.0 33.0 44.6 33.9 35.1
Bi-2201 (%) 3.0 2.4 13.8 38.6 30.8
To obtain the lattice parameters, Eq. (2), we assumed an orthorhombic symmetry corresponding to the peaks
associated with Bi-2212 in the XRDs36:
(2)
Here h,k,l are the Miller indices; a, b and c are the lattice parameters and d is the distance between adjacent planes in the set (hkl)36. The (00l) directions were used to
calculate c, the (200) direction were used to obtain a, and (hkl) to calculate b. Fig. 2 shows the lattice parameters for all samples.
. d a h b k c l 1 2 2 2 2 2 2 2 = + +
The lattice parameter slightly increases in the doped
samples (comparing with La(0)). The parameter b also
increases, except for the La(1.0). The parameter c decreases for all doped samples, which suggests that La occupies the Sr site. Such conclusion is reasonable since the ionic radius of La (1.06 Å)10 is lower than that of the Sr (1.12 Å)10.
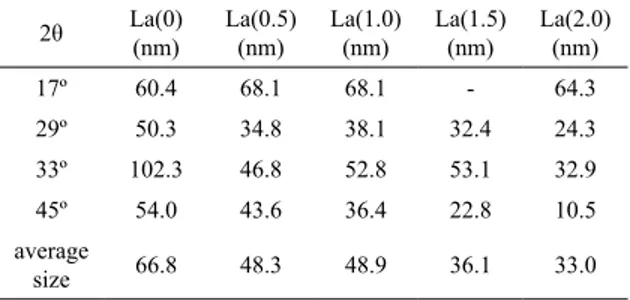
The inluence of La in the formation of crystallites is analyzed by calculating the typical sizes of these specimens by the Scherrer equation. Those analyses focused on the peaks around the positions 17º, 29º, 33º and 45º which are associated with the plans (006), (0010), (200) and (0210)/(2010), for the Bi-2212 and Bi-2223 phases, respectively. From Table 2 is evident that the average size of the crystallite of sample La(0) is greater than that one of the other samples. As the average size of the crystallites is related to the crystallinity of the sample, i.e., larger crystallites are associated with more crystalline materials36, the data suggests that the doping
process afects the morphology of the material.
sample presents more impurities than the undoped one, which is in agreement with the XRD analysis.
The semiconducting-like behavior of the other samples was observed in the range of temperatures that were studied. This was probably due to the insertion of a large amount of dopant in the crystalline structure of the material. Then, changes in the charge reservoir layers with the substitution of La3+ for Sr2+ is induced and consequently, the amount of
charge carriers in the superconducting planes is changed4.
This behavior is usually due to the insulator-metal transition which occurs with other rare earth dopant elements, e.g., Y5,
Gd12, Ho14 and Dy16 in the BSCCO system.
Fig. 4(a) and Fig. 4(b) show the IV curves of La(0) and La(0.5) samples, respectively. The measurements were carried out at 77K and the IC was determined by the 1μV/cm criterion. We considered the samples with a thickness of (1.03±0.01) mm and width of (4.00±0.01) mm. The distance between the voltage terminals was (2.00±0.01) mm. The IC is (5.5±0.1) mA and (1.1±0.1) mA, for La(0) and La(0.5) respectively. The related critical current density (JC) is (0.133±0.004) A/ cm2 for La(0) and (0.030±0.003) A/cm2 for La(0.5). These
values show that JC of La(0.5) is about four times lower than that for La(0). In Ref. 4 was shown that both JC and
TC can also be changed by reducing the charge carriers in the superconducting plans, i.e., substituting Sr2+ by La3+ the
number of holes in the CuO2 planes can change4. Thus, it is
observed that the increase of the dopant content degrades the superconducting properties of the samples.
Fig. 5 shows the scanning electron microscopy (SEM) micrographs of the samples. Fig. 5(a) shows large grains with
maximum dimensions of (12.8 x 13.2) μm2. The plate-like
morphology is characteristic of BSCCO systems. We also observed the presence of a bright area with a small amount of grains formed due to a possible partial melting during the sintering process. Fig. 5(b) shows a SEM micrograph of La(0.5), which presents a more homogeneous distribution of the grains when compared with the La(0) and with smaller
sizes of about (5.2x3.6) μm2.
Fig. 5(c) and (d) show the micrographs of La(1.0) and La(1.5), respectively. The size of the grains is smaller than those ones of the other samples, with dimensions of about (1.8
x 0.8) μm2 and (1.2x1.6) μm2, respectively. The micrograph
of La(2.0) in Fig. 5(e) shows the presence of larger plate-like grains than that exhibited by La(1.0) and La(1.5), however, with a smaller size than that of La(0) and La(0.5) [(2.4x1.6) μm2]. It was also observed that the grains sizes distribution
of La(0), La(0.5) and La(2.0) are also more homogeneous than the other samples.
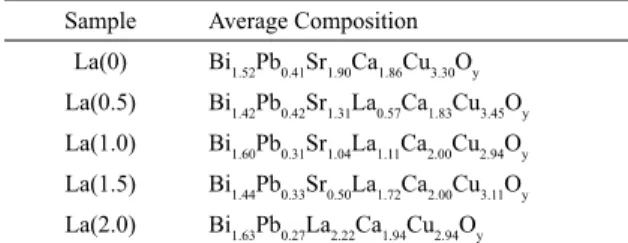
Table 4 shows the EDX of the samples. It is observed that some elements present slight changes when compared with the nominal composition Bi1.6Pb0.4Sr2-xRExCa2Cu3Oy. The nominal composition of Cu for La(0) and La(0.5) is about 10% and 15% greater than expected, respectively, as well as the composition of La for samples La(0.5), La(1.0), La(1.5)
Table 2. Size of crystallites estimated from the Scherrer’s equation.
It were used the peaks at 2θ =17º, 29º, 33º and 45º for which the
average sizes were evaluated.
2θ La(0) (nm) La(0.5) (nm) La(1.0) (nm) La(1.5) (nm) La(2.0) (nm)
17º 60.4 68.1 68.1 - 64.3
29º 50.3 34.8 38.1 32.4 24.3
33º 102.3 46.8 52.8 53.1 32.9
45º 54.0 43.6 36.4 22.8 10.5
average
size 66.8 48.3 48.9 36.1 33.0
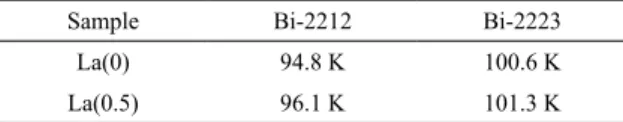
Fig. 3 shows the electric measurements of all samples. Both the La(0) and La(0.5) exhibit a superconducting transition, see in Fig. 3(a) to (c). The other samples exhibited a semiconductor-like behavior as shown in Fig. 3(d) to (f). La(0) presents two TCs at 94.8 K and 100.6 K, which correspond to Bi-2212 and Bi-2223 phases, respectively. The TCs of La(0.5) are 96.1 K and 101.3 K, which also correspond to Bi-2212 and Bi-2223 phases, respectively. The values of TCs were considered as the temperature at the maximum local of the dR/dT curves (Fig.3(b) and (c)). In Table 3 is shown the TCs values of all samples, where we can notice an improvement in the critical temperature of the sample La (0.5).
The transition width (ΔT) of La(0.5) is wider than that presented by La(0). In Fig. 3(b) and (c) are shown ΔT for La(0) and La(0.5) respectively. Those values were obtained in the half height of the peaks7 been 6.4 K for La(0.5) and
Figure 3. Electric measurements, RxT curves, using the dc four probe method of the samples: (a) La(0) and La(0.5), which present a superconducting transition; (b) and (c) are the (dR/dT)xT curves for the samples La(0) and La(0.5), respectively. The RxT curves of (d) La(1.0), (e) La(1.5) and (f) La(2.0), which exhibit a semiconducting-like behavior.
Table 3. Critical temperatures of the samples La(0) and La(0.5).
Sample Bi-2212 Bi-2223
La(0) 94.8 K 100.6 K
La(0.5) 96.1 K 101.3 K
and La(0.5), is about 14%, 11%, 15% and 11% greater than the nominal value, respectively. The Sr also presents deviations for La(1.0) and La(1.5) with values of about 13% and 15% greater than the expected ones. The nominal composition
of the Pb is 22%, 18% and 32% greater than expected for La(1.0), La(1.5) and La(2.0) respectively. These changes may be associated with the loss of Pb due to long sintering times. Such consideration is also applied to the Bi35. Note
that La3+ seems to enter in the sites of Sr2+ as the nominal
Figure 4. Voltage as a function of the electric current (IV curve) of (a) La(0) and (b)La(0.5). The dotted line shows the critical current (Ic) value.
Oe and 0.05 Oe and a frequency of 1 kHz. Two transitions are observed in that igure, the irst one close to 75 K and the second one around 57 K. The lower temperature indicates that the weak-links are completely broken, i.e., there are no intergranular currents. The transition at 75 K is associated with the intrinsic diamagnetic shielding of the grains due to intragranular currents37. We can note that for 0.05 Oe, the
second transition shifts to near 40 K and the irst transition is not afected by the excitation ield, which is a strong evidence that the second transition is related to the weak-links.
Fig. 6(b) shows the measurements of the La(0.5) sample, which exhibits a very degraded response in comparison with the response of La(0). We observed transitions at 7.1 K and 52.3 K, in the curve with the lowest excitation ield (0.01 Oe). For the larger ield (0.1Oe), the signal is smoother and the transition temperatures of the inter- and intragranular parts were observed at approximately 4.1 K and 57.0 K, respectively38. Those curves suggest that the superconducting
properties of the La(0) sample are better than of La(0.5). Comparing the ac susceptibility and the electric (RxT) measurements, we observed a large discrepancy between the values of TC. Typically, the values of TC as well as JC
are diferent for the electrical and magnetic measurements.
As the electric measurements are associated with the percolation of the transport currents by the surface grains, the magnetic measurements provide an average value of the whole sample38. The mismatch between electric and
magnetic measurements may be associated with the fabrication process of the samples, such as pressing the pellets, which can result in better contact between grains in the surface of the sample. The surface is also more sensitive to changes in the oxygen content, which causes a local degradation of the superconducting properties38.
Fig. 7 shows the Raman spectra of all samples in the range from 150 to 1300 cm-1. Raman spectroscopy is currently
used in the investigation of the phonons and other low-energy excitations in high TC superconductors38. There are many
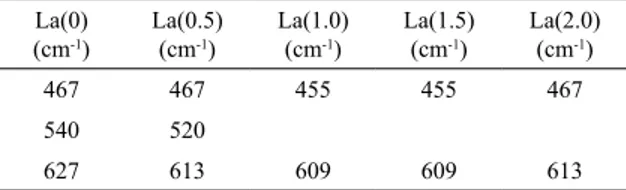
works reporting on the assignment of Raman vibrational modes, but these studies are still controversial39,40,41. Table 5
shows the Raman spectra modes observed. These Raman frequencies are very similar to the frequency shown in the studies of Osada et al.39 and Chen et al.41.
In Fig. 7 is noted changes in the characteristics peaks. As the dopant content increases, the peaks at 627 cm-1 shifted
of about 20 cm-1. We also observe a broadening of all the
peaks when compared with La(0), as shown in Table 5. In the studies of Refs.39 and41, the Raman modes at 460
cm-1 and 630 cm-1 can be associated with the vibrations of
O(3)BiA1g and O(2)SrA1g along the c axis for the Bi-2212 phase. The A1g modes are symmetric for vibrations of Bi, Sr, Ca, Cu, OBi, OSr and OCu in the c axis, as reported by Carvalho and Guedes40. It is noted that the samples analyzed
in this work exhibit similar behaviors to that one studied by Chen et al.41, i.e., there are shifts of the Raman mode
to lower values and the broadening of the peaks are due to the increasing of dopant contents. The study of Chen et al.41 suggests that such results are consequences of the
substitution of aliovalent ions in the sites of the Bi-2212 phase. Then, changes in the charge of around O(2)Sr, alter the Sr-O(2) bond39,41 and consequently the excess of oxygen
caused by this substitution. This result is in agreement with the XRDs and electric measurements. The peak at around 540 cm-1 for La(0) is not present in all samples. According
to Carvalho and Guedes40, the Raman mode in 530 cm-1 is
related to the Ca2PbO4, which is used to detect traces of this phase even for very small amounts of Pb. These peaks are more evident in La(0) and La(0.5).
4. Conclusion
Table 4. Composition of the diferent samples analyzed by EDX.
Sample Average Composition
La(0) Bi1.52Pb0.41Sr1.90Ca1.86Cu3.30Oy
La(0.5) Bi1.42Pb0.42Sr1.31La0.57Ca1.83Cu3.45Oy
La(1.0) Bi1.60Pb0.31Sr1.04La1.11Ca2.00Cu2.94Oy
La(1.5) Bi1.44Pb0.33Sr0.50La1.72Ca2.00Cu3.11Oy
La(2.0) Bi1.63Pb0.27La2.22Ca1.94Cu2.94Oy
Figure 5. SEM micrographs of (a) La(0), (b) La(0.5),(c) La(1.0), (d)La(1.5) and (e)La(2.0) samples. The presence of plate-like grains is characteristic of the superconducting BSCCO system. By increasing the dopant content the sizes of the grain exhibit a more homogeneous distribution.
also the change in the conduction plans of this system. Those factors were caused by the substitution of Sr divalent ions (Sr2+) by La trivalent ions (La3+).
5. Acknowledgments
Table 5. Raman modes of the undoped and doped samples. La(0)
(cm-1)
La(0.5) (cm-1)
La(1.0) (cm-1)
La(1.5) (cm-1)
La(2.0) (cm-1)
467 467 455 455 467
540 520
627 613 609 609 613
Figure 6. (a) AC susceptibility as a function of the temperature. (a)
La(0) under an excitation ield of 0.01 Oe and 0.05 Oe. (b) La(0.5) under an excitation ield of 0.01 Oe and 0.1 Oe.
Figure 7. Raman spectra of the undoped and doped samples.
6. References
1. Biju A, Guruswamy P, Syamaprasad U. Inluence of Pb on structural and superconducting properties of rare earth modiied
Bi2Sr2CaCu2Oy. Physica C: Superconductivity. 2007;466(1-2):23-28.
2. Bhattacharya RN, Paranthaman MP, eds. High Temperature Superconductivity. Weinheim: Wiley-VCH; 2010.
3. Kitazawa K. Superconductivity: 100th Anniversary of Its Discovery and Its Future. Japanese Journal of Applied Physics. 2012;51(1R):010001.
4. Biju A, Vinod K, Aloysius RP, Syamaprasad U. Improved superconducting properties by La addition in (Bi,Pb)-2212 bulk superconductor. Journal of Alloys and Compounds. 2007;431(1-2):49-55.
5. Sedky A, Al-Battat W. Efect of Y substitution at Ca site
on structural and superconducting properties of Bi:2212 superconductor. Physica B: Condensed Matter. 2013;410:227-232.
6. Owens FJ, Poole CP Jr. The New Superconductors. New York: Kluwer; 1996.
7. Poole CP Jr, Farach HA, Creswick RJ, Prozorov R. Superconductivity. 2nd ed. Amsterdam: Academic Press; 2007.
8. Matheis DP, Snyder RL. The Crystal Structures and Powder Difraction Patterns of the Bismuth and Thallium
Ruddlesden-Popper Copper Oxide Superconductors. Powder Difraction. 1990;5(1):8-25.
9. Lin R, Chen X, Chen Z, Qian Y. Principal Factors on Tce in pure Bi-Sr-Ca-Cu-O system. Solid State Communications. 1989;72(12):1173-1176.
10. Jin H, Kötzler J. Efect of La-doping on growth and superconductivity
of Bi-2212 crystals. Physica C: Superconductivity. 1999;325(3-4):153-158.
11. Mishra DR. Gd-substituted Bi-2223 superconductor. Pramana. 2008;70(3):535-541.
12. Biju A, Abhilash Kumar RG, Aloysius RP, Syamaprasad U. Structural and superconducting properties of Bi1.7Pb0.4Sr
2-xGdxCa1.1Cu2.1Oy system. Physica C: Superconductivity and
its Applications. 2006;449(2):109-115.
13. Sarun PM, Vinu S, Shabna P, Biju A, Syamaprasad U. Highly enhanced superconducting properties of Eu-doped (Bi,Pb)-2212.
Materials Letters. 2008;62(17-18):2725-2728.
14. Shabna R, Sarun PM, Vinu S, Syamaprasad U. Structural and eletrical properties of Bi1.7Pb0.4Sr2-xHoxCa1.1Cu2.1O8+δ system across the metal to insulator transition. Journal of Alloys and Compounds. 2009;481(1-2):797-801.
15. Biju A, Aloysius RP, Syamaprasad U. Structural and superconducting properties of Bi1.7Pb0.4Sr2−xYbxCa1.1Cu2.1Oy system. Materials Letters. 2007;61(3):648-654.
17. Biju A, Sarun PM, Aloysius RP, Syamaprasad U. Superconductivity
and lux pinning in Dy added (Bi,Pb)-2212 superconductor.
Superconductor Science and Technology. 2006;19(10):1023-1029.
18. Terzioglu C, Aydin H, Ozturk O, Bekiroglu E, Belenli I. The
inluence of Gd addition on microestruture and transport properties
of Bi-2223. Physica B: Condensed Matter. 2008;403(19-20):3354-3359.
19. Gul IH, Rehman MA, Ali M, Maqsood A. Efect of vanadium
and barium on the Bi-based (2223) superconductors. Physica C: Superconductivity and its Applications. 2005;432(1-2):71-80.
20. Matsumoto A, Kumakura H, Togano K. Hg doping efects on
synthesis, microstructure and superconducting properties of the Bi-2212 phase. Physica C: Superconductivity. 1999;319(1-2):34-40.
21. Khalil SM. Role of rare-earth Ba2+ doping in governing the superconducting and mechanical characteristics of Bi–Sr–Ca– Cu–O. Smart Materials and Structures. 2005;14(4):804-810.
22. Pignon B, Autret-Lambert C, Ruyter A, Decourt R, Bassat JM, Monot-Lafez I, et al. Study of the yttrium and zinc substitutions efects in Bi2Sr2CaCu2O8+δ compounds by transport measurements.
Physica C: Superconductivity. 2008;468(11-12):865-871.
23. Sedky A. On the inluence of rare-earth substitution for Ca in
Bi(Pb):2212 superconducting system. Physica C: Superconductivity and its Applications. 2008;468(14):1041-1046.
24. Sedky A. The impact of Y substitution on the 110 K high TC phase in a Bi (Pb):2223 superconductor. Journal of Physics and Chemistry of Solids. 2009;70(2):483-488.
25. Maeda H, Tagano K, eds. Bismuth-Based High-Temperature Superconductors. Boca Raton: CRC Press; 1996.
26. Abbasi H, Taghipour J, Sedghi H. Superconducting and transport properties of (Bi–Pb)–Sr–Ca–Cu–O with Cr2O3 additions.
Journal of Alloys and Compounds. 2010;494(1-2):305-308.
27. Biju A, Abhilash Kumar RG, Aloysius RP, Syamaprasad U.
Flux pinning properties of rare earth modiied (Bi, Pb)-2212
superconductors. Superconductor Science and Technology. 2006;19(8):854-859.
28. Fujiwara M, Nagae M, Kusano, Y, Fujii T, Takada J. Li doping to the 2212 phase in the Bi-Sr-Ca-Cu-O system. Physica C: Superconductivity. 1997;274(3-4):317-322.
29. Anis-ur-Rehman M, Mubeen M. Synthesis and enhancement of current density in cerium doped Bi(Pb)Sr(Ba)-2 2 2 3 high TC superconductor. Synthetic Metals. 2012;162(19-20):1769-1774.
30. Nane O, Özçelik B, Sotelo A, Madre MA. Efect of Na substitution
on superconducting properties of Bi-2212 ceramics prepared by Sinter-Forged process. Journal of the European Ceramic Society. 2017;37(3):1007-1012.
31. Kirat G, Kizilaslan O, Aksan MA. Efect of the Er-substitution
on-superconducting density in glass-ceramic Bi2Sr2Ca2(Cu
3-xErx)O10+δ superconducting system. Ceramics International. 2016;42(13):15072-15076.
32. Darsono N, Yoon D, Raju K. Efects of the Sintering Conditions
on the Structural Phase Evolution and TC of Bi1.6Pb0.4Sr2Ca2Cu3O7 Prepared Using the Citrate sol-gel Method. Journal of Superconductivity and Novel Magnetism. 2016;29(6):1491-1497.
33. Darsono N, Imaduddin A, Raju K, Yoon DH. Shynthesis and
Characterization of Bi1.6Pb0.4Sr2Ca2Cu3O7 Superconducting Oxide by High-Energy Milling. Journal of Superconductivity and Novel Magnetism. 2015;28(8):2259-2266.
34. Abbas MM, Abass LK, Salman U. Inluences of Sintering Time
on the TC of Bi2-xCuxPb0.3Sr2Ca2Cu3O10+δ High Temperature Superconductors. Energy Procedia. 2012;18:215-224.
35. Taghipour J, Abbasi H, Sedghi H. The efect of Sb substitution
on properties of Bi1.6Pb0.4Sr2-xSbxCa2Cu3Oy superconductors.
Physica B: Condensed Matter. 2010;405(5):1349-1352.
36. Cullity BD, Stock SR. Elements of X-Ray Difraction. London: Pearson; 2001.
37. Motta M. Inomogeneidades estruturais em amostras nanoscópicas de supercondutores de alta temperatura crítica. [Dissertation].
Bauru: Universidade Estadual Paulista Júlio de Mesquita Filho; 2009.
38. Rodrigues VD. Efeitos da dopagem nas propriedades elétricas do sistema supercondutor BSCCO com elemento terra rara.
[Dissertation]. Ilha Solteira: Universidade Estadual Paulista
Júlio de Mesquita Filho; 2011.
39. Osada M, Kakihana M, Käll M, Börjesson L, Inoue A, Yashima M. Raman-active phonons in Bi2Sr2-xLaxCuO6+d: Phonon
assignment and charge-redistribution efects. Physical Review B (Condensed Matter). 1997;56(5):2847-2851.
40. Carvalho CL, Guedes I. Spectroscopic characterization of
BPSCCO thin ilms grown by dip-coating technique. Physica C: Superconductivity. 2003;390(3):239-242.
41. Chen XH, Ruan KQ, Qian GG, Li SY, Cao LZ, Zou J, et al.
Efects of doping on phonon Raman scattering in the Bi-based