Ecology and Evolution. 2017;1–13. www.ecolevol.org
|
1 O R I G I N A L R E S E A R C HThe role of conservative versus innovative nesting behavior on
the 25- year population expansion of an avian predator
Andreia Dias
1,2| Luís Palma
2| Filipe Carvalho
3,4| Dora Neto
3| Joan Real
1|
Pedro Beja
2,5This is an open access article under the terms of the Creative Commons Attribution License, which permits use, distribution and reproduction in any medium, provided the original work is properly cited.
© 2017 The Authors. Ecology and Evolution published by John Wiley & Sons Ltd.
1Equip de Biologia de la Conservació, Departament de Biologia Evolutiv, Ecologia i Ciències Ambientals and Institut de la Recerca de la Biodiversitat (IRBIO), Universitat de Barcelona, Barcelona, Catalonia, Spain 2CIBIO/InBio-UP, Centro de Investigação em Biodiversidade e Recursos Genéticos, Universidade do Porto, Vairão, Portugal 3CIBIO/InBIO-UE, Centro de Investigação em Biodiversidade e Recursos Genéticos, Universidade de Évora, Évora, Portugal 4Department of Zoology and Entomology, School of Biological and Environmental Sciences, University of Fort Hare, Alice, South Africa 5CEABN/InBIO, Centro de Ecologia Aplicada “Professor Baeta Neves”, Instituto Superior de Agronomia, Universidade de Lisboa, Lisboa, Portugal Correspondence Pedro Beja, CIBIO/InBio-UP, Centro de Investigação em Biodiversidade e Recursos Genéticos, Universidade do Porto, Campus Agrário de Vairão, Vairão, Portugal. Email: [email protected] Funding information EDP - Energias de Portugal; Sociedade Portuguesa de Vida Selvagem
Abstract
Species ranges often change in relation to multiple environmental and demographic factors. Innovative behaviors may affect these changes by facilitating the use of novel habitats, although this idea has been little explored. Here, we investigate the impor-tance of behavior during range change, using a 25- year population expansion of Bonelli’s eagle in southern Portugal. This unique population is almost exclusively tree nesting, while all other populations in western Europe are predominantly cliff nesting. During 1991–2014, we surveyed nest sites and estimated the year when each breed-ing territory was established. We approximated the boundaries of 84 territories using Dirichlet tessellation and mapped topography, land cover, and the density of human infrastructures in buffers (250, 500, and 1,000 m) around nest and random sites. We then compared environmental conditions at matching nest and random sites within territories using conditional logistic regression, and used quantile regression to esti-mate trends in nesting habitats in relation to the year of territory establishment. Most nests (>85%, n = 197) were in eucalypts, maritime pines, and cork oaks. Nest sites were farther from the nests of neighboring territories than random points, and they were in areas with higher terrain roughness, lower cover by agricultural and built- up areas, and lower road and powerline densities. Nesting habitat selection varied little with year of territory establishment, although nesting in eucalypts increased, while cliff nesting and cork oak nesting, and terrain roughness declined. Our results suggest that the observed expansion of Bonelli’s eagles was facilitated by the tree nesting behavior, which allowed the colonization of areas without cliffs. However, all but a very few breeding pairs settled in habitats comparable to those of the initial popula-tion nucleus, suggesting that after an initial trigger possibly facilitated by tree nesting, the habitat selection remained largely conservative. Overall, our study supports recent calls to incorporate information on behavior for understanding and predicting species range shifts. K E Y W O R D S Aquila fasciata, behavioral innovation, conditional logistic regression, conservation, habitat selection, quantile regression, range expansion1 | INTRODUCTION
The geographic range of species is dynamic, often contracting, ex-panding, or otherwise changing its limits in relation to multiple en-vironmental and demographic drivers (Gaston, 2003). In general, it is expected that a species range will track changes in the geographic dis-tribution of favorable climates and habitats, under the constraints of dispersal limitation (Robillard, Coristine, Soares, & Kerr, 2015; Schloss, Nuñez, & Lawler, 2012; Sohl, 2014). This view has been used to fore-cast species range shifts in relation to climate and land use changes (Robillard et al., 2015; Schloss et al., 2012; Sohl, 2014) or to predict the ranges of exotic species introduced into new areas (Peterson, Papes, & Kluza, 2003; Veech, Small, & Baccus, 2011). Implicit within this idea, however, is that climatic and habitat niches are conserved during range shifts, which may not be warranted due for instance to evolutionary adaptations to changing conditions or the emergence of behaviors that facilitate the use of novel habitats (Broennimann et al., 2007; Van Dyck, 2012; Wright, Eberhard, Hobson, Avery, & Russello, 2010). Understanding these processes is essential to predict species responses to environmental changes (Lavergne, Mouquet, Thuiller, & Ronce, 2010). Behavioral innovations, defined as the ability of animals to invent new behaviors or adjust old behavior to new problems (Overington, Griffin, Sol, & Lefebvre, 2011; Sol, Sayol, Ducatez, & Lefebvre, 2016), may be particularly important during range expansion, when species are bound to face novel environmental conditions (Keith & Bull, 2017). For instance, species colonizing landscapes modified by humans often show behavioral adaptations such as changes in the timing of breeding, adjustments of diel activity patterns, and the use of new food sources and foraging strategies (Lowry, Lill, & Wong, 2013; Martínez- Abraín & Jiménez, 2016). Innovations in breed-ing habitats include, for instance, avian nestbreed-ing in human struc-tures such as houses and electric pylons, which permit overcoming scarcity of natural nesting substrates (Martínez- Abraín & Jiménez, 2016). Likewise, increasing behavioral tolerance toward humans is normally considered a prerequisite for a species to colonize urban habitats and other heavily disturbed areas (Lowry et al., 2013). Despite these benefits of innovation, however, animal behavior may often be conservative rather than innovative, thereby restricting or at least delaying range expansion into potentially suitable habitats (Keith & Bull, 2017; Sol et al., 2016). For instance, imprinting of young to natal habitat characteristics is judged to strongly constrain breeding habitat selection when individuals reach maturity (Davis & Stamps, 2004). Overall, therefore, it is likely that species colonizing new geographic areas should be strongly affected by conservative versus innovative behaviors, although long- term studies examining this topic are lacking. The Bonelli’s eagle (Aquila fasciata) in southern Portugal provides a valuable opportunity to examine the role of behavior during a long- term process of expansion. The Bonelli’s eagle is a medium/large bird of prey that is endangered in Europe, where it is largely confined to the Mediterranean region and its numbers have declined since the early 1980s (Hernández- Matías et al., 2013). In Western Europe, the
Bonelli’s eagle has a metapopulation- like structure with a source- sink dynamics, where the only growing populations are those of south-ern Spain and southern Portugal (Hernández- Matías et al., 2013). The population of southern Portugal is peculiar, because it is almost ex-clusively made up of tree nesting pairs (Figure 1) and is genetically divergent, whereas Bonelli’s eagle populations in northern Portugal and elsewhere in the Iberian Peninsula and France are largely dom- inated by cliff nesters and well- connected demographically and ge-netically (Hernández- Matías et al., 2013; Mira, Arnaud- Haond, Palma, Cancela, & Beja, 2013; Palma, Beja, & Sánchez, 2013). This population has been closely monitored during the past 25 years, while it grew from about 25 to at least 110 breeding pairs (Beja & Palma, 2008; Palma et al., 2013). The original nucleus was largely confined to the uplands of the extreme south of the country, where the landscape is dominated by forests and scrubland, and human population den- sity is low, while the current population occupies a much larger geo-graphic area with a wide range of habitats and human occupation patterns (Palma et al., 2013). Evidence from demographic modeling and genetics suggests that population growth was sustained by the intrinsic demography of the original nucleus, rather than immigration (Hernández- Matías et al., 2013; L. Palma and R. Godinho Unpublished Data). Presumably, tree nesting behavior had an important role in this expansion, by allowing new pairs to establish in cliffless areas in a wide range of landscape types (Palma et al., 2013). It is uncertain, how-ever, whether this expansion was associated with innovation in terms of new habitats occupied and increasing tolerance toward humans, or rather it was conservative by largely retaining the characteristics
F I G U R E 1 Bonelli’s eagle (Aquila fasciata) nest in a eucalyptus
tree, with one adult and two well grown chicks. Photograph by Joaquim Pedro Ferreira
of the original population nucleus in terms of nesting substrate and breeding habitats.
Here, we test these ideas by analyzing nesting habitat selec-tion by the Bonelli’s eagle, using territories established in southern Portugal from 1990 to 2014 and that were still active at the end of the study period. Specifically, we: (1) assessed the use of nesting substrates by the expanding population; (2) characterized environ-mental conditions within territories and around nests in terms of dominant habitat features and human occupation patterns; (3) quan-tified factors affecting nesting habitat selection within territories using conditional logistic regression; and used quantile regression to estimated trends in (4) nesting habitat conditions and in (5) the predictive ability of habitat selection models in relation to the year of territory occupation. If habitat selection was conservative, we ex-pected that nesting substrates and the habitats around nesting sites should not change in relation to the year of territory establishment. Also, there should be no trends in the predictive ability of the nest-ing habitat model in relation to territory age, as it was calibrated considering all the territories occupied during the 25- year study pe-riod. In contrast, if behavior was innovative, we would expect the occurrence of changes in some of these descriptors, including tem-poral trends in the mean nesting habitat characteristics, or temporal increases in the variability of such habitats at the population level. Results were used to discuss the importance of innovative versus conservative behavior for the conservation management of Bonelli’s eagles and other species of concern.
2 | METHODS
2.1 | Study area
The study was carried out in southern Portugal, encompassing an area of about 4 × 10⁴ km2. The climate is Mediterranean, with mean annualtemperature of ≈17°C, and mean annual precipitation ranging from ≈500 to ≈1,000 mm (IM/AEMet, 2011). The landscape is dominated by an extensive peneplain (200–450 m a.s.l.) punctuated by residual elevations and bordered on its southern and southwestern ends by low altitude (<900 m a.s.l.) uplands. Land cover is varied, but it includes vast areas occupied by irrigated and rainfed annual crops, permanent crops (e.g. vineyards and olive groves), cork oak (Quercus suber) and holm oak (Quercus rotundifolia) woodlands and agroforestry systems, Blue gum (Eucalyptus globulus) and pine (Pinus spp.) plantations, and scrublands of diverse structure and composition. Human density is low throughout much of the area, with most population concentrated along the coast and in urban centers in the hinterland.
2.2 | Study design
Bonelli’s eagles are nonmigratory birds of prey, living in pairs that oc- cupy exclusive territories, where there may be one or several alter-native nests (Hernández- Matías et al., 2013; and references therein). The study was based on a long- term survey (1991–2014) of these breeding pairs and their territories in southern Portugal. For eachterritory, we estimated the approximate year of first occupation by the breeding pair, and we tried to locate all its nests. In the field, we recorded whether each nest site was built on a cliff or in a tree, and in the latter case, we recorded the nest tree species. Habitats around nests (250- m, 500- m and 1,000- m radius buffers) and random sites (see below) were characterized using variables extracted from GIS layers. We considered three buffers, because factors operating at dif-ferent spatial scales may affect the selection of nesting habitats. The analysis of habitat selection was based on the comparison of habitat conditions at matching nest and random sites within territories. For each breeding pair, we retained in analysis all nests at >2,000 m from each other, to avoid overlapping buffers. For each group of nests at <2,000 m from each other, we retained the one used most frequently during the study period. Every nest site of each breeding pair was then matched with three points randomly located at >2,000 m from each other and from the nest site, within the corresponding territory boundary (Figure 2). The number of random points was a compro-mise between the need to avoid overlapping buffers, and to sample adequately the habitat available within each territory (e.g., Carvalho, Carvalho, Mira, & Beja, 2016). To avoid trivial results, random points falling within urban areas and water reservoirs were randomly relo- cated. To infer eventual behavioral changes during expansion, we es-timated temporal trends in the mean and in the variability of nesting habitat conditions.
2.3 | Bonelli’s eagle data
The methods used to collect comprehensive information on the breeding Bonelli’s eagle population in southern Portugal have been detailed elsewhere (e.g., Beja & Palma, 2008; Hernández- Matías et al., 2013; Palma, Beja, Pais, & Cancela da Fonseca, 2006; Palma et al., 2013). Briefly, we conducted surveys throughout the region during courtship, nest building and breeding to locate Bonelli’s eagle territories, focusing primarily on areas with poten-tially suitable habitats. In addition, surveys were directed toward areas with historical information on breeding sites, and areas with observations of individuals reported by other researchers and birdwatchers. Repeated observations of one or two adults or sub-adults within circumscribed areas were used to identify potentially breeding territories, which were then thoroughly surveyed until nests were found. A breeding territory was considered to be pre-sent in a given area when at least one nest was located, and there was at least one breeding attempt (i.e., at least nest building or repair) in at least 1 year. The year of territory establishment was estimated from a combination of information sources, including mainly the history and spatial pattern of Bonelli’s eagle observa-tions in the area, and enquiries to key informers such as shepherds and game managers. Frequently, estimates were made in terms of a likely time interval, for which we used the mid- point in subse-quent analysis. Breeding data were collected for the active nests located each year in each territory, based on observations carried out using binoculars and telescopes (20–60×) from a distance to minimize disturbance.
To match nest sites with random locations within the same ter-ritory, we defined the territory boundary of each breeding pair as an 8- km radius buffer around its central point, which was estimated as the geographic centre of all the nests of the breeding pair (Palma et al., 2006). When the centers of neighboring territories were at <16 km from each other, the territory boundaries were defined using Dirichlet tessellation (Schlicht, Valcu, & Kempenaers, 2014). These assumptions were similar to those taken in a previous study where we found a good matching between diets and food resources across territories (Palma et al., 2006), and they were based on home range data from satellite tracking of ten breeding adults in our study area (L. Palma, unpublished data). Therefore, we believe that these territories provided a reasonable approximation to select random points and thus estimate the habitats available to each breeding pair, although it does not account for eventual variations in territory sizes and shapes (e.g., Bosch, Real, Tintó, Zozaya, & Castell, 2010; Mure, 2003).
2.4 | Environmental variables
The buffers around nest sites and random points were character-ized from 15 variables reflecting topography, human disturbance, land cover, and potential intraspecific interactions (Table 1, Table S1), which were expected to influence Bonelli’s eagles (e.g., Carrascal & Seoane, 2008; Di Vittorio, Sarà & López-López, 2012; Muñoz & Real, 2013; Real, Bosch, Tintó, & Hernández- Matías, 2016). All variables were extracted on a GIS from digital thematic layers, using ArcMap 10.1. Topographic variables were estimated using a 25- m resolution digital elevation model (http://www.eea.europa.eu/dataand-maps/ data/eu-dem). For each buffer, we computed the means and standard deviations of elevation and slope of raster grid cells, and we estimated an index of ruggedness using the Vector Ruggedness Measure Tool (Sappington, Longshore, & Thompson, 2007). This index measures ter-rain ruggedness as the variation in three- dimensional orientation of grid cells within a neighborhood, effectively capturing variability in slope and aspect into a single measure (Sappington et al., 2007). The den-sity of paved roads was estimated using the Open Street Map (www. openstreetmap.org/copyright), and it was taken as a broad indicator of potential human disturbance. Distribution power lines were also taken as an indicator of potential disturbance because they are a source of mortality in Bonelli’s eagles (Real, Grande, Mañosa, & Sánchez- Zapata, 2001; Rollan, Real, Bosch, Tintó, & Hernández- Matías, 2010), and their density was estimated from electric network maps. Land cover was estimated using Portugal’s 2007 Land Cover Map with land cover classes aggregated in five main categories judged a priori to be the most relevant for Bonelli’s eagles nesting habitat selection (see Table 1 for details). We have used relatively broad habitat land cover classes, because they have changed less over time than more detailed catego-ries (ICNF, 2013), thereby reducing errors potentially associated with considering only a land cover map from 2007 to analyze habitat selec- tion from territories established between 1990 and 2014. We also es-timated the density of waterlines, because Bonelli’s eagles frequently nest along streams and gullies (Palma et al., 2013). Finally, we consid-ered the distance to the nearest nest of a different breeding territory, to account for the possibility of individuals avoiding sites because of their proximity to those occupied by neighboring breeding pairs.
2.5 | Data analysis
Prior to statistical analysis, skewed variables were transformed to approach normality and to reduce the influence of extreme values using the angular and logarithmic transformations (Table 1). All vari-ables were standardized to zero mean and unit variance, to enhance comparability of effect sizes (e.g., Schielzeth, 2010). Principal compo-nent analyses (PCA) of ecological variables were used to investigate multicollinearity and to describe dominant environmental gradients (Legendre & Legendre, 1998). Varimax normalized rotations were ap-plied to the set of principal components with eigenvalues >1, to obtain F I G U R E 2 Location of the study area in southern Portugal showing the Bonelli’s eagle breeding territories and nests considered in this study (1990–2014), and schematic representation of the study design (see text for details)
simpler and more interpretable gradients (Legendre & Legendre, 1998). Varimax rotated axes were then used in subsequent analysis, because they provide a reduced set of synthetic variables, which are orthogonal to each other and thus are not affected by multicollinear-ity. A separate PCA and varimax rotation was carried out for variables estimated in 250- , 500- , and 1000- m buffers, because we were inter-ested in modeling habitat selection in relation to scale- specific factors. We excluded the distance to the nearest nest from PCAs, because we were interested in estimating its unique effect and because pre-liminary analysis showed that it was uncorrelated with other variables. The factors influencing nest site selection were analyzed at each spatial scale by comparing nest site and random locations within territories, using conditional logistic regression (Duchesne, Fortin, & Courbin, 2010; Hosmer & Lemeshow, 2000). This analysis followed a match- control design framework, using a binomial variable coding the nest (1) vs. three random points (0), thereby creating a group “stratum” (e.g., Hosmer & Lemeshow, 2000). Model selection was based on the information theoretical approach of Burnham and Anderson (2002) using the Akaike Information Criterion (AICc) and the corresponding Akaike weights (wi). Candidate models were built based on all possible subsets of the ecological gradients obtained in the vPCA, including the null (i.e., without explanatory variables) and the full (i.e., with all explan-atory variables) models. Models were ranked according to their Akaike weights (wi ), and the average parameters and their unconditional stan-dard errors (SE) were estimated based on the 95% confidence set of models (Burnham & Anderson, 2002). The relative importance of each variable (ecological gradient) was judged based on the sum of Akaike weights of models where the variable was included (w+), and on the magnitude of the average model coefficient. Model fit was assessed with the pseudo R- squared of Tjur (2009), and model discrimination ability was assessed with the area under the remote operating charac- teristic curve (AUC; Fielding & Bell, 1997). These analyses were per-formed using the packages mclogit (Elff, 2013), MuMIn (Barton, 2013), and modEva (Barbosa, Brown, Jiménez- Valverde, & Real, 2014) for R 3.3.2 software (R Development Core Team 2016). The analysis of trends in nesting habitats was based on quantile regression, following the rationale outlined in Cade and Noon (2003). This approach was used because we were interested in assessing
Variable (unit) Code Description (transformation)
Topography
Elevation (m) ELMEN Elevation above sea level (DEM 25 m)—mean and standard deviation (log10)
ELSTD
Slope (°) SLMEN Slope—mean and standard deviation (log10) SLSTD
Ruggedness Index VRMEN Terrain ruggedness measured as the variation in three- dimensional orientation of grid cells within a neighborhood—mean and standard deviation (log10) VRSTD Human disturbance Paved road network (m/m2) DEPR Density of paved roads (Asin [√x])
Power line (m/m2) DEPL Density of High/Very High Tension (>60 kv) and Medium Tension (<60 Kv) power lines (Asin [√x]) Land cover
Artificial areas (%) EXAR Proportion of artificial areas (urban areas, industrial, commercial and industrial units, mine, dump and construction sites, artificial nonagricultural vegetated areas) (Asin [√x])
Agricultural areas (%) EXAG Proportion of heterogeneous agricultural areas, permanent pastures and crops, arable land and rice fields (Asin[√x])
Forests (%) EXFO Proportion of forests (broad leaved forests, coniferous forests, mixed forests) (Asin [√x]) Open forests (%) EXOF Proportion of open forests, shrubs, herbaceous
vegetation, and open spaces with little or no vegetation (Asin [√x])
Water bodies (%) EXWA Proportion of water bodies (e.g., reservoirs, lagoons) and wetlands (Asin [√x])
Waterline (m/m2) DEWL Density of waterlines (Asin [√x])
Intraspecific relationship
Distance to nest (m) DIBN Distance to the nearest Bonelli’s eagle nest (log10) T A B L E 1 Variables used to analyze the
environmental correlates of nesting site selection by the Bonelli’s eagle in southern Portugal
changes over time in the mean (median) habitat conditions used by breeding pairs, but also in whether variability in nesting habitats in-creased over time due for instance to a few pairs settling in unusual habitats. In quantile regression, the latter hypothesis may be tested by examining temporal rates of change in quantiles near the maximum (e.g., 95% quantile) or the minimum (e.g., 5%), response. Increases in variability of habitat conditions may be inferred when the absolute value of the slopes estimated for extreme quantiles is significantly larger than that estimated for the median response. The analyses focused on the relations between nesting habitat characteristics de-scribed using the PCA axis and the first year of territory occupation. Also, we estimated relations between the prediction errors of the habitat model and the year of territory establishment, assuming that changes in behavior would lead to temporal changes in the median or in the variability of the prediction errors, or both. Model prediction errors were computed for nest sites as one minus the model predicted probability that a site was a nest site. Analysis was carried out at the level of breeding territories by averaging variables across all nest sites within each territory. Separate analyses were made for the three spa-tial extents used in this study (i.e., 250, 500, and 1,000 m). We es-timated the temporal trend of the response variables using ordinary least squares, and we then estimated trends in the quantiles from 5% to 95% at 5% intervals. For each coefficient of the quantile regres-sion, we computed the 90% confidence intervals based on inverting a quantile rankscore test (Cade & Noon, 2003). We also compare the slopes of the regression coefficients of the 5% and 95% quantiles with those of the median, using an ANOVA function for quantile regression fits based on the Wilcoxon score (Koenker et al., 2016). In trend anal-ysis, all territories estimated to be present before the beginning of the study in 1991 were assigned to 1990 as the year of establishment. These analyses were performed using the package quantreg (Koenker et al., 2016), and results were visualized using ggplot2 (Wickham & Chang, 2016), for R 3.3.2 software (R Development Core Team 2016).
3 | RESULTS
3.1 | Bonelli’s eagle nests and nesting population
We estimated the approximate boundaries of 84 Bonelli’s eagle ter-ritories from 197 nests (mean number of nests per territory [±SD, range] = 2.3 ± 1.4, 1–8) detected during the study period (Figure 2). The eagle population in southern Portugal before 1991 was estimated at 25 territories (29.8% of the total studied). For the territories es- tablished after 1990 (n = 59), the mean (±SD) estimated year of es-tablishment was 2004 ± 5.7 years (1992–2012). From all the nests recorded, only 11 (5.6%) were on cliffs, whereas the others (n = 186) were in Eucalyptus globulus (36.5%), Pinus pinaster (18.8%), E.
camaldu-lensis (15.2%), Quercus suber (14.7%), Pinus radiata (7.1%), Pinus pinea
(1.5%), and Populus nigra (0.5%). There was a significant tendency (chi- squared = 4.80, p = .030) for the initial territories (<1991) having a higher proportion of nests on cliffs (4.1%) than more recent territories (1.6%). There were also significant differences between periods in the species of nest tree used (chi- squared = 31.4, p < .001), mainly due to
a higher use of E. camaldulensis (24.6% vs. 2.8%) and a lower use of
Q. suber (7.0% vs. 29.2%) in the second period.
3.2 | Nesting habitat selection
At each spatial scale, the principal component analysis with varimax rotation extracted four dominant environmental gradients that ac-counted for 68%–74% of total variance in the data and that were largely consistent across scales (Table 2). The dominant gradient (PC1; 36%–38% of variance) was largely related to terrain ruggedness, reflecting a joint increase in mean and standard deviation of slope, standard deviation of elevation and index of ruggedness, and a decline in agricultural land cover. The second gradient was related to human infrastructures (PC2; 12%–17%), showing a joint increase in cover by artificial areas, and in paved roads and powerline densities. The third gradient (PC3; 11%) contrasted areas at higher elevation with lowland areas with more waterlines and waterbodies. Finally, the fourth gradi-ent was mostly related to the increase in forest cover (PC4; 8%–9%), showing a contrast between open and closed woodland at the two smaller spatial scales. The model selection and averaging procedure yielded conditional logistic regression models that were very similar at the three spatial scales considered, consistently showing that within territory bound- aries the Bonelli’s eagle nests were located in areas with higher ter-rain ruggedness and lower agricultural cover (PC1), and less human infrastructures (PC2) than random sites (Tables 3 and S2). Also, nests were farther than random points from the nearest nest of a neigh-bor territory. Support for the negative effect of elevation (PC3) and the positive effect of forest cover (PC4) was moderate at the 1,000- m scale (Akaike weights > 0.8), but it was weak at lower scales. The T- Jur coefficients showed that the models at the three spatial scales had a reasonable fit to the data (0.635–0.655), while the AUCs indicated high model discrimination ability (0.946–0.955).
3.3 | Temporal trends
Considering the variables most related to nesting site selection (Table 3), there was a very marked tendency for mean and median terrain ruggedness (PC1) to decline in relation to the estimated year of territory occupation at all spatial scales (Table 4). A similar trend was found for most quantiles at all spatial scales, with no significant differ-ences among slopes (ANOVA, p > .05), thus suggesting that variability in ruggedness among territories did not change over time (Figures 3 and S1–S5). In contrast, there was no trend in the mean amount of human infrastructures around nests (PC2) in relation to the year of territory establishment, although the median significantly declined at the 250- m scale (Table 4, Figures 3 and S1–S5). There was also some evidence for increasing variability in more recent territories, as under-lined by the contrast between the negative slopes estimated for the lower quantiles (5% and 25%) and the positive slope for the upper quantile (95%), particularly at the 1,000- m scale. It should be noted, however, that variation among slopes was not significant (ANOVA,
by a few recent territories with an unusually high amount of human infrastructures around nests (Figures 3, S1 and S2). Regarding the distance to the nearest nest of a neighbor territory, there were no significant trends in the mean or in any quantile, although there were a few recent territories where nests were unusually distant from their nearest neighbors (Table 4, Figures 3 and S1–S5). Considering the less influential variables, there was a tendency for the mean and median (except at 250- m scale) elevation (PC3), and the median (only at the 1,000- m scale) of forest cover (PC4), declining in more recent ter-ritories, with no significant differences (ANOVA, p > .05) among the slopes of different quantiles. There was also no evidence for model prediction error varying in relation to the year of territory establish-ment (Table 4). It is noteworthy, however, that the highest prediction errors were found in a few recent territories (Figures 3, S1 and S2).
4 | DISCUSSION
Our results suggest that during the 25- year expansion of Bonelli’s eagles in southern Portugal, the nesting habitat characteristics and
selection patterns remained very similar to those of the initial popula-tion nucleus, albeit with some changes over time. In terms of nest substrate, the tree nesting behavior typical of the initial nucleus was not only retained but even amplified over time, although with some variation in the trees most used. In terms of habitats, nests were con-sistently located in areas with relatively high terrain ruggedness, low cover by both agricultural land and human infrastructures, and away from conspecific nests in neighboring territories. The main temporal change was a decline in terrain ruggedness around nests in more re-cent territories, although they were still located within the most rugged areas available within each territory. Mean cover by human infrastruc-tures was little affected by territory age, although variability appeared to be somewhat higher in more recent territories, particularly due to the presence of a few territories with unusually high infrastructure cover around nests. Also, a few recent territories appeared to have an unusual pattern of nesting site selection, as suggested by particularly high model prediction errors. Overall, these results suggest that an initial uncommon behavior, tree nesting, may have triggered the abil-ity of this Bonelli’s eagle population to colonize vast areas without suitable cliffs for nesting. However, during the subsequent population T A B L E 2 Scores of habitat variables used to characterize nesting habitats of the Bonelli’s eagle in southern Portugal, on the axis (PC#) extracted through a principal component analysis (PCAs) with varimax rotation. Separate PCAs were performed for variables extracted at three spatial scales. We provide the proportion of variance accounted for by each axis extracted in each PCA Variables 250 m 500 m 1,000 m PC1 PC2 PC3 PC4 PC1 PC2 PC3 PC4 PC1 PC2 PC3 PC4 Mean slope 0.95 0.96 0.96 Standard deviation of slope 0.95 0.96 0.97 Ruggedness 0.94 0.94 0.95 Standard deviation of ruggedness 0.90 0.91 0.92 Standard deviation of elevation 0.90 0.91 0.90 Agricultural areas −0.75 −0.75 −0,79 Open forests −0.81 0.55 −0.77 0.59 Paved road density 0.81 0.84 0.90 Artificial areas 0.74 0.74 0.84 Power line density 0.60 0.78 0.83 Mean elevation 0.73 0.74 0.71 Waterline density −0.54 −0.51 −0.56 Water bodies −0.81 −0.83 −0.85 Forests 0.76 0.77 0.78 % Explained variance 36 12 11 9 37 14 11 9 38 17 11 8
expansion, the selection of habitats appeared to be dominantly con-servative rather than innovative, although rare unusual behaviors may have started to emerge in recent years.
The interpretation of our results requires due consideration of study design and data analysis approaches, which differed to some extent from other studies on Bonelli’s eagle habitat selection. First, our study was conducted at relatively detailed spatial scales, with variables measured at most within 1 km from nests, whereas several other studies considered larger buffers (e.g., Carrete, Sánchez- Zapata, Martínez, Sánchez, & Calvo, 2002; Di Vittorio, Sara, & López- López, 2012; Gil Sánchez, Molino Garrido, & Valenzuela Serrano, 1996) or evaluated species presence/absence using 10 × 10 km squares (e.g., Carrascal & Seoane, 2008; Di Vittorio et al., 2012; Muñoz, Márquez, & Real, 2013; Real et al., 2016). This is important because different aspects of Bonelli’s eagle habitat selection may become apparent at different spatial scales (López- López, García- Ripollés, Aguilar, García- López, & Verdejo, 2006; Muñoz & Real, 2013; Real et al., 2016), with studies at smaller scales such as ours probably showing the require-ments associated with nest sites, and studies at larger spatial scales probably revealing a combination of nesting and foraging habitat re- quirements. Second, our analysis was based on conditional logistic re-gression, matching nesting site conditions with those available within territories, whereas all other studies used unmatched comparisons between sites with and without Bonelli’s eagles. This may affect re- sults, because conditional regression identifies what is selected con-sidering local availability, and so it is able to reveal selection patterns that might be difficult to discern otherwise (e.g., Carvalho et al., 2016; Duchesne et al., 2010). Finally, our study introduced a temporal di-mension to habitat selection patterns that had never been considered before. Although we could not incorporate actual temporal changes in habitat composition due to lack of detailed data, we believe that our approach based on comparisons of current conditions in relation to the year of territory establishment provided a first approximation to how nesting habitat characteristics and selection patterns changed over time. We believe this assumption is reasonable, because the main variables used to characterize Bonelli’s eagle habitats have either remained unchanged (e.g., elevation, ruggedness), or they likely var-ied little over time. In particular, the area occupied by the broad land cover categories used in our study has remained largely stable within Bonelli’s eagle territories, as for instance the growth in urban areas and associated infrastructures has been mostly concentrated in a nar-row fringe along the coast (Freire, Santos, & Tenedório, 2009), while cover by agriculture and forest areas has remained essentially constant in rural areas of southern Portugal (Godinho et al., 2016; ICNF, 2013). Estimates of the year of territory establishment were associated with some uncertainties, which may have introduced noise in the data but we believe this is unlikely to have biased trends in selection patterns relative to territory age. Reasons for the association of Bonelli’s eagle nesting sites to the most rugged areas within territories may be related to the presence of suitable nesting trees and to less human disturbance (Palma et al., 2013; Real et al., 2016). For instance, large eucalypts are among the most used nest trees and they are most often found along waterlines at the bottom of valleys (Palma et al., 2013), which may be one of the factors attracting the eagles to rougher terrain. Also, rugged areas are probably less affected by forest management operations such as un-derstory clearing for fire prevention (Real et al., 2016; Santana, Porto, Reino, & Beja, 2011) and they may be less often crossed by people. Whatever the reasons for the observed pattern, it is noteworthy that breeding habitat selection of tree nesting Bonelli’s eagles in Cyprus was also affected by local topography and the availability of suitable nesting trees away from disturbance (Kassinis, 2010). Cliff nesting Bonelli’s eagles also seem to prefer areas with high terrain ruggedness, which seems to reflect the availability of suitable cliffs for nesting (Di Vittorio et al., 2012; Gil Sánchez et al., 1996; López- López et al., 2006; Real et al., 2016). Overall, therefore, the preference for nesting T A B L E 3 Average models describing the estimated effects of explanatory variables on the nesting area selection of tree nesting Bonelli′s eagle at three spatial scales: 250, 500, and 1,000 m. For each case, multimodel averaging was based on the 95% confidence set of models. For each variable, we show the standardized regression coefficient (β), the unconditional standard errors (SE), the 95% confidence interval of coefficient estimate (CI), and the selection probability (w+). Coefficient estimates whose 95% CI exclude zero are in bold Variables β SE CI ω+ Buffer: 250 m Terrain ruggedness (PC1) 2.199 0.640 0.944, 3.455 1.000 Human infrastructures (PC2) −3.845 1.555 −6.893, −0.797 1.000 Elevation (PC3) −0.707 0.533 −1.752, 0.337 0.490 Forests (PC4) 0.529 0.533 −0.516, 1.575 0.380 Distance to nest 4.626 1.157 2.357, 6.895 1.000 Buffer: 500 m Terrain ruggedness (PC1) 1.782 0.599 0.606, 2.957 1.000 Human infrastructures (PC2) −1,495 0.629 −2.728, −0.261 1.000 Elevation (PC3) −0.891 0.458 −1.789, 0.006 0.670 Forests (PC4) 0.607 0.454 −0.283, 1.49 0.490 Distance to nest 4.336 1.088 2.203, 6.469 1.000 Buffer: 1,000 m Terrain ruggedness (PC1) 2.550 0.965 0.659, 4.442 1.000 Human infrastructures (PC2) −1.833 0.956 −3.709, 0.041 1.000 Elevation (PC3) −1.143 0.592 −2.304, 0.017 0.800 Forests (PC4) 1.153 0.600 −0.023, 2.330 0.890 Distance to nest 5.240 1.480 2.338, 8.142 1.000
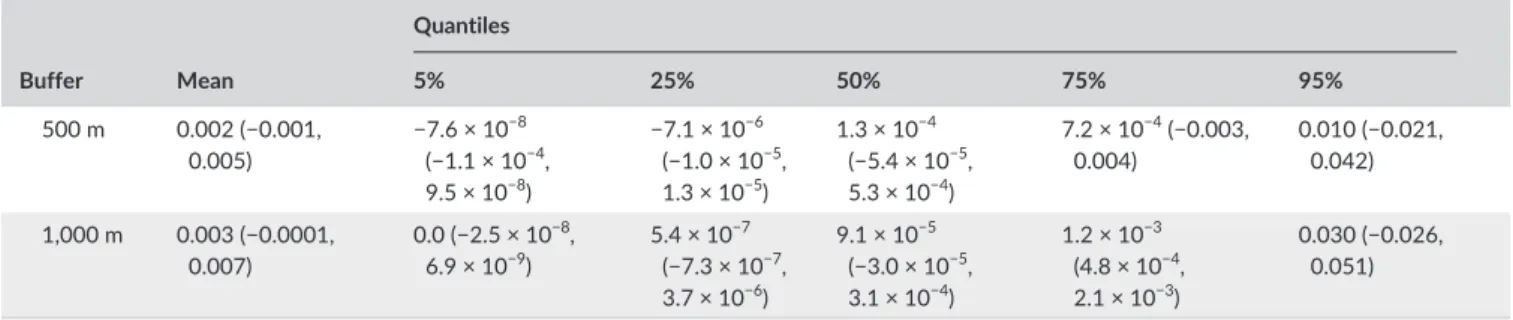
T A B L E 4 Trends in habitats conditions around Bonelli’s eagle nesting sites (250- , 500- , and 1,000- m buffers) in relation to the year of territory establishment. Trends were estimated with both ordinary least squares regression (Mean) and quantile regression (Quantiles), considering the habitat gradients extracted from a principal component analysis (PC#), the distances to the nearest nest from a neighboring territory, and the prediction error of the habitat model. In each case, we provide the slope of the relation, and its 90% confidence interval. Coefficients with confidence interval excluding zero are in bold Buffer Mean Quantiles 5% 25% 50% 75% 95% Terrain ruggedness (PC1) 250 m −0.044 (−0.062, −0.026) −0.047 (−0.087, 0.002) −0.061 (−0.082, −0.017) −0.056 (−0.065, −0.035) −0.023 (−0.051, −0.021) −0.046 (−0.061, −0.009) 500 m −0.047 (−0.064, −0.030) −0.053 (−0.073, 0.002) −0.064 (−0.081, −0.026) −0.052 (−0.068, −0.035) −0.033 (−0.058, −0.02) −0.031 (−0.062, 0.008) 1,000 m −0.046 (−0.063, −0.029) −0.053 (−0.079, −0.006) −0.062 (−0.079, −0.03) −0.052 (−0.066, −0.025) −0.044 (−0.059, −0.024) −0.025 (−0.059, 5.4 × 10⁻⁵) Human infrastructures (PC2) 250 m −0.004 (−0.010, 0.002) −0.009 (−0.013, −0.005) −0.010 (−0.017, −0.005) −0.005 (−0.009, −2.3 × 10⁻⁴) −0.003 (−0.007, 0.002) 0.012 (−0.013, 0.024) 500 m −0.002 (−0.013, 0.009) −0.009 (−0.011, −0.005) −0.007 (−0.012, −0.004) −0.006 (−0.017, 3.3 × 10⁻⁵) −0.001 (−0.021, 0.010) 0.060 (−0.048, 0.087) 1,000 m 0.005 (−0.005, 0.015) 0.004 (−0.008, 0.005) −0.003 (−0.011, 0.003) −0.004 (−0.010, 0.005) 0.002 (−0.006, 0.021) 0.016 (0.011, 0.084) Elevation (PC3) 250 m −0.024 (−0.044, −0.004) −0.010 (−0.048, 0.014) −0.037 (−0.060, 0.001) −0.034 (−0.047, 0.011) −0.021 (−0.04, 0.004) −0.007 (−0.039, 0.035) 500 m −0.020 (−0.037, −0.002) −0.006 (−0.038, 0.031) −0.023 (−0.047, 0.010) −0.032 (−0.040, −0.009) −0.011 (−0.040, −0.003) −0.010 (−0.073, 0.029) 1,000 m −0.023 (−0.042, −0.005) −0.004 (−0.024, 0.047) −0.028 (−0.057, −0.004) −0.030 (−0.047, −0.006) −0.018 (−0.032, −0.008) −0.039 (−0.066, 0.019) Forests (PC4) 250 m −0.010 (−0.012, 0.032) −0.013 (−0.026, 0.007) −0.019 (−0.040, 0.004) −0.023 (−0.056, 0.019) −0.008 (−0.029, 0.01) 0.023 (−0.095, 0.088) 500 m −0.019 (−0.042, 0.004) −0.015 (−0.039, 0.002) −0.046 (−0.056, 0.003) −0.012 (−0.059, 0.003) −0.005 (−0.039, 0.018) 0.016 (−0.107, 0.059) 1,000 m −0.022 (−0.046, 0.002) −0.020 (−0.046, 0.005) −0.040 (−0.067, −0.027) −0.04 (−0.056, 0.015) −0.002 (−0.041, 0.028) −0.016 (−0.060, 0.052) Distance to nest Distance 47.5 (−120.9, 215.9) −1.4 (−30.7, 55.9) 20.1 (−75.5, 64.3) 46.1 (−114.7, 89.3) 0.0 (−98.4, 119.8) 588.4 (−986.2, 2110.1) Model prediction error 250 m 0.001 (−0.001, 0.003) 0.0 (−1.4 × 10⁻⁸, 1.2 × 10⁻⁸) 8.0 × 10 −7 (−3.0 × 10⁻⁷, 4.8 × 10⁻⁶) 4.8 × 10⁻⁶ (−1.0 × 10⁻⁴, 5.4 × 10⁻⁵) 4.8 × 10⁻⁵ (−9.9 × 10⁻⁴, 1.2 × 10⁻³) 0.008 (−0.004, 0.030) (Continues)
in rugged areas may be a conservative characteristic of Bonelli’s ea-gles seemingly maintained across geographical regions and nest site typologies, and that may constrain range expansion into milder terrain.
Bonelli’s eagle nests were also associated with areas with the lowest cover by built- up areas and the lowest densities of roads and powerlines. Comparable patterns have been reported elsewhere (Gil Sánchez et al., 1996; López- López et al., 2006; Real et al., 2016), al- though other studies did not find significant avoidance of human infra-structures close (<3 km) to occupied nests (Ontiveros 1999; Carrete et al., 2002). Interestingly, Ontiveros (1999) reported that occupied cliffs closer to roads were taller than those farther from roads, suggest-ing that tolerance to human disturbance may depend on the relative safety of nesting sites (Real et al., 2016; Rollan et al., 2010). Overall, we suggest that our observations regarding human infrastructures, to-gether with the preference for particularly rough terrain, indicates that Bonelli’s eagles avoid human disturbance at small distances (<1 km) from nesting sites. It should be noted, however, that our inferences based on conditional logistic regression imply that Bonelli’s eagles select the least disturbed areas within their territories, although this may correspond to areas that may still have some human disturbance. Therefore, our results do not contradict the general view that Bonelli’s eagles can tolerate a certain degree of human disturbance and that human infrastructures and other indicators of disturbance may be rel-atively unimportant to explain the species distribution at larger spatial scales (López- López et al., 2006; Carrascal & Seoane, 2008; Di Vittorio et al., 2012; Muñoz et al., 2013; but see Bosch et al., 2010; Muñoz & Real, 2013 and Real et al., 2016). In addition, it should be noted that a few recent territories had an unusually high cover by human infrastructures around nests, although this patterns was not statisti-cally significant probably due to small sample sizes. The presence of these few pairs apparently more tolerant to human disturbance may imply that in the future the species may be able to expand into more anthropic areas, and this should be the subject of further research. The trends in nesting habitats in relation to territory age observed in our study suggest that new Bonelli’s eagle pairs chose habitats that are structurally comparable to those of the initial population nucleus. This may be a consequence of imprinting of young to natal habitat conditions, which may affect the kind of places the individuals select later in life (Davis & Stamps, 2004). Testing this idea, however, would imply detailed information on the natal and breeding habitats of a large number of marked individuals (e.g., Mannan, Mannan, Schmidt, Estes- Zumpf, & Boal, 2007), which was unavailable in our case. Nevertheless, there is evidence that the new pairs largely originated from the initial population nucleus, based on the assignment of individuals to the unique genetic profile of the population inhabiting southern Portugal (Mira et al., 2013; Palma et al., 2013), and by the tracking of individ-uals with conventional and genetic tags (L. Palma and R. Godinho, unpublished). Despite this general trend for conservative behavior, there was still some flexibility in the selection of the nesting area. This was supported to some extent by the decrease in terrain ruggedness in more recent territories, although nests were consistently located in the roughest areas available within territories. Also, there were a few recent territories where nesting site selection was different, as suggested by the higher cover by human infrastructures and the poor predictive ability of the habitat model to differentiate nesting from random sites. Therefore, an even longer time frame would probably be needed to understand whether innovative habitat selection patterns might eventually emerge, although this was not apparent during our 25- year study.
Taken together, our results suggest that Bonelli’s eagles expanded in southern Portugal because the individuals produced by the orig-inal nucleus could find vacant nesting habitats of basically similar structure in various landscape types across the region (Beja & Palma, 2008; Palma et al., 2013), rather than through the occupation of novel habitats. Agricultural land abandonment and the depopula-tion of the countryside since the 1960s was probably responsible to at least some extent for this process, because it released large areas with low disturbance and that have been progressively occupied by uncultivated woodland and scrublands (Diogo & Koomen, 2012; Van Doorn & Bakker, 2007), thus becoming available for Bonelli’s eagle colonization during the study period. Another main driver was prob- ably the prevalence of tree nesting behavior, which allowed the colo-nization of cliffless landscapes that would be unavailable if strict cliff nesting behavior would be retained, as it is commonest in remaining Iberia (Hernández- Matías et al., 2013; Palma et al., 2013). This idea was supported by genetic studies and demographic modeling, which FIGURE 3 Scatterplots showing trends in habitat conditions around Bonelli’s eagle nests (500-m buffer) in relation to the time of territory establishment. Trends were estimated using ordinary least squares regression (red line, confidence intervals in gray) and quantile regression (light blue to dark blue lines), considering the habitat gradients extracted from a principal component analysis (PC1-4; a-d)), the distances to the nearest nest from a neighboring territory (e), and the prediction error of the habitat model (f). The quantiles represented are 5% (dark blue), 25%, 50%, 75%, and 95% (light blue) Buffer Mean Quantiles 5% 25% 50% 75% 95% 500 m 0.002 (−0.001, 0.005) −7.6 × 10 −8 (−1.1 × 10⁻⁴, 9.5 × 10⁻⁸) −7.1 × 10⁻⁶ (−1.0 × 10⁻⁵, 1.3 × 10⁻⁵) 1.3 × 10⁻⁴ (−5.4 × 10⁻⁵, 5.3 × 10⁻⁴) 7.2 × 10⁻⁴ (−0.003, 0.004) 0.010 (−0.021, 0.042) 1,000 m 0.003 (−0.0001, 0.007) 0.0 (−2.5 × 10⁻⁸, 6.9 × 10⁻⁹) 5.4 × 10 −7 (−7.3 × 10⁻⁷, 3.7 × 10⁻⁶) 9.1 × 10⁻⁵ (−3.0 × 10⁻⁵, 3.1 × 10⁻⁴) 1.2 × 10⁻³ (4.8 × 10⁻⁴, 2.1 × 10⁻³) 0.030 (−0.026, 0.051) T A B L E 4 (Continued)
showed that the genetically isolated tree nesting population of south-ern Portugal was likely the main source of colonists throughout the expansion process (Hernández- Matías et al., 2013; Mira et al., 2013; L. Palma and R. Godinho Unpublished Data). Therefore, the conservation of populations with tree nesting behavior may be particularly relevant for the conservation of Bonelli’s eagles at wider scales, as this behav-ioral trait may help the species respond better to ongoing climatic and land use changes (Hernández- Matías et al., 2013; Muñoz et al., 2013; Palma et al., 2013). In general, our study shows the importance of understanding the contribution of habitat selection patterns to population expansion (Butcher et al., 2014; Veech et al., 2011). In particular, we showed that species can expand despite a relatively conservative nest site se- lection behavior, when changes in land use and human demograph-ics provide new vacant areas open to colonization by the growing population (e.g., Balbontin, Negro, Sarasola, Ferrero, & Rivera, 2008; Cardador, Carrete, & Mañosa, 2011). We also found that the fast ex- pansion of this particular eagle population was facilitated by a spe-cific but relatively rare behavior in the Mediterranean region (tree nesting), which allowed the colonization of habitats that otherwise would be unavailable. The study thus adds to the increasing evidence suggesting that preserving behavioral diversity within populations may be essential for species persistence under anthropogenic en-vironmental change (Caro & Sherman, 2012; Sutherland, 1998; Van Dyck, 2012).
ACKNOWLEDGMENTS
We are grateful to all those who helped locating eagle nests since 1991, in particular to Carlos Carrapato, Carlos Pacheco, Hugh Jansman, Jorge Vicente, João Ferreira, José Raiado, Miguel Caldeira Pais, Paul Voskamp, Pedro Portela, Rita Ferreira, Rogério Cangarato, and Stef van Rijn. We are indebted to Catarina Meireles, Ana Galantinho, and Paula Mendes for GIS and bibliographic assistance and for reviewing parts of the manuscript. We also thank EDP—Energias de Portugal and especially Dr Carlos Rochinha for providing the georeferenced data on powerline networks. A. Dias was supported through a PhD grant from Sociedade Portuguesa de Vida Selvagem. CONFLICT OF INTEREST None declared. REFERENCES Balbontin, J., Negro, J. J., Sarasola, J. H., Ferrero, J. J., & Rivera, D. (2008). Land- use changes may explain the recent range expansion of the Black- shouldered Kite (Elanus caeruleus) in southern Europe. Ibis, 150, 707–716.
Barbosa, A. M., Brown, J. A., Jiménez-Valverde, A., & Real, R. (2014).
modEvA: model evaluation and analysis. R package, version 1.1. Retrieved
from http://modeva.r-forge.r-project.org/
Barton, K. (2013). MuMIn: Multi-model inference. R package version 1.9.0. Retrieved from http://CRAN.R-project.org/package=MuMIn
Beja, P., & Palma, L. (2008). Limitations of methods to test density- dependent fecundity hypothesis. Journal of Animal Ecology, 77, 335–340. Bosch, R., Real, J., Tintó, A., Zozaya, E. L., & Castell, C. (2010). Home- ranges and patterns of spatial use in territorial Bonelli’s Eagles Aquila fasciata. Ibis, 152, 105–117. Broennimann, O., Treier, U. A., Müller-Schärer, H., Thuiller, W., Peterson, A. T., & Guisan, A. (2007). Evidence of climatic niche shift during biological invasion. Ecology letters, 10(8), 701–709.
Burnham, K. P., & Anderson, D. R. (2002). Model selection and multimodel
inference: A practical information-theoretic approach, 2nd ed. New York,
NY, USA: Springer. Butcher, J. A., Collier, B. A., Silvy, N. J., Roberson, J. A., Mason, C. D., & Peterson, M. J. (2014). Spatial and temporal patterns of range expan-sion of white- winged doves in the USA from 1979 to 2007. Journal of Biogeography, 41, 1947–1956. Cade, B. S., & Noon, B. R. (2003). A gentle introduction to quantile regres-sion for ecologists. Frontiers in Ecology and the Environment, 1, 412–420. Cardador, L., Carrete, M., & Mañosa, S. (2011). Can intensive agricultural landscapes favour some raptor species? The Marsh harrier in north- eastern Spain. Animal Conservation, 14, 382–390.
Caro, T., & Sherman, P. W. (2012). Vanishing behaviors. Conservation Letters,
5, 159–166.
Carrascal, L., & Seoane, J. (2008). Factors affecting large- scale distribution of the Bonelli’s eagle Aquila fasciata in Spain. Ecological Research, 24, 565–573.
Carrete, M., Sánchez-Zapata, J. A., Martínez, J. E., Sánchez, M. Á., & Calvo, J. F. (2002). Factors influencing the decline of a Bonelli’s eagle Hieraaetus
fasciatus population in southeastern Spain: Demography, habitat or
competition? Biodiversity & Conservation, 11, 975–985.
Carvalho, F., Carvalho, R., Mira, A., & Beja, P. (2016). Assessing landscape functional connectivity in a forest carnivore using path selection func-tions. Landscape Ecology, 31, 1021–1036.
Davis, J. M., & Stamps, J. A. (2004). The effect of natal experience on habi-tat preferences. Trends in Ecology and Evolution, 19, 411–416. Di Vittorio, M., Sara, M., & López-López, P. (2012). Habitat preferences of
Bonelli’s Eagles Aquila fasciata in Sicily. Bird Study, 59, 207–217. Diogo, V., & Koomen, E. (2012). Land- use change in Portugal, 1990-
2006: Main processes and underlying factors. Cartographica: The
International Journal for Geographic Information and Geovisualization, 47, 237–249.
Duchesne, T., Fortin, D., & Courbin, N. (2010). Mixed conditional logistic regression for habitat selection studies. Journal of Animal Ecology, 79, 548–555.
Elff, M. (2013). mclogit: Mixed Conditional Logit. R package version 0.2-7. Retrieved from http://CRAN.R-project.org/package=mclogit
Fielding, A. H., & Bell, J. F. (1997). A review of methods for the assess-ment of prediction errors in conservation presence/absence models.
Environmental Conservation, 24, 38–49.
Freire, S., Santos, T., & Tenedório, J. A. (2009). Recent urbanization and land use/land cover change in Portugal — the influence of coastline and coastal urban centers. Journal of Coastal Research, SI56, 1499–1503. Gaston, K. J. (2003). The structure and dynamics of geographic ranges.
Oxford, UK: Oxford University Press.
Gil Sánchez, J. M., Molino Garrido, F., & Valenzuela Serrano, G. (1996). Selección de hábitat de nidificación por el Aguila Perdicera (Hieraaetus
fasciatus) en Granada (SE de España). Ardeola, 43, 189–197.
Godinho, S., Guiomar, N., Machado, R., Santos, P., Sá-Sousa, P., Fernandes, J. P., … Pinto-Correia, T. (2016). Assessment of environment, land man-agement, and spatial variables on recent changes in montado land cover in southern Portugal. Agroforestry Systems, 90, 177–192. Hernández-Matías, A., Real, J., Moleón, M., Palma, L., Sánchez-Zapata, J. A.,
Pradel, R., … García, J. (2013). From local monitoring to a broad- scale viability assessment: A case study for the Bonelli’s Eagle in western Europe. Ecological Monographs, 83, 239–261.
Hosmer, D., & Lemeshow, S. (2000). Applied logistic regression. New York, NY, USA: A Wiley-Interscience Publication.
ICNF (2013). IFN6 – Áreas dos usos do solo e das espécies florestais de
Portugal continental. Resultados preliminares. Instituto da Conservação
da Natureza e das Florestas, Lisboa. Retrieved from http://www.icnf. pt/portal/florestas/ifn/resource/ficheiros/ifn/ifn6-res-prelimv1-1 IM/AEMet (2011). Iberian Climate Atlas. Air Temperature and Precipitation
(1971–2000). Instituto de Meteorologia de Portugal – Agencia Estatal de Meteorología, Ministerio de Medio Ambiente y Medio Rural y Marino.
Kassinis, N. (2010). Demographics of the Bonelli’s eagle Aquila fasciata pop-ulation in Cyprus. Bird Census News, 23/1-2, 21–27.
Keith, S. A., & Bull, J. W. (2017). Animal culture impacts species’ capacity to realise climate-driven range shifts. Ecography, 40, 296–304.
Koenker, R., Portnoy, S., Ng, P. T., Zeileis, A., Grosjean, P., & Ripley, B. D. (2016). Package ‘quantreg’. Version 5.29. Retrieved from https:// cran.r-project.org/web/packages/quantreg/quantreg.pdf
Lavergne, S., Mouquet, N., Thuiller, W., & Ronce, O. (2010). Biodiversity and climate change: Integrating evolutionary and ecological responses of species and communities. Annual Review of Ecology, Evolution, and
Systematics, 41, 321–350.
Legendre, P., & Legendre, L. (1998). Numerical ecology, 2nd ed. Amsterdam, The Netherlands: Elsevier.
López-López, P., García-Ripollés, C., Aguilar, J. M., García-López, F., & Verdejo, J. (2006). Modelling breeding habitat preferences of Bonelli’s eagle (Hieraaetus fasciatus) in relation to topography, disturbance, cli-mate and land use at different spatial scales. Journal of Ornithology,
147, 97–107.
Lowry, H., Lill, A., & Wong, B. (2013). Behavioural responses of wildlife to urban environments. Biological Reviews, 88, 537–549.
Mannan, R. W., Mannan, R. N., Schmidt, C. A., Estes-Zumpf, W. A., & Boal, C. W. (2007). Influence of natal experience on nest- site selection by urban- nesting cooper’s hawks. The Journal of wildlife Management, 71, 64–68.
Martínez-Abraín, A., & Jiménez, J. (2016). Anthropogenic areas as in-cidental substitutes for original habitat. Conservation Biology, 30, 593–598.
Mira, S., Arnaud-Haond, S., Palma, L., Cancela, M. L., & Beja, P. (2013). Large- scale population genetic structure in Bonelli’s Eagle Aquila fasci-ata. Ibis, 155, 485–498. Muñoz, A. R., Márquez, A. L., & Real, R. (2013). Updating known distribu- tion models for forecasting climate change impact on endangered spe-cies. PLoS ONE, 8(6), e65462. Muñoz, A. R., & Real, R. (2013). Distribution of Bonelli’s Eagle Aquila fasciata in southern Spain: Scale may matter. Acta Ornithologica, 48, 93–101. Mure, M. (2003). Approche par suivi visual du domaine vital de l’Aigle de
Bonelli (Hieraaetus fasciatus) en Ardèche. PhD Thesis. ÉcolePratique des
HautesÉtudes, Paris, France.
Overington, S. E., Griffin, A. S., Sol, D., & Lefebvre, L. (2011). Are inno-vative species ecological generalists? A test in North American birds. Behavioral Ecology, 22, 1286–1293. Palma, L., Beja, P., Pais, M., & Cancela da Fonseca, L. (2006). Why do raptors take domestic prey? The case of Bonelli’s eagles and pigeons. Journal of Applied Ecology, 43, 1075–1086. Palma, L., Beja, P., & Sánchez, R. (2013). Twenty years of research and con-servation of endangered eagles in Portugal. Raptors Conservation, 27, 73–91. Peterson, A. T., Papes, M., & Kluza, D. A. (2003). Predicting the potential in-vasive distributions of four alien plant species in North America. Weed Science, 51, 863–868.
R Development Core Team (2016). R: A language and environment for
statisti-cal computing. Vienna, Austria: R Foundation for Statististatisti-cal Computing. Real, J., Bosch, R., Tintó, A., & Hernández-Matías, A. (2016). Identifying key habitats for the conservation of Bonelli’s Eagle Aquila fasciata using ra-diotracking. Ibis, 158(3), 556–568. Real, J., Grande, J. M., Mañosa, S., & Sánchez-Zapata, J. A. (2001). Causes of death in different areas for Bonelli’s Eagle Hieraaetus fasciatus in Spain. Bird Study, 48, 221–228. Robillard, C. M., Coristine, L. E., Soares, R. N., & Kerr, J. T. (2015). Facilitating climate- change- induced range shifts across continental land- use barri-ers. Conservation Biology, 29(6), 1586–1595.
Rollan, A., Real, J., Bosch, R., Tintó, A., & Hernández-Matías, A. (2010). Modelling the risk of collision with powerlines in Bonelli’s Eagle
Hieraaetus fasciatus and its conservation implications. Bird Conservation International, 20, 279–294.
Santana, J., Porto, M., Reino, L., & Beja, P. (2011). Long- term understory recovery after mechanical fuel reduction in Mediterranean cork oak forests. Forest Ecology and Management, 261, 447–459.
Sappington, J. M., Longshore, K. M., & Thompson, D. B. (2007). Quantifying landscape ruggedness for animal habitat analysis: A case study using bighorn sheep in the Mojave Desert. The Journal of Wildlife Management,
71, 1419–1426.
Schielzeth, H. (2010). Simple means to improve the interpretability of re-gression coefficients. Methods in Ecology and Evolution, 1, 103–113. Schlicht, L., Valcu, M., & Kempenaers, B. (2014). Thiessen polygons as a
model for animal territory estimation. Ibis, 156, 215–219.
Schloss, C. A., Nuñez, T. A., & Lawler, J. J. (2012). Dispersal will limit abil-ity of mammals to track climate change in the Western Hemisphere.
Proceedings of the National Academy of Sciences of the United States of America, 109, 8606–8611.
Sohl, T. L. (2014). The relative impacts of climate and land- use change on conterminous United States bird species from 2001 to 2075. PLoS
ONE, 9, e112251.
Sol, D., Sayol, F., Ducatez, S., & Lefebvre, L. (2016). The life- history basis of behavioural innovations. Philosophical Transactions of the Royal Society
of London. Series B, Biological Sciences, 371, 20150187.
Sutherland, W. J. (1998). The importance of behavioural studies in conser-vation biology. Animal Behaviour, 56, 801–809.
Tjur, T. (2009). Coefficients of determination in logistic regression mod-els—a new proposal: The coefficient of discrimination. American
Statistician, 63, 366–372.
Van Doorn, A. M., & Bakker, M. M. (2007). The destination of arable land in a marginal agricultural landscape in South Portugal: An exploration of land use change determinants. Landscape Ecology, 22, 1073–1087. Van Dyck, H. (2012). Changing organisms in rapidly changing anthropogenic
landscapes: The significance of the ‘Umwelt’- concept and functional habitat for animal conservation. Evolutionary Applications, 5, 144–153. Veech, J. A., Small, M. F., & Baccus, J. T. (2011). The effect of habitat on the
range expansion of a native and an introduced bird species. Journal of
Biogeography, 38, 69–77.
Wickham, H., & Chang, W. (2016). Package ‘ggplot2’. Version 2.2.1. Retrieved from https://cran.r-project.org/web/packages/ggplot2/index.html Wright, T. F., Eberhard, J. R., Hobson, E. A., Avery, M. L., & Russello, M. A.
(2010). Behavioral flexibility and species invasions: The adaptive flexi-bility hypothesis. Ethology Ecology & Evolution, 22, 393–404.
SUPPORTING INFORMATION
Additional Supporting Information may be found online in the sup-porting information tab for this article.
How to cite this article: Dias A, Palma L, Carvalho F, Neto D,
Real J, Beja P. The role of conservative versus innovative nesting behavior on the 25- year population expansion of an avian predator. Ecol Evol. 2017;00:1–13. https://doi. org/10.1002/ece3.3007