0
Universidade de Lisboa
Faculdade de Farmácia
Molecular Cytogenetic Characterization of Murine Cell Line
SEWA
Alice Da Cruz Madeira Borges
Mestrado Integrado em Ciências Farmacêuticas
1
Universidade de Lisboa
Faculdade de Farmácia
Molecular Cytogenetic Characterization of Murine Cell Line
SEWA
Alice Da Cruz Madeira Borges
Monografia de Mestrado Integrado em Ciências Farmacêuticas apresentada à
Universidade de Lisboa através da Faculdade de Farmácia
Orientador: Professor Doutor Thomas Liehr
Co-Orientador: Professora Doutora Isabel Antolin Rivera
2
This work was developed at Friedrich-Schiller Universität Jena, Institut für Humangenetik,under the supervision of Dr. Thomas Liehr.
3
Resumo:
A hereditariedade e as alterações estruturais dos cromossomas são dois temas ligados à Citogenética Clínica que apresentam maior impacto aquando da tomada de decisão relativa a diagnósticos tumorais e pré/pós natais. Através de métodos de hibridação de fluorescência in situ, desenvolvidos ao longo dos anos, é possível obter informações relativas a alterações estruturais e variações numéricas no cariótipo celular, permitindo retirar conclusões relativamente à origem e prognóstico de cancros, e à viabilidade de fetos quando uma determinada doença congénita está presente numa família. Para que estes estudos sejam passiveis de ser realizados são necessárias linhas celulares modificadas. A linha celular SEWA é uma das mais usadas a nível de estudos carcinogénicos. Desenvolvida inicialmente a partir de um sarcoma osteogénico induzido por um polioma-vírus, o seu material carcinogénico foi posteriormente transformado em tumor ascítico e transplantado para ratinhos da linhagem A.SW. A sua importância para os estudos sobre tumores prende-se no facto de esta linha celular ser caracterizada pela presença in vivo de cromossomas double minute, de cromossomas C-bandless e homogeneously staining regions. Estas estruturas cromossómicas contêm o oncogene c-myc, cujo grau de amplificação está diretamente correlacionado com a gravidade do tumor. No entanto, até à data, nenhuma caracterização do seu cariótipo foi publicada. Este trabalho visa apresentar um possível cariótipo para esta linha celular, com uma descrição detalhada das suas alterações estruturais e numéricas. Para tal, técnicas como MCB, SKY e aCGH foram usadas. Qualquer uma destas técnicas é derivada de uma tecnologia desenvolvida no final dos anos 60, denominada de hibridização de fluorescência in situ (FISH). Neste tipo de métodos, diferentes sondas são marcadas com diferentes marcadores fluorescentes de modo a que seja possível visualizar regiões específicas do genoma. Os resultados, obtidos através de processamento de imagem, seriam posteriormente usados para encontrar homólogos no genoma humano e associar essas alterações a um tumor humano. A presença de cromotripsis, estruturas comuns em tumores agressivos, que ocorrem nas etapas iniciais de carcinogénese, seria também indício de mau prognóstico na sobrevivência ao cancro. Estudos como este permitem que modelos de origem tumoral sejam desenvolvidos, possibilitando um prognóstico mais prematuro relativamente ao desenvolvimento e cura de determinados tumores. Neste trabalho, 30 metafases foram analisadas, tanto para o método SKY, como para o MCB, sendo que no último a análise foi realizada cromossoma a cromossoma. No entanto, devido à má qualidade dos resultados obtidos e a alguma inexperiência do operador, não foi possível retirar conclusões concretas relativamente às alterações cromossómicas encontradas. Apenas se concluiu que as células SEWA apresentam um cariótipo instável, com diferentes alterações entre metafases. Além disso, resultados entre métodos não coincidiram o que levou à impossibilidade de criar um cariótipo representativo da população celular analisada, nem à descrição de breakpoints, que teriam significado para determinar uma futura homologia com o genoma humano. Será então necessária uma reavaliação dos resultados para que novas conclusões sejam obtidas.
4
Abstract:
Inheritance and structural changes of chromosomes are two themes related to Clinical Cytogenetics that present greater impact when making decisions regarding tumor and pre and post-natal diagnoses. Through in situ hybridization methods developed over the years, it is possible to obtain information on structural changes and numerical variations in the cellular karyotype, allowing investigators to draw conclusions regarding the origin and prognosis of cancers, and the viability of fetuses when certain congenital diseases are present in a family. The SEWA cell line, initially developed from osteogenic sarcoma induced by a polyoma virus, is one of the most widely used in carcinogenic studies. However, to date, no characterization of its karyotype has been published. This work aims to present a possible karyotype of this cell line, with a detailed description of its structural and numerical changes. For such, techniques like MCB, SKY and aCGH were used. The results would then be used to find homologs in the human genome and associate those changes with a human tumor. Studies like this allow models of tumor genesis to be developed, allowing an earlier prognosis regarding the development and cure of certain tumors. In this work, 30 metaphases were analyzed, both for SKY method and MCB. In the last one, the analysis was performed on each of the chromosomes. However, due to the poor quality of the results obtained and some inexperience of the operator, it was not possible to draw concrete conclusions regarding the chromosomal alterations that were found. It was only concluded that SEWA cells present an unstable karyotype, with several changes present in only one metaphase. Moreover, results between methods did not coincide, which led to the impossibility of creating a representative karyotype of the cell population and describing the breakpoints that would have meaning in homology with the human genome. It will then be necessary to re-evaluate the results so that new conclusions can be obtained.
5
Acknowledgements:
Firstly, I need to thank Professor Carolino Monteiro and Professor Isabel Carreira for all the help in contacting Dr.Thomas and delivering my interest on being part of his team during my Erasmus program. Without these two people, none of this work would have been accomplished.
I would like to thank Dr.Thomas for accepting my application to his team, for all the help in dealing with paperwork needed and for the guidance he gave through all my time in Jena and after I left.
I thank Shaymaa for all the time spent with me, revising my results, supporting me while learning all the techniques and explaining all the theory I needed to complete this work.
Also, I give my thanks to Professor Isabel Rivera. Without her none of my interest in Genetics would have been spiked. Thank you for having me helping with your work, and thank you for accepting being my master’s supervisor.
Last but not least, I thank my parents for supporting this different turn I took with my life, the decision of going abroad and for supporting me through all the process.
6
INDEX
Figures Index……… 7
Tables Index………. 10
1. Introduction……….. 11
1.1. Historical background……… 11
1.2. Fluorescence in situ Hybridization………11
1.2.1. Spectral Karyotyping...……….. 12
1.2.2. Multicolour chromosome banding..………. 14
1.3. Comparative genome hybridization...……….. 14
1.4. Murine cell line SEWA……… 15
1.4.1. Chomothripsis and its impact on Cancer Development…………. 15
2. Objectives……….... 16
3. Experimental Methodology……… 17
3.1. Reagents………….……… 17
3.2. Samples……….………. 17
3.3. Equipment………..……… 17
4. Experimental Procedures……….. 18
4.1. Muse SKY……….……….. 18
4.1.1. Execution of SKY procedure……… 18
4.1.2. Image acquisition and analysis……… 18
4.2. Mouse MCB……… 20
4.2.1. Execution of MCB procedure.……….. 20
4.2.2. Image acquisition and analysis.………... 20
5. Results.………. 21
5.1. SKY analysis……….. 21
5.1.1. Chomosome markers……… 31
5.2. MCB analysis………...……… 32
5.3. CGH results……… 53
5. Discussion………... 54
6. Conclusion………...……… 57
7. References………... 58
8. Annexes……… 59
8.1. Tumorigenesis models and chromotripsis formation………...………… 59
8.2. MOUSE SKY – post hybridization wash………...…. 60
8.3. “Dropping” – slides preparation………... 61
8.4. Mcb procedure………... 62
8.5. Mcb colour schemes………. 64
8.6. SKY single cell aberrations……….. 68
8.7. Mcb single cell aberrations……….. 71
7
FIGURES INDEX
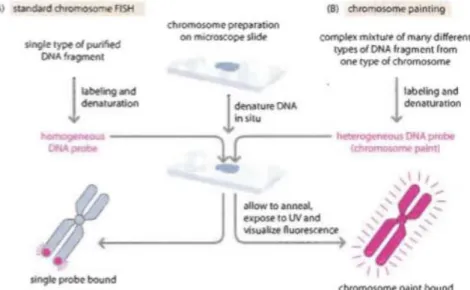
Figure 1. Basis of chromosome FISH and chromosome painting methods
.… 12
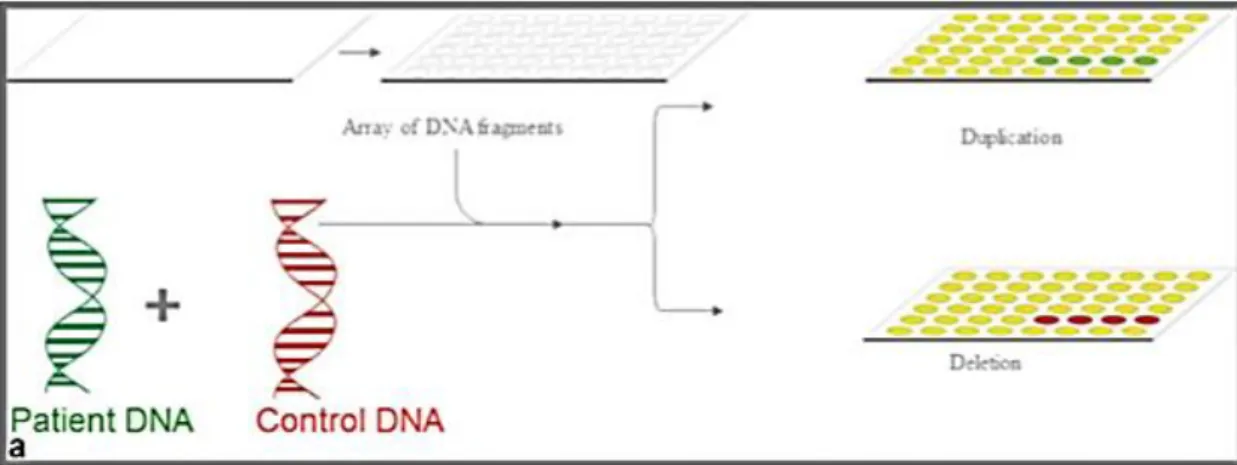
Figure 2. aCGH scheme: test and reference DNA are depicted
……… 15
Figure 3. Example of slide scanning (down and side)
………. 18
Figure 4. Example of slide scanning (side and down)
………. 18
Figure 5. Mouse SKY colour scheme
………. 19
Figure 6. SKY result for subclone 1a
……….. 21
Figure 7. SKY result for subclone 1b
……….. 22
Figure 8. SKY result for subclone 1c
……….. 23
Figure 9. SKY result for subclone 1d
……….. 24
Figure 10. SKY result for subclone 2a
……….... 25
Figure 11. SKY result for subclone 2b
……… 26
Figure 12. SKY result for subclone 2c
……… 27
Figure 13. SKY result for subclone 2d
……… 28
Figure 14. SKY result for clone 3
……….… 29
Figure 15. SKY result for clone 4
………. 30
Figure 16. SKY result for clone 5
………. 31
Figure 17. Mcb result for chromosome 1 (a)
……….. 32
Figure 18. Mcb result for chromosome 1 (b)
……….. 32
Figure 19. Mcb result for chromosome 2
………...…….... 33
Figure 20. Mcb result for chromosome 3
……… 34
Figure 21. Mcb result for chromosome 4
……… 35
Figure 22. Mcb result for chromosome 5
……… 36
Figure 23. Mcb result for chromosome 6
……… 37
Figure 24. Mcb result for chromosome 7
……… 38
Figure 25. Mcb result for chromosome 8 (a)
……….. 39
Figure 26. Mcb result for chromosome 8 (b)
……….. 39
8
Figure 28. Mcb result for chromosome 9 (b)
………. 41
Figure 29. Mcb result for chromosome 10
………. 42
Figure 30. Mcb result for chromosome 11 (a)
……… 43
Figure 31. Mcb result for chromosome 11 (b)
……….. 43
Figure 32. Mcb result for chromosome 12
………. 44
Figure 33. Mcb result for chromosome 13
………... 45
Figure 34. Mcb result for chromosome 14
……….… 46
Figure 35. Mcb result for chromosome 15 (a)
………..…. 47
Figure 36. Mcb result for chromosome 15 (b)
……… 47
Figure 37. Mcb result for chromosome 16
………. 48
Figure 38. Mcb result for chromosome 17
………. 49
Figure 39. Mcb result for chromosome 18
………. 50
Figure 40. Mcb result for chromosome 19
………. 51
Figure 41. Mcb result for chromosome X
………... 52
Figure 42. Overall view of all karyotype structural aberration
………. 56
Figure 43. Classical theory for tumorigenesis
……… 59
Figure 44. Chromothripsis and tumour development
………...… 59
Figure 45. Dropping scheme
……….... 61
Figure 46. MMU mcb #1
……… 64
Figure 47. MMU mcb #2
……… 64
Figure 48. MMU mcb #3
……… 64
Figure 49. MMU mcb #4
……… 64
Figure 50. MMU mcb #5
………... 64
Figure 51. MMU mcb #6
……… 64
Figure 52. MMU mcb #7... 65
Figure 53. MMU mcb #8
……… 65
Figure 54. MMU mcb #9
……… 65
Figure 55. MMU mcb #10
………. 65
Figure 56. MMU mcb #11
………. 65
9
Figure 57. MMU mcb #12
……… 65
Figure 58. MMU mcb #13
……… 66
Figure 59. MMU mcb #14
……… 66
Figure 60. MMU mcb #15
……… 66
Figure 61. MMU mcb #16
……….... 66
Figure 62. MMU mcb #17
………. 66
Figure 63. MMU mcb #18
………. 66
Figure 64. MMU mcb #19
………. 67
Figure 65. MMU mcb #X
………...…… 67
10
TABLES INDEX
Table 1. aCGH resumed results
………... 53
11
1. Introduction
1.1. Historical background
Clinical Cytogenetics is the field of Genetics which deals with chromosomes structure and inheritance, applying its knowledge to medical practice. It is known that changes in the chromosomal numbers and structure can be related to several clinical conditions which can be summarized as chromosomal disorders. Presently, chromosomal analysis is widely used in diagnostic procedures for clinical medicine (1) such as pre and postnatal diagnosis as well as tumour diagnosis.
Historically, the development of this field was marked by the constant innovations in technical procedures. Liehr et al. divided these technical developments in three major periods: the pre-banding era (1879-1970), characterized by the first visualization of human chromosomes (1879) (2) and the first published illustrations by Walther Flemming in 1882 (3), by the creation of the word “chromosome” in 1888 (2) by Waldeyer (3), the determination of the correct modal human chromosome number (1956) and the identification of the first inherited chromosomal abnormality – trisomy 21 – in 1959 (2). The banding era (1968-1986) started with the invention of Q-banding by Lore Zech (2). After this, many more improvements were made, including R-, T-, C- and G-banding technologies (3). Cytogenetics entered the last era, the molecular age, with the first molecular cytogenetic experiment on human chromosomes (1989) (2). This era was marked by the development of in situ hybridization, a procedure that allows tracking down specific DNA sequences in chromosomes (4) and that was first described 1969 (radioactive variant) (2). Since then, many variations of the method have been developed, and its sensitivity has increased enormously (4). The development of high resolution chromosome banding procedures, such as FISH, has greatly expanded both the range and precision of these routine analyses (1).
1.2. Fluorescence in situ hybridization (FISH)
FISH, standing for fluorescence in situ hybridization, is a series of techniques where probes are labelled with different coloured fluorescent tags to visualize one or more specific regions of the genome. It is named in situ because the DNA, either in interphase chromatin or in metaphase chromosomes, is fixed on a slide, denatured and finally visible in place – in situ. The hybridized labelled probes can be visualized with wavelength of light that excites the fluorescent dye (1). By using sophisticated image processing equipment and report-binding molecules carrying different fluorescent dyes, several DNA probes can be hybridized simultaneously so that the location of specific sequences can be identified in relation to each other.
There are three main types of probes used in FISH: whole chromosome painting (WCP, PCP) - used to discover chromosomal aberrations; repetitive sequence probes (centromeres=CEPs, telomeric probes) used either for chromosomal enumeration or chromosomal ends determination, and locus-specific identifier (LCI) probes for gene fusions, translocations, deletions or duplications (5). The probes can be labelled directly by incorporating a fluorescently labelled nucleotide precursor. Alternatively, a nucleotide containing a reporter molecule (e.g. biotin or digoxigenin) is incorporated into the DNA after which it can be specifically bound by a fluorescently
12
labelled affinity molecule that binds strongly and specifically to the reporter molecule.(6) One commonly used class of probes for FISH is a fragment of DNA derived from a unique location on a chromosome. Such probes hybridize and label the site on each homologous chromosome sequence. A FISH probe can also be a complex mix of DNA obtained from all or part of a chromosome arm or even from an entire chromosome. Depending on how the probe is designed, some part or the entire chromosome will be stained by the probe. Such probe mixtures are known as “whole chromosome painting” (1). (See Figure 1)
An application designed for chromosome painting is widely used to investigate or define abnormal chromosome rearrangements in clinical and cancer cytogenetics. Also, it is particularly helpful with preparations from tumours, whose quality tend to often be poor (6). However, the use of this kind of probes in interphase chromosomes is very restricted, since they are dispersed inside the cell nucleus and do not form discrete units. Centromeric enumeration probes hybridize with alpha/beta or classical satellite repeat sequences within the specific centromeric regions of each chromosome, allowing enumeration. As to LSI FISH probes, there are two major kinds which are used in oncology: dual-colour translocation probes for chromosomal translocations involving known partner genes and dual-colour break-apart probes for chromosomal translocations involving genes with unknown or multiple translocation partners. These kinds of probes are also used to identify the origin of amplified DNA that belongs to homogeneously staining regions (HSRs) and double minute chromosomes (DMs) which occur frequently in tumour cells (5).
1.2.1. Spectral Karyotyping (SKY)
On the other hand, one can combine 24 different chromosomes painting probes, one for each chromosome. Each probe is labelled with a different combination of fluorescent dyes that emit at different wavelengths. This technique is known as Spectral Karyotyping – SKY.
Figure 1 - Basis of the chromosome FISH and chromosome painting methods (in Read,A., Strachan, T. “ Human Molecular Genetics” 4th Ed)
13 SKY is also based on the hybridization of fluorescently labelled DNA. These labels differentiate from the other ones used in conventional FISH because they are generally consisting of up to 55 individually generated chromosome-specific probes (7). In SKY, because each chromosome specific probe emits its own signature combination of wavelengths, abnormal chromosomes consisting of pieces of different chromosomes are easily seen, and the chromosomes involved in the rearrangement can be readily identified (1).
SKY has proven to be a very useful technique in analysing and comprehending cytogenetic abnormalities associated with malignant diseases, and has been administered to a large selection of samples derived from haematological malignancies and solid tumours.
Another widely used method of chromosomal characterization is M-FISH (multiplex fluorescent in situ hybridization). Although the hybridization principle is similar between SKY and M-FISH, the last one uses a set of fluorochrome-specific optic filters, instead of the single custom-designed one used in SKY.
Constitutional chromosome abnormalities, originated by de novo balanced translocations (in which chromosomal regions are relocated in a reciprocal manner, and there is no loss of genetic material) and unbalanced translocations (associated with genomic imbalances), can be studied by using SKY or M-FISH procedures. This is extremely important in pre-natal diagnosis, since it may represent the difference of having a normal child, and one with mild to severe disease (7). Likewise, when it is not possible to identify the origin of a chromosome in a child, SKY/M-FISH has the ability to elucidate the unknown origin without the need to perform a karyotype test in the parents, which was the conventional way. This advantage is very useful when dealing with genetic counselling in families (8). However, even if this method enables an easier interpretation when analysing the results, it cannot detect balanced structural abnormalities such as inversions, or small changes like deletions, insertions and duplications in the same chromosome, since the colour scheme will be the same. This is only possible between different chromosomes (8). Also, the resolution limit of SKY is approximately 5-10Mb. This means that minor structural abnormalities with less than 5 Mb will not be detected.
As for applying SKY/M-FISH in cancer cytogenetics, this method allows the characterization of novel and hidden chromosomal translocations, identification of complex rearrangements and reconstitution of clonal evolution events during cancer progression. Also, SKY/M-FISH helps with the identification of homogenous staining regions and double minute chromosomes, regardless of size and numbers. It has, however, its limitations. Since most of the time these aberrations contain multiple gene and/or DNA regions that are tightly linked, additional FISH hybridization with gene-loci probes, specific chromosome or chromosome-arm paints, should be performed (7).
SKY/M-FISH can also be a useful tool for genome scanning in human carcinogenesis study. It is possible to determine and compare homologous regions of genomes between closely related species – cross-species hybridization. At present, commercially made SKY/M-FISH probes and analysis software are only available for human, mouse and rat. Murine models of human carcinogenesis are widely used to outline genetic mechanisms that control tumour initiation and progression (7).
14
1.2.2. Multicolour chromosome banding (MCB)
As described above, banding techniques allow a highly reproducible banding pattern, which leads to the identification of single chromosomes and structural aberrations. However, in numerous cases, the techniques mentioned above do not provide enough information about subtle rearrangements or chromosomal breakpoints.
Multicolour chromosome banding (MCB) is a method based on the use of differently labelled overlapping microdissection segments that are derived from partial chromosome painting libraries, where changes in the fluorescence intensity ratios are used to assign different pseudo-colours to specific chromosome regions.
With MCB, one can analyse a colour pattern for each chromosomal region and, by comparing it to normal chromosome pattern, find aberrations linked to specific chromosomal bands.
Also, the results obtained are independent from the chromosome condensation, since multicolour patterns are observed regardless the chromosomes’ length.
Hence, MCB contributes to a more detailed information about chromosomal aberrations and their breakpoints.(9) It is available for human and mice (abbreviated mcb for distinguishing both probe sets).
1.3. Comparative genome hybridization (aCGH)
Even with all the new resources mentioned above, chromosomal karyotyping still had the disadvantage of being time consuming, laborious and demanding, with limited resolution and short-term cell culture needed (2).
In 1992, “comparative genomic hybridization” (CGH) was introduced for the first time to the scientific world by Kallioniemi et al (University of California, San Francisco) (10).
This method is based on the labelling of test and reference genomic DNAs with two different fluorochromes, followed by co-hybridization onto normal metaphase chromosomes. The chromosomes are then scanned and fluorescence intensity ratios measured in order to detect differences, leading to genomic imbalances findings (2).
aCGH has the advantage of not needing cell cultures, providing an overall view of gains and losses throughout the whole genome (11). These gains or losses are identified by changes from 1:1 ratio (2). (See Figure 2)
The sensitivity of aCGH depends on the level of copy number changes and is promptly altered by contamination. Also, aCGH can’t detect balanced translocations, inversions and aberrations bellow its resolution. Facing these disadvantages, this technique should not be used as a solo technique, but as a supplementary one (11).
15 By using this method as a guide, more specific techniques such as FISH can be used to identify oncogenes and/or tumour suppressor genes, allowing more accurate results about tumour genesis and development (11).
1.4. Murine cell line SEWA
One of the most broadly used murine cell line for cytogenetic work is probably SEWA murine cell line. The SEWA cell line is originally derived from a polyoma virus-induced osteogenic sarcoma (12). Material from the transplantable tumour was transformed into ascites tumour cell, that were carried in serial intraperitoneal transplantation in mice of the A.SW strain(13).This cell line is characterized by having a great variation of double-minute (DM) chromosomes per cell in vivo, but losing them over time when transplanted in vitro. They would, however, be restored after reinjection into animals. In 1977, some findings indicated that DM carried genes that were important for the in vivo growth of these types of cells, which suggested that DM had something to do with the malignancy of SEWA cells (Levan et al., 1980). Indeed, years later it was shown that DM contained the c-myc oncogene (14) and that its level of amplification was correlated with the degree of tumorigenicity of SEWA (Martinsson et al.,1988) (13). On the other hand, cytogenetic analysis revealed another two typical chromosomal abnormalities related with the presence of amplified genes: C-bandless chromosomes (CM) and homogeneously staining regions (HSR)(14). It was observed that, under the same conditions, some subpopulations of SEWA lines would replace DM for CM. Like what happened to DM cells, CM cells were shown to have amplified c-myc (14). Likewise, there were other sublines that developed HSR instead of CM. It was also observed a certain “antagonism” between the simultaneous existence of these types of chromosomes, meaning that in most cell populations, there was either DM, or CM or HSR (13).
1.4.1. Chromothripsis and its impact on Cancer Development
Chromothripsis are defined as chromosomal structures derived from a massive de novo structural rearrangement, formed in one single catastrophic genomic event
(see Annex 1 – Figure 1). Occasionally these fragments can lead to small circular DNA
molecules, known as Double Minute Chromosomes, which, as described above, may
Figure 2 - aCGH scheme: test and reference DNA are labelled with different fluorochromes. Both samples are mixed and hybridized together on a slide containing arrays of spotted DNA fragments. The excess is washed away. The intensity ratios are calculated and normalized. If the DNA sample and test are equal in copy number, the intensities are the same. If there is a deletion or duplication, the intensities differ. (In “Fluorescence in situ
16
harbour oncogenes. Another characteristic feature is the oscillating copy-number pattern, instead of the typical 2-3 copy-number states usually found in cancer context (15).
FISH studies showed this type of structural rearrangements not only in tumour subclones but also in almost all tumour cells. This suggests that formation of chromothripsis occurs early on tumour events (16).
These formations have been reported through the years to appear in many tumour entities and have been linked to poor prognostic in cancer survival, indicating some relevance in using chromothripsis as a prognostic marker (16).
However, its detection is not a simple one. Many observational criteria are needed so that chromothripsis can be identified. Also, in tumours with extreme levels of genomic instability, these criteria may be difficult to recognise. Hence, tumour heterogeneity and ploidy may be factors that contribute to a mistakenly inference of chromothripsis (16).
2. Objectives
Since this cell line is so widely used for cancer studies, it is in our best interest to characterize its karyotype. The knowledge of the genomic content in detail enables the possibility of identifying a corresponding tumour model for human by translating the imbalances and chromosomal breakpoints found into human genome.
2.1. Line of work
To characterize the karyotype of this murine cell line, FISH procedures were performed.
The first step was to perform SKY (Spectral Karyotyping) to obtain a general view of the affected chromosomes.
After the identification of the altered chromosomes with SKY, MCB procedures were performed for each chromosome so that we could obtain more detailed genetic information.
The present work represents the firsts steps of the cytogenetic work needed to reach such conclusions. Until the present date, no other work for molecular cytogenetic characterization of SEWA was found published.
17
3. Experimental Methodology
3.1. Reagents:
For Mouse SKY procedure (post-hybridization washing) the following reagents were used:
0.4x SSC
4x SSC/Tw – 100 mL 20x SSC diluted in 400 mL of water (bi-dist) and 250L Tween 20 (SIGMA);
Blocking Reagent;
Cy5-Antidigoxin Staining Reagent; SA-Cy5 Solution;
Pacific Blue Staining; Anti-fade DAPI Solution;
For mcb Mouse procedure, the following reagents were used:
1x PBS – 47.75g PBS (Biochrom) diluted in 5L of water (bi-dist); 20x SSC (Invitrogen);
1x SSC – 25ml 20x SSC diluted in 475mL of water (bi-dist) pH7-7.5; 0.4x SSC ;
4x SSC/Tw – 100 mL 20x SSC diluted in 400 mL of water (bi-dist) and 250L Tween 20 (SIGMA);
70% Formamide – 70mL Formamide + 10mL 20x SSC + 20mL of water (bi-dist);
Ethanol 70% Ethanol 95% Ethanol 100%
Post-Fix Solution – for 1mL solution: 500L Paraformaldehyde (2% stock solution) + 450L 1x PBS + 50L 1M MgCl2;
Marvel Solution – 0.1g Milk + 2mL 4xSSC/Tw;
Antibody solution – for each slide – SA-Cy5 5-8L + 100L Marvel; Anti-fade DAPI Solution;
Probes
3.2. Samples:
SEWA cell line suspension
3.3. Equipment:
For SKY/M-FISH and mcb mouse procedure: Incubator (humid chamber)
Thermoshaker Hotplate Shaker For image analysis:
18
4. Experimental Procedures
4.1. Mouse SKY/M-FISH
4.1.1. Execution of SKY/M-FISH procedure
The procedure, in general, is divided in six major parts: i) preparation of metaphase chromosome spreads; ii) slide pre-treatment and slide and probe denaturation; iii) hybridization; iv) detection of SKY probes; v) image acquisition; vi) image analysis (7).
For this experiment, SKY probes were used, but, instead of SKY protocol, a standard FISH protocol was performed. To perform a standard FISH procedure, one should fix the target DNA (cells, nuclei, fixed tissues sections, metaphase chromosomes or pure DNA) onto a slide surface. Next, the probes need to be prepared. After this denaturation of probes and target DNA needs to be promoted, followed by their combined renaturation. After renaturation, post-hybridization washes followed by detection wash are performed. For last, one needs to add the counterstain, antifade and coverslip to finish the procedure (2).
In this line of work, the SKY procedure and the metaphase image capturing were previously done by a team member, leaving only the analysis to be done.
A detailed protocol is available in annexes (see Annex 2 and 3)
4.1.2. Image acquisition and analysis
For SKY image analysis, normally a microscope equipped with SpectraCube and suitable for two filter sets is needed. (2)
Here, 40 metaphase images were captured in order to have 10 good metaphases for karyotype analysis by M-FISH system.
The correct way of scanning slides for microscope analysis is describes in the images below. (See Figures 3 and 4)
For imaging analysis, ISIS program was used.
Before analysing, image treatments were needed. This step is essential since it is when shadows and non-important signals are removed, and chromosome signals are enhanced, increasing the image quality.
When analysing it is important to know that the centromere gives no signal.
Figure 4 - example of slide scanning, down and then side
Figure 3 - example of slide scanning, side and then down
19 In this analysis, each chromosome has a colour pattern. This way, it is possible to compare the sample with the pattern corresponding to normal chromosome, and take conclusions about the existence (or not) of aberrations.
The colour scheme used for comparison is showed below. (See Figure 5)
20
4.2. Mouse mcb Procedure
4.2.1. Execution of mcb procedure
Murine multicolour chromosome banding (mcb) is an assay that uses the principle of Multicolour FISH (mFISH) method and applies it in detection of intra-chromosomal rearrangements (17).
In this work, before performing a mcb procedure for each of the 21 chromosomes of the cell line, a “dropping” technique (preparation of the slides) was executed. In each slide two chromosomes were added, one to each edge. The slides were firstly cooled for 2h in a coplin jar with distilled water in the fridge. Before performing the dropping, if needed, a FIX solution was prepared. The whole technique was executed on a 50ºC hot plate. In the bench, the sample was dropped firstly on the slide, followed by the FIX solution. After this, the slide was left on top of a wet paper (placed on the hot plate) for about two minutes, until steam is formed, and then dried directly on the hot plate. The spread of the metaphases was checked on a microscope.
The mcb procedure available was divided in four major phases: pre-treatment of slides with pepsin; probe denaturation and pre-hybridization; denaturation of slides and post washing.
A detailed protocol is available in annexes (See Annex 4).
4.2.2. Imaging acquisition and analysis
As it was done for SKY/M-FISH, around 40 to 50 metaphases for each chromosome were captured, this time in order to have 30 good metaphases to analyse.
For imaging analysis, ISIS program was used once more.
The method is very similar to the one applied for SKY. A comparing pattern for each chromosome was used, and differences between control and sample were registered as inversions, deletions or translocations.
The colour schemes for each chromosome are available in annexes (see Annex 5).
21
5. Results
5.1. SKY/M-FISH Results
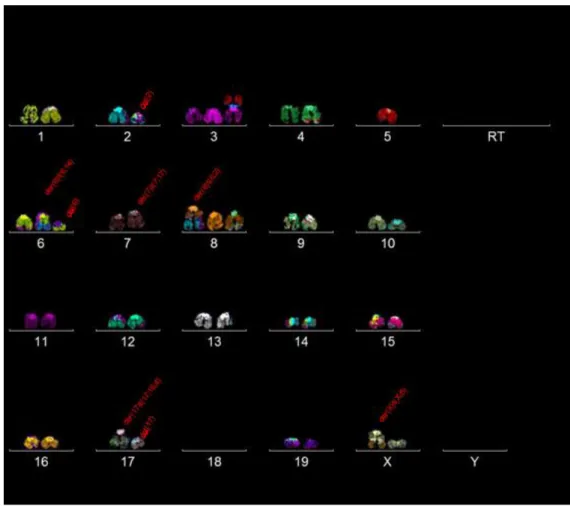
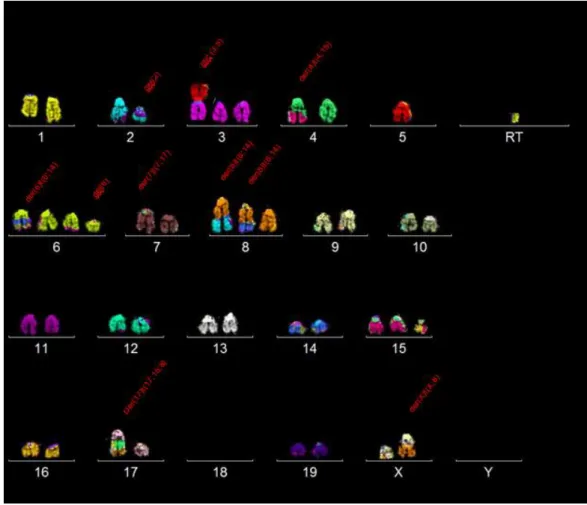
Performing SKY had the objective of searching for a global karyotype that could describe better this cell line. For that purpose, 30 metaphases were selected to be analysed. In each metaphase, the karyotype was organized and for each chromosome, general structural aberrations were searched and noted. From there, similar single karyotypes were compared and placed together as subclones and clones.
After 30 metaphases were analysed, most of the chromosomes in this cell line showcased diploidy (30/30 metaphases). Therefore, it can be named as near diploid cells (chromosome numbers 35-57).
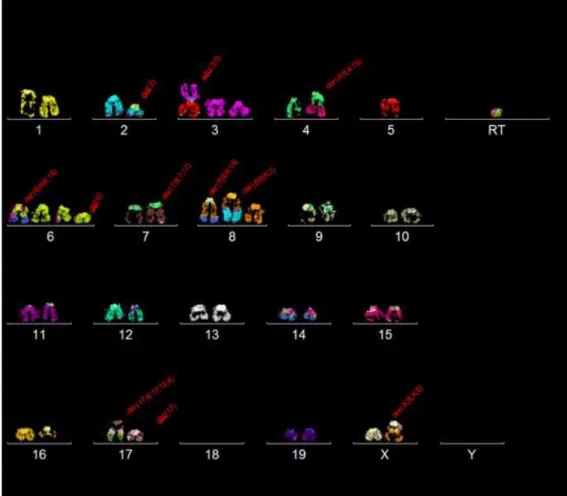
Clone 1:
Clone 1 and its subclones were found in 12 out of 30 metaphases. They appear to have the following karyotype:
39~43, XX, der(X)t(8;x), +del(2), +idic(3;5), der(4)t(4;15), -5, +del(6) x2, der(7)t(7;17), +der(8)t(8;14), del(17), der(17)t(4;15;17), -18x2
Subclone 1a:
Subclone 1a was found in 6 out of 30 metaphases. It can be described with the following karyotype:
42~43, XX, der(X)t(8;x), +del(2), +idic(3,5), der(4)t(4;15), -5, +del(6)x2, der(6)t(6;14), der(7)t(7;17), +der(8)t(8;14), del(17), der(17)t(4,15,17), -18x2
22
For single cell aberrations see Annex 6.1.1.
Subclone 1b:
Subclone 1b was found in 2 out of 30 metaphases. It can be described with the following karyotype:
39~42, XX, der(X)t(8;X), del(2), +idic(3;5), der(4)t(4;15), -5, +del(6), +der(6)t(6;10;14), der(7)t(7;17), der(8)t(2;8), + der(8)t(8;14), del (17), der(17)t(4;15;17), -18x2
For single cell copy number variations and aberrations see Annexes 6.1.2. and 6.1.3.
23
Subclone 1c:
Subclone 1c was found in 2 out of 30 metaphases. It can be described with the following karyotype:
40~42, XX, der(X)t(8;X), del(2), +idic(3;5), der(4)t(4;15), -5, del(6), + der(6)t(6;10;14), der(7)t(7;17), +der(8)t(8;14), del(17), der(17)t(4;15;17), -18x2
For single copy number variations and aberrations see Annexes 6.1.4 and 6.1.5.
24
Subclone 1d:
Subclone 1d was found in 2 out of 30 metaphases. It can be described with the following karyotype:
41-43, XX, der(X)t(8;X), +del(2), +idic(3;5), der(4)t(4;15), -5, +del(6)x2, der(6)t(6;10;14), der(7)t(7;17), +der(8)t(8;14), der(9)t(9;15), del(17), -18x2
For single cell aberrations see Annex 6.1.6.
25
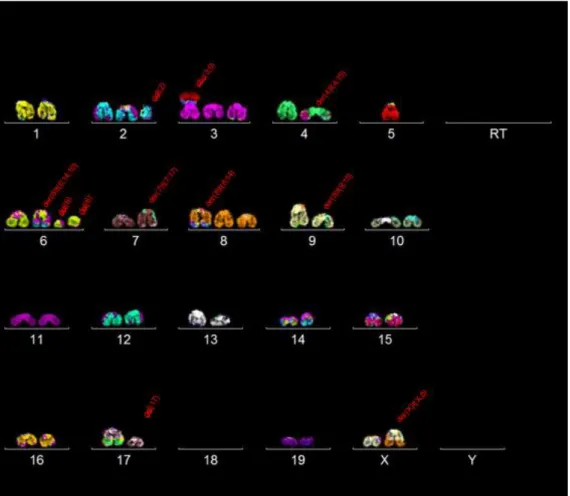
Clone 2:
Clone 2 and its subclones were found in 9 out of 30 metaphases. They appear to have the following karyotype:
40~43, XX, der(X)t(8;X), del(2), +idic(3;5), der(4)t(4;15), -5, +del(6), +der(6)t(6;14), +der(8)t(8;14), del(17), -18x2
Subclone 2a:
Subclone 2a was found in 3 out of 30 metaphases. It can be described with the following karyotype:
41~43, XX, der(X)t(8;X), del(2), +idic(3;5), der(4)t(4;15), -5, del(6), +del(6), +der(6)t(6;14), +der(8)t(8;14), del(17), der(17)t(8;15;17), -18x2
For single cell aberrations see Annex 6.2.1.
26
Subclone 2b:
Subclone 2b was found in 2 out of 30 metaphases. It can be described with the following karyotype:
40~43, XX, der(X)t(8;X), del(2), +idic(3;5), der(4)t(4;15), -5, del(6), +der(6)t(6;14), der(7)t(7;17), +der(8)t(8;14), del(17), -18x2
27 For single cell aberrations see Annex 6.2.2.
Subclone 2c:
Subclone 2c was found in 2 out of 30 metaphases. It can be described with the following karyotype:
40~41, X, der(X)t(8;X), +del(2), +idic(3;5), der(4)t(4;15), -5, del(6), +der(6)t(6;14), -7, der(8)t(8;2), del(17), der(17)t(4;15;17), -18x2
For single cell copy number variations and aberrations see Annexes 6.2.3. and 6.2.4.
28
Subclone 2d:
Subclone 2d was found in 2 out of 30 metaphases. It can be described with the following karyotype:
40~43, X, der(X)t(8;x), del(2), +idic(3;5), der(4)t(4;15), -5, del(6), +der(6)t(6;14), der(7)t(7;17), +der(8)t(8;2), del(17), der(17)t(5;14;17), -18x2
No random aberrations were found.
29
Clone 3:
Clone 3 was found in 3 out of 30 metaphases. It appears to have the following karyotype:
40~43, X, der(X)t(8;X), del(2), +idic(3;5), der(4)t(4;15), -5, +del(6), +der(6)t(6;14), der(7)t(7;17), der(8)t(8;2), +der(8)t(8;14), del(17), der(17)t(8;15;17), -18x2
For single copy number variations and aberrations see Annex 6.3.
30
Clone 4:
Clone 4 was found in 4 out of 30 metaphases. It appears to have the following karyotype:
41~44; X,X, der(X)t(8;X), del(2), +idic(3;5), der(4)t(4;15), -5, del(6), +der(6)t(6;14), der(7)t(7;17), +der(8)t(8;2), der(8)t(8;14), del(17), der(17)t(4;15;17), -18x2
For single copy number variations and aberrations see Annex 6.4.
31
Clone 5:
Clone 5 was found in 1 out of 30 metaphases. It appears to have the following karyotype:
41, X, -X, del(2), der(3)t(3;9), +idic(3;5), der(4)t(4;15), -5, +del(6), +der(6)t(6;14), der(8)t(8;2), +9, del(17), +der(17)t(8;15;17), -18
For single cell aberrations and copy number variations see Annex 6.
5.1.1. Chromosome markers
There were some cases in which the signals had no clear order and/or pattern and did not correspond to any chromosome described. However, it was clear that they were formed by DNA material clustered together. Therefore, these were considered DNA markers and analysed as such.
1-2 chromosome markers where found in 11 metaphases.
32
5.2. Mcb Results
Mcb was performed with the purpose of describing all chromosomal alterations meticulously. For that, also 30 metaphases were selected, this time for each chromosome, and only signals belonging to the chromosome selected were analyzed and written down.
For all chromosomes represented, always 30 metaphases were analyzed.
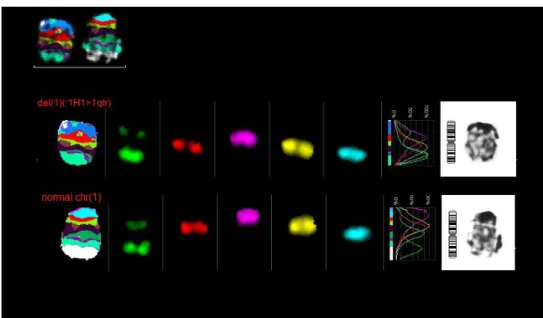
Mcb 1:
Two normal chromosomes 1 were found in 24 metaphases.
One normal chromosome 1 and one del(1)(H) were found in 5 metaphases.
Figure 17 - mcb result for chromosome 1, two normal chromosomes
Figure 18 - mcb result for chromosome 1, one normal chromosome and 1 del(1)(:1H1>1qter)
33 Two del(1)(1H1) were found in 1 metaphase.
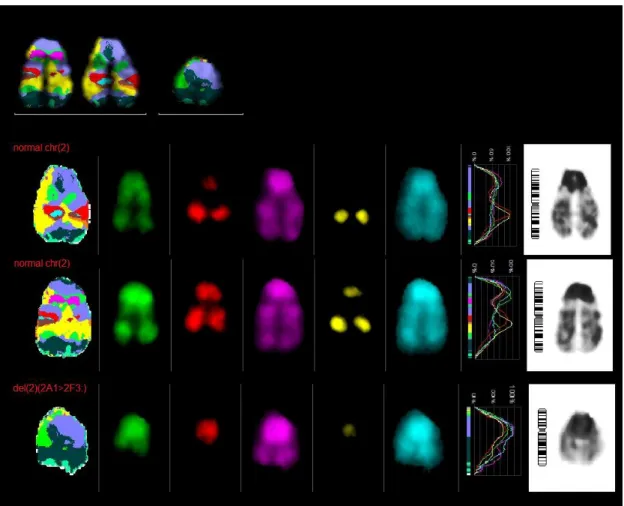
Mcb 2:
Two normal chromosomes 2 and one del(2)(2A12F3:) were found in 6 metaphases.
One normal chromosome 2, one del(2)(2A1::2H32qter) and one del(2)(2A12F3:) were found in 2 metaphases.
Two normal chromosomes were found in 2 metaphases.
One normal chromosome 2, one del(2)(2A12F3:) and one der(?)t(?;2)(?::2E52F1::2A22qter) were found in 2 metaphases.
For single aberrations see Annex 7.1
34
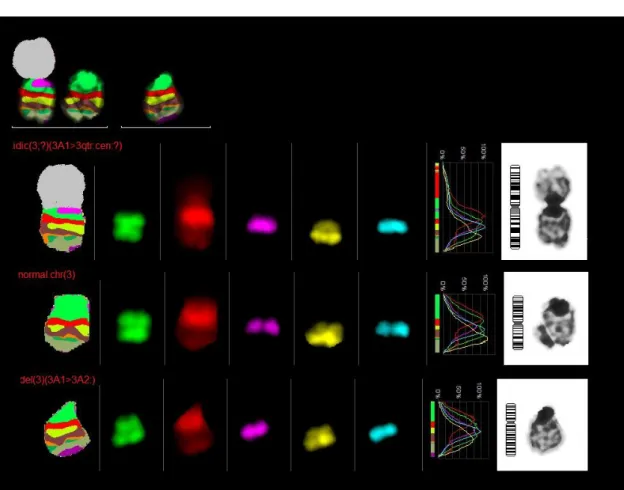
Mcb 3:
One idic(3;?)(3A13qter:cen:?), one normal chromosome 3 and one del(3)(3A13A2:) were found in 26 metaphases
One idic(3;?)(3A13qter:cen:?) and one normal chromosome 3 were found in 2 metaphases.
Three idic(3;?)(3A13qter:cen:?), one normal chromosome 3 and one del(3)(3A13A2:) were found in 1 metaphase.
Two idic(3;?)(3A13qter:cen:?), one normal chromosome 3 and one del(3)(3A13A2:) were found in 1 metaphase.
Figure 20 - mcb result for chromosome 3, one idic(3;?)(3A1>3qter:cen:?), one normal chromosome and one del(3)(3A1>3A2:)
35
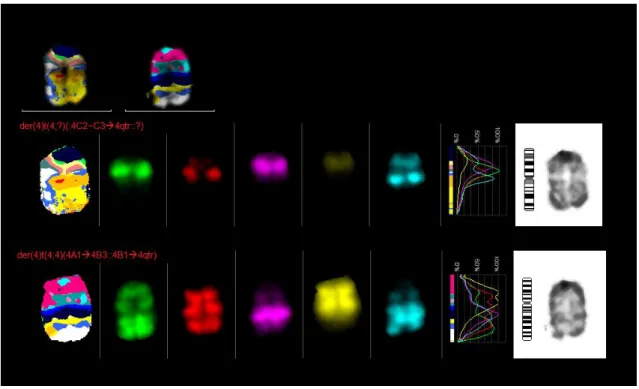
Mcb 4:
One der(4)t(4;?)(:4C2~C34qter::?) and one der(4)t(4;4)(4A14B3::4B14qter) were found in 10 metaphases.
Figure 21 - mcb result for chromosome 4, one der(4)t(4;?)(:4C2~C3>4qter::?) and one der(4)t(4;4)(4A1>4B3::4B1>4qter)
One der(4)t(4;?)(:4C2~C34qter::?) and one del(4)(4A14A5::4qter) were found in 9 metaphases.
One der(4)t(4;?)(:4C2~C34qter::?) and one del(4)(4A1A5::4D14qter) were found in 2 metaphases.
One der(4)t(4;?)(:4C2~C34qter::?) and one del(4)(4A14A5::4D24qter) were found in 2 metaphases.
One der(4)t(4;?)(:4C2~C34qter::?) and one del(4)(:4D14qter) were found in 2 metaphases.
36
Mcb 5:
One idic(?;5)(?:cen:5A15qter) and one normal chromosome 5 were found in 13 metaphases.
Figure 22 - mcb result for chromosome 5, one idic(?;5)(?:cen:5A1>5qter) and one normal chromosome
One idic(?;5)(?:cen:5A15F:) and one normal chromosome 5 were found in 5 metaphases.
One idic(?;5)(?:cen:5A15F:) and one del(5)(5G15qter:) were found in 4 metaphases.
One idic(?;5)(?:cen:5A15qter) and del(5)(5G15qter:) were found in 2 metaphases. One idic(?;5)(?:cen:5A15F:) and one del(5)(5A15A2::5G5qter) were found in 2 metaphases.
37
Mcb 6:
One der(6)t(6;?)(6A16C2::?), one del(6)(6A16D:), one del(6)(6A16D::6F26qter), one del(6)(6A16E~F1:) and one normal chromosome 6 were found in 6 metaphases.
Figure 23 - mcb result for chromosome 6, one der(6)t(6;?)(6A1>6C2::?), one del(6)(6A1>6D:), one del(6)(6A1>6D::6F2>6qter), one del(6)(6A1>6E~F1:) and one normal chromosome
One der(6)t(6;?)(6A16C2::?), one del(6)(6A16D:), one del(6)(6A16D::6F26qter) and one normal chromosome 6 were found in 3 metaphases.
One der(6)t(6;?)(6A16C2::?), one del(6)(6A16D:), one del(6)(6A16D::6F26qter) and one del(6)(:6F26qter) were found in 2 metaphases.
38
Mcb 7:
One der(7)t(7;?)(7A17qter::?) and one normal chromosome 7 were found in 20 metaphases
Figure 24 - mcb result for chromosome 7, one der(7)t(7;?)(7A1>7qter::?) and one normal chromosome 7
Two normal chromosomes were found in 6 metaphases. For single aberrations see Annex 7.5
39
Mcb 8:
One der(8)t(8;?)(8A18D1::?), one der(?)t(?;8)(?::8C38D1:) and one inv(8qter8A1) were found in 11 metaphases.
One der(8)t(8;?)(8A18D1::?), one der(?)t(?;8)(?::8C38D1:) and one inv(:8D18A1) were found in 6 metaphases.
Figure 25 mcb result for chromosome 8, one der(8)t(8;?)(8A1>8D1::?), one der(?)t(?;8)(?::8C3>8D1:) and one inv(8qter>8A1)
Figure 26 - mcb result for chromosome 8, one der(8)t(8;?)(8A1 8D1::?), one der(?)t(?;8)(?::8C3 8D1:) and one inv(:8D1 8A1)
40
For single aberrations see Annex 7.6
Mcb 9:
One normal chromosome 9 and one del(9)(:9F2~F39qter) were found in 8 metaphases.
41 One del(9)(9A19A2::9F2~F39qter) and one del(9)(:9F2~F39qter) were found in 5 metaphases.
One del(9)(:9F2~F39qter) and one del(9)(9A19A2:) were found in 4 metaphases. One normal chromosome 9 and one del(9)(9A19A2:) were found in 4 metaphases. Two del (9)(:9F2~F39qter) were found in 4 metaphases.
For single aberrations see Annex 7.7
Figure 28 - mcb result for chromosome 9, one del(9)(9A1>9A2::9F2~F3>9qter) and one del(9)(:9F2~F3>9qter)
42
Mcb 10:
One normal chromosome 10, one der(?)t(?;10)(?::10D210D3:) and one del(10)(10A110A2:) were found in 28 metaphases.
For single aberrations see Annex 7.8
Figure 29 - mcb result for chromosome 10, one normal chromosome 10, one der(?)t(?;10)(?::10D2>10D3) and one del(10)(10A1>10A2:)
43
Mcb 11:
Two normal chromosomes 11 were found in 7 metaphases.
One del(11)(11A111A4:) and one del(11)(11A111A3::11E111qter) were found in 4 metaphases.
Figure 30 - mcb result for chromosome 11, two normal chromosomes 11
Figure 31 - mcb result for chromosome 11, one del(11)(11A1>11A4:) and one del(11)(11A1>11A3::11E1>11qter)
44
For single aberrations see Annex 7.9
Mcb 12:
Two der(12)t(12;12)(12A112C2::12F112qter) were found in 27 metaphases.
One der(12)t(12;12)(12A112C2::12F112qter) was found in 2 metaphases. Three der(12)t(12;12)(12A112C2::12F112qter) were found in 1 metaphase.
45
Mcb 13:
One normal chromosome 13 and one del(13)(:13D2) were found in 9 metaphases.
Figure 33 - mcb result for chromosome 13, one normal chromosome 13 and one del(13)(:13D2)
Two normal chromosomes 13 were found in 7 metaphases. Two del(13)(:13D2) were found in 6 metaphases.
46
Mcb 14:
One der(?)t(?;14)(?::14A114D1:), one der(?)t(?;14)(?::14D314C2~C3:) and two del(14)(:14D214qter) were found in 16 metaphases.
One der(?)t(?;14)(?::14D214qter), one der(?)t(?;14)(?::14D314C2~C3:) and two del(14)(:14D214qter) were found in 6 metaphases.
For single chromosome aberrations see Annex 7.11
Figure 34 - mcb result for chromosome 14, one der(?)t(?;14)(?::14A1>14D1:), one der(?)t(?;14)(?::14D3>14C2~C3:) and two del(14)(:14D2>14qter)
47
Mcb 15:
Two normal chromosomes 15, one der(?)t(?;15)(?::15D115D3:) and one der(?)t(?;15;?)(?::15D115D3::?) were found in 13 metaphases
Two normal chromosomes 15 and two der(?)t(?;15;?)(?::15D115D3::?) were found in 6 metaphases.
Figure 35 - mcb result for chromosome 15, two normal chromosomes 15, one der(?)t(?;15)(?::15D1>15D3:) and one der(?)t(?;15;?)(?::15D1>15D3::?)
Figure 36 - mcb results for chromosome 15, two normal chromosomes 15 and two der(?)t(?;15;?)(?::15D1>15D3::?)
48
Two normal chromosomes 15, two der(?)t(?;15)(?::15D115D3:) and one der(?)t(?;15;?)(?::15D115D3::?) were found in 5 metaphases.
For single aberrations see Annex 7.12.
Mcb 16:
Two normal chromosomes 16 were found in 27 metaphases.
Figure 37 - mcb result for chromosome 16, two normal chromosomes 16
49
Mcb 17:
One normal chromosome 17, one der(?)t(?;17)(?::17E117E2:) and one del(17)(:17C~D17qter) were found in 28 metaphases.
Figure 38 - mcb result for chromosome 17, one normal chromosome 17, one der(?)t(?;17)(?::17E1>17E2:) and one del(17)(:17C~D>17qter)
50
Mcb 18:
One der(?)t(?;18)(?::18A118qter) and one der(18)t(18;?)(18A118qter::?) were found in 29 metaphases.
Figure 39 - mcb result for chromosome 18, one der(?)t(?;18)(?::18A1>18qter) and one der(18)t(18;?)(18A1>18qter::?)
51
Mcb 19:
Two normal chromosomes 19, one der(?)t(?;19)(?::19D119qter) and one der(?)t(?;19;?)(?::19D119qter::?) were found in 28 metaphases.
For single aberrations see Annex 7.16
Figure 40 - mcb result for chromosome 19, two normal chromosomes 19, one der(?)t(?;19)(?::19D1>19qter) and one der(?)t(?;19;?)(?::19D1>19qter::?)
52
Mcb X:
One der(X)t(X;?)(XA1XA6::?), one del(X)(XA1XA6::XEXqter) and two del(X)(XA1XA6::XCXqter) were found in 17 metaphases.
Figure 41 - mcb result for chromosome X, one der(X)t(X;?)(XA1>XA6::?), one del(X)(XA1>XA6::XE>Xqter) and two del(X)(XA1>XA6::XC>Xqter)
One der(X)t(X;?)(XA1XA6::?), one del(X)(XA1XA2::XEXqter) and two del(X)(XA1XA6::XCXqter) were found in 5 metaphases.
One der(X)t(X;?)(XA1XA6::?), one del(X)(XA1XA6::XEXqter) and one del(X)(XA1XA6::XCXqter) were found in 5 metaphases.
53
5.3. aCGH Results
aCGH results were asked to a collaborating laboratory in order to verify all of the results obtained from both sky and mcb procedures. In this case, multiple aCGH reports were sent, and the one which more closely represented the population studied was selected to compare results. All the aberrations were checked for each chromosome.
Table 1 - aCGH resumed results: green stands for observed aberrations; red stands for non-observed aberrations
Chromosome Cytoband Gain(+)/Loss(-)
Chr 1 qD - Chr 2 qA1 - Chr 2 qE5-qF1 + Chr 2 qG1-qH4 + Chr 3 qA3-qH4 + Chr 5 qC1-qC3.2 + Chr 6 qA1-qA3.1 + Chr 6 qD2-qE1 + Chr 6 qG1-qG3 - Chr 8 qA4-qB1.3 + Chr 8 qC3-qD1 + Chr 8 qE1 - Chr 9 qA3-qB + Chr 9 qA5.3-qB + Chr 10 qA1-qA4 - Chr 10 qD2-qD3 + Chr 11 qD-qE2 + Chr 14 qA1-qB + Chr 14 qA1-qA2 + Chr 14 qB-qC1 + Chr 14 qD2-qE5 - Chr 15 qD1 + Chr 15 qE3 + Chr 17 qB3-qE2 + Chr 18 qB1-qE3 + Chr 18 qB1-qB3 + Chr 18 qE3-qE4 - Chr X qE1-qE3 -
54
5. Discussion
After analysing SKY results, SEWA cell line was characterized by having near diploid cells, which means that most of the metaphases analysed had between 35 and 37 chromosomes.
The cell line divided itself in 5 major clones, presenting similar karyotypes for each group.
Clone 1 appears to have the main karyotype, representing 40% of the metaphases studied. It is divided in four subclones:
I. The difference between subclone 1a and clone 1 is that 1a has another recurring aberration that doesn’t exist in clone 1: der(6)t(6;14). Plus, one of the metaphases did not have the aberration der(7)t(7;17) that is characteristic of clone 1 karyotype.
II. Additionally to the main karyotype, subclone 1b also has as main aberration der(8)t(8;2). In this karyotype the original aberration der(6)t(6;14) is replaced by der(6)t(6;14;10).
III. Instead of original aberration der(6)t(6;14), subclone 1c has as main aberration der(6)t(6;14;10). The difference between this one and subclone 1b is that 1c lacks the aberration der(8)t(8;2).
IV. The main difference between subclone 1d and the original one, is that it has another two main aberrations in its karyotype: der(9)t(9;15) and der(6)t(6;14;10). The last one is replacing the original aberration der(6)t(6;14). One of the metaphases lacked one of the main aberrations from clone 1: der(17)t(17;15;4). Instead, it was replaced by the aberration der(17)t(17;15;8).
Clone 2 was present in 30% of the metaphases, being also divided in four subclones:
I. The main difference between suclone 2a and its original is the presence of main aberration der(17;15;8) that replaces the original one der(17;15;4) and the presence of aberration der(8)t(8;14). One of the metaphases didn’t showcase the aberration der(17;15;8), having it replaced by the aberration der(17)t(17;15).
II. Subclone 2b differs from the original one since, apart from the main karyotype, it also has aberrations der(7)t(7;17) and der(8)t(8;14).
III. Subclone 2c differs from the previous subclones since it has as main aberrations der(8)t(8;2) and der(17)t(17;15;4). It is, however, lacking the aberration der(8)t(8;14).
Also, one of the metaphases had normal X chromosomes, hence lacking the main aberration der(X)t(X;8) that occurs in the original clone 2.
IV. Subclone 2d also has as main aberrations: der(8)t(8;2), der(6)t(6;14) and der(7)t(7;17). These aberrations are not found in the original clone 2.
Clone 3 was found in 3 out of 30 metaphases, having no subclones associated. Clone 4 and 5 were found in four and one metaphases, respectively, having also no subclones associated. Clone 5 was the only one to show loss of sexual chromosome X.
55 While analysing, some metaphases had non-identifiable DNA structures, cluster – like, with no recognizable colour pattern. These structures were named chromosome markers. However, there could be a possibility for them to be chromothripsis.
As for mcb results, 30 metaphases were studied for each chromosome. Chromosomes 1, 3, 10, 12, 16, 17, 18 and 19 were those whose aberration development was the most stable, having major aberrations in most of the metaphases analysed. Chromosomes 2, 4, 8, 9 and 11 were the most unstable ones, showing mostly single aberrations.
When asked for the aCGH, the results obtained with the in situ hybridization procedures did not always correspond to the ones observed in the array (mismatched breakpoints and aberrations).
As can be seen in Table 1 (see subchapter 5.3), chromosomes 1, 4, 9, 11 and 18 were completely mismatched comparatively to the aberrations found with mcb. There were cases where no significant aberration was detected with aCGH, whereas in mcb they were observed – example of chromosome 4, where there should be marked deletion of cytoband A1 to B1; chromosome 12, where it was expected to see significant deletion of cytoband E and chromosome 19, with amplification of D1 to qtr.
For chromosome 5, M-FISH/SKY reveals that one chromosome 5 is missing, however that is not detected in mcb and aCGH. This is due to the fact that the missing chromosome is forming and idic with chromosome 3,and thus, while making a karyotype, it was annexed to chromosome 3 instead of 5.
In chromosome 6, aCGH reveals deletion of the final cytoband, which makes sense since most of metaphases had at least one chromosome without the final cytoband.
In chromosome 7, no major breakpoints or aberrations where found. However, in SKY as well as mcb, derivative chromosomes where found. This can be explained by the fact that aCGH detected all the cytobands and they were indeed present in the right “amount”. The aberrations where not detected because no copy number was altered, and no DNA material was added or deleted, just moved.
As to chromosomes 14 and 17, in Table 1 they were considered mismatched. However, due to the proximity of the breakpoints detected, and the bad quality of the signals, it is possible to consider that while capturing, the signals detected moved, giving false results.
Surprisingly, chromosome 2, which was one of the most unstable chromosomes, was the one with the more matches between mcb and aCGH results.
One factor that did not match between SKY results and MCB results, was that in SKY no chromosome 18 was observed, whereas in MCB 30 metaphases with chromosome 18 were analysed. No reason for these observations was found.
A resumed evaluation of SKY, mcb and aCGH is shown in annex 8.
A general view of the aberrations found can be seen in the figure bellow. See Figure 42)
56
Figure 42 - overall view of all karyotype structural aberrations: deletions found in mcb and aCGH marked as red bars; amplifications found in mcb and aCGH marked as green bars; matched breakpoints marked as purple arrows; amplifications found only in mcb marked as light grey bars; deletions found only in mcb marked as pink bars; possible breakpoints marked as pink arrows (18).
57
6. Conclusions
SEWA cell line is one murine cell line which is mainly used for cytogenetic researches. Along the line of this work it was clear that this cell line was rather unstable.
After SKY/M-FISH analyses, five clones were determined, with a wide number of associated subclones.
Some chromosomal clusters were also found. It would not be strange to regard these structures as chromothripsis since they are common in many tumour forms, and can be found not only in subclones but also in most of the primary cells. In this work, only 11 metaphases out of 30 studied had this kind of aberrations, but there could be more and not have been recognised because of inexperience in identifying and acknowledging their existence. Also, as described in Chapter 1.4.1, it is mostly difficult to infer the existence of chromothripsis when there is marked genetic instability, which is one of the main characteristics of this cell line. It was also pointed that, sometimes, chromothripsis may form DMs, which are a common feature of SEWA. However, these formations get lost when transferring from in vivo cell cultures to in vitro cell cultures. This could be another explanation for the unusual low number of chromothripsis identified.
Concerning mcb results, most chromosomes had single anomalies (found in only one metaphase), not being possible to define major aberrations.
The major obstacle this cell line presented was the bad quality of the chromosomes, since they were too small to get completely clear probe signals. This problem was observed both with the results from SKY and MCB.
aCGH showed a very different reality of this cell line aberrations, when compared to mcb and SKY. It was, however, possible to discern major breakpoints on few chromosomes.
If the results were conclusive enough to get a clear genomic description of SEWA cell line, the next step would be to translate chromosomal breakpoint to its homologous in human genome by using databases and bioinformatics. Then, a comparison between human cancers of different origins would be performed and find the one with the higher level of concordance. This would allow to identify SEWA cell line as a model for studies involving a specific human tumour.
58
Bibliography
1. Nussbaum RL, Mcinnes RR, Willard HF. Genetics medicine. Vol. 98.
2. Liehr T, editor. Fluorescence in situ hybridization (FISH) [Internet]. 2nd ed. Vol. 7, Blood Reviews. Springer Berlin Heidelberg; 2017. 588 p. Available from: https://www.genome.gov/10000206#al-1
3. Gersen SL, Keagle MB. The Principles of Clinical Cytogenetics. 2nd ed. L.Gersen S, B.Keagle M, editors. Totowa, New Jersey: Human Press; 2005. 559 p.
4. O’Connor C. Fluorescence In Situ Hybridization (FISH) [Internet]. Nature Education. 2008 [cited 2017 Mar 13]. Available from: http://www.nature.com/scitable/topicpage/fluorescence-in-situ-hybridization-fish-327 5. Wan TSK, Ph D. Cancer Cytogenetics : Methodology Revisited. 2014;413–25. 6. Strachan TOM, Read A. Molecular Genetics. 4th ed. 2011.
7. Padilla-Nash HM, Barenboim-Stapleton L, Difilippantonio MJ, Ried T. Spectral karyotyping analysis of human and mouse chromosomes. Nat Protoc [Internet]. 2006;1(6):3129–42. Available from: http://www.ncbi.nlm.nih.gov/pubmed/17406576 8. Imataka G, Arisaka O. Chromosome Analysis Using Spectral Karyotyping ( SKY ).
2012;13–7.
9. Chudoba I, Lorch T, Plesch A, Lemke J, Claussen U, Senger G. High resolution multicolor-banding: a new technique for refined FISH analysis of human chromosomes. Cytogenet Cell Genet. 1999;84:156–60.
10. Kallioniemi A,Kallioniemi OP,Sudar D et al. Comparative genomic hybridization for molecular cytogenetic analysis of solid tumors. Science (80- ). 1992;258:818–21. 11. Weiss MM, Hermsen MAJA, Meijer GA, Grieken NCT Van, Baak JPA, Kuipers EJ, et al.
Comparative genomic hybridisation. J Clin Pathol Mol Pathol. 1999;52:243–51.
12. Leibniz-Institute DSMZ-German Collection of Microorganisms and Cell Culture [Internet]. [cited 2017 Mar 15]. Available from: https://www.dsmz.de/catalogues/details/culture/ACC-523.html
13. Levan G, St F, Wettergren Y. Gene amplification in the murine SEWA system. 1992;276:285–90.
14. Rooney, Cliona M, Rowe, M, Wallace, LE, Rickinson A. Amplification and enhanced expression of c-myc oncogene in mouse SEWA tumour cells. Nature. 1985;317(6038):629.
15. Stephens PJ, Greenman CD, Fu B, Yang F, Bignell GR, Mudie LJ, et al. Massive genomic rearrangement acquired in a single catastrophic event during cancer development. Cell [Internet]. 2011 Jan 7 [cited 2017 Sep 23];144(1):27–40. Available from: http://www.ncbi.nlm.nih.gov/pubmed/21215367
16. Korbel JO, Campbell PJ. Criteria for inference of chromothripsis in cancer genomes. Cell [Internet]. 2013;152(6):1226–36. Available from: http://dx.doi.org/10.1016/j.cell.2013.02.023
17. Multicolor FISH with Isis | MetaSystems [Internet]. [cited 2017 May 24]. Available from: https://metasystems-international.com/en/products/solutions/mfish-mband/
18. Adler D. Idiogram Album: Mouse [Internet]. 1994 [cited 2017 Oct 8]. Available from: http://www.pathology.washington.edu/research/cytopages/idiograms/mouse/
59
Annexes
Annex 1 – Tumorigenesis models and chromothripsis formation
Figure 43 – Classical theory for tumorigenesis: stepwise acquisition of somatic DNA driver alterations (dashed blue arrows). Cellular crisis, as chromothripsis may accelerate this process by resulting in several DNA alterations at once (solid black arrows). The colour symbolize the malignancy of the cells: white = non-malignant, red = aggressive/highly malignant. (in O.Korbel, et al, 2013)
Figure 44 – B) chromothripsis and tumour development. C) classical approach to breakage-fusion-bridge cycle that involves several subsequent cell cycles. It is however hypothesised that chromosome end-to-end fusions may also lead to chromothripsis events. (in O.Korbel, et al.,2013)
60
Annex 2 - MOUSE SKY - Post-hybridization wash
(Modified protocol 20.07.2016)1. Wash in 0.4x SSC at 66-68ºC for 4 minutes
2. Wash in 4x SSC/Tween, in a different coplin jar, for 5 minutes with agitation (use shaker)
3. Block with 80 µL of Marvel solution with a coverslip and incubate at 37 ºC for 10 minutes.
4. Remove coverslips and dip the slides in 4x SSC/Tween for about 1 minute.
5. Apply 80-100 µL of Cy5/Antidigoxin staining reagent per slide and incubate at 37°C for 30-40 minutes.
Note 1: for 1 slide 100 µL of Marvel solution + 2,5 µL Antidigoxin (stored at -20ºC) + 5 µL SA-Cy5
Note 2: Use filter tips for Anti-digoxin! Post-detection wash I
1. 4xSSC/Tween, RT with agitation for 5 minutes – 3 times 2. Apply 80-100 µL of Pacific Blue staining reagent per slide and 3. Incubate at 37°C for 30-40 minutes
Note 1: for 1 slide 100 µL of Marvel solution + 4 µL of Pacific Blue (Pacific Blue™ F(ab’)2 Frag of Goat Anti-mouse IgG (H+L), 2mg/mL, stored at +4°C)
Note 2: Use filter tips for Pacific Blue! Post-detection wash II
1. 4xSSC/Tween, RT with agitation for 5 minutes – 3 times 2. Rinse slides briefly in milliQ water.
3. Dehydrate slides in ethanol series, 2-3 minutes each and air dry the slides.
4. Apply 20 µL of “home-made” Anti-fade DAPI or Anti-fade DAPI (vial 5) provided by the kit.