i
Infrastructure for Machine Learning and
Computer Vision
Dimitri Chikhladze
Dissertaion submitted in partial fulfillment
of the requirements for the degree of
Thesis advisor: Professor Mauro Castelli
Machine learning infrastructure for people detection and tracking.
Copyright © Dimitri Chikhladze, Faculty of Sciences and Technology, NOVA Univer-sity Lisbon.
The Faculty of Sciences and Technology and the NOVA University Lisbon have the right, perpetual and without geographical boundaries, to file and publish this dis-sertation through printed copies reproduced on paper or on digital form, or by any other means known or that may be invented, and to disseminate through scientific repositories and admit its copying and distribution for non-commercial, educational or research purposes, as long as credit is given to the author and editor.
Ac k n o w l e d g e m e n t s
Foremost, I want to thank Professor Leonardo Vanneschi who created the Masters in Advanced Analytics, and made it interesting and enjoyable for us, and my supervisor Professor Mauro Castelli who was supportive and prompt throughout writing this thesis. I thank the management, administration and all other people at NOVA IMS for all their work and help. I want to thank the team of the European startup where I did the work on which this thesis is based. Cordially, I want to thank all my coursemates from the Masters program for being cool coursemates. Last but not least, I want to thank my wife Patricia for her help and support in too many things.
A b s t r a c t
The infrastructure surrounding machine learning projects is of utmost importance: Machine learning projects require data acquisition mechanisms, software for data processing, as well as a benchmarking platform for evaluating performance of machine learning algorithms over time. In this report we describe our work aimed at developing such infrastructure for a Europe based computer vision startup specializing in human behaviour tracking. We discuss three projects comprising the work. One dedicated to creating a machine learning dataset for human behaviour monitoring, another to developing a screen-camera calibration tool, and third to setting up a benchmarking platform. The projects were integrated with the core technology of the startup, and will continue to be applied in the future.
R e s u m o
A infraestrutura para projetos demachine learning é de extrema importância para
o desenvolvimento da tecnologia: exigem-se mecanismos de aquisição de dados, soft-ware para processamento de dados e uma plataforma de benchmarking para avaliar o
desempenho de algoritmos de machine learning ao longo do tempo. No presente
re-latório, descreve-se o trabalho destinado a desenvolver essa infraestrutura para uma Startup Europeia decomputer vision, especializada em rastreamento de comportamento
humano atraves de câmeras de videos. Enfoca-se em três projetos que compõem o tra-balho: o primeiro, dedicado à criação de um conjunto de dados demachine learning
para monitoramento de comportamento humano; o segundo, sobre o desenvolvimento de uma ferramenta de calibração de câmeras e ecrã; e o terceiro, relata a criação de uma plataforma debenchmarking. Tais projetos foram integrados com a tecnologia central
C o n t e n t s
1 Introduction 1
2 Background 3
2.1 Machine learning and its infrustructure . . . 3
2.1.1 Data in machine learning. . . 4
2.1.2 Software for data processing . . . 5
2.1.3 Benchmarking platforms . . . 5
2.2 Computer vision datasets . . . 5
2.3 Human detection and tracking . . . 7
2.4 3D scanning and 3D computer vision . . . 7
3 Project I: Machine Learning Dataset for Human Detection and Tracking 9 3.1 European Startup Dataset . . . 9
3.2 Data collection . . . 10
3.3 Annotating data with training labels . . . 12
3.4 Implementation details of the European Startup Dataset . . . 13
4 Project II: Screen Camera Calibration Tool 15 4.1 Screen camera calibration parameters . . . 15
4.2 Calibration with linear regression . . . 16
4.3 Calibration tool . . . 17
4.4 Estimating 3D coordinates of points. . . 20
4.5 Transformation between camera coordinates . . . 20
4.6 Validation of calibration parameters . . . 22
5 Project III: Benchmarking Platform 25 5.1 Benchmarking platform . . . 25
5.2 Metrics and use cases . . . 25
5.3 Database . . . 26
5.4 Dashboard . . . 27
C
h
a
p
t
e
r
1
I n t r o d u c t i o n
This thesis is a report on the work which the author did at a Europe based startup, referred to further as a European Startup. The work consisted of three related projects. Here we give a general summary of these projects.
The European Startup is a computer vision and machine learning company. It is specialized in human detection and tracking software. Its core technology enables human detection and tracking in 3D using commodity depth-sensing cameras. On top of this technology the European Startup develops various products with applications in areas as diverse as automotive industry, retail, robotics and healthcare to list a few. My work at the European startup revolved around creating infrastructure for ma-chine learning and computer vision. Specifically I was working on the three projects: Project I. Machine learning dataset for people detection and tracking. We worked on the creation of a machine learning dataset for people detection and tracking, re-ferred further as the European Startup Dataset. We organized collection of diverse video data from more then 50 participants, overseeing bureaucratic, organizational and technical aspects of the data collection. We obtained screen camera calibration parameters using the tool developed in Project II. We implemented the programming interface of the dataset.
Project II. Screen camera calibration tool. We developed a screen-camera calibra-tion tool, a device used for correctly annotating the data with training labels for the supervised learning for people detection and tracking.
Project III. Benchmarking platform. We designed a benchmarking platform for evaluating machine learning algorithms for people detection and tracking. This in-cluded developing a database, data export modules, and a dashboard for visualizing
C H A P T E R 1 . I N T R O D U C T I O N
metrics for the machine learning pipelines.
Project Description
Dataset for Human Detection and Tracking
Data collection/ Data processing/ Practical 3D
computer vision.
• Created the “European Startup Dataset” designed specifically for human detection and body pose estimation.
• Organized collection of video data from more than 50 people.
• Augmented the raw video data with screen camera calibration parameters. • Implemented the programming interface
for the resulting dataset.
Screen-Camera Calibration Tool
Software development/ Computer vision/ 3D
modeling.
• Developed a tool which finds screen cam-era calibration parameters which are re-quired for computing the ground truth of the dataset.
Benchmarking Platform Practical machine learning/
Database design/ Data engineering/ Dashboard
design.
• Built a database for storing results from ML pipelines.
• Implemented data movement modules be-tween ML pipelines and the benchmark-ing platform.
• Designed a dashboard for visualization of evaluation metrics.
The rest of the report is organized into four chapter. The first chapter gives a review of methodologies and technologies relevant to the work. While, the next three chapters are dedicated to each of the projects comprising the work.
C
h
a
p
t
e
r
2
Ba c k g r o u n d
In this chapter we give an overview of topics relevant to our work. We discuss in-frustructure for machine learning. We overview computer vision datasets, and touch briefly 3D computer vision and human detection and tracking.
2.1
Machine learning and its infrustructure
By a widely cited definition, machine learning is a sub-field of computer science con-cerned with developing machines with the ability to “learn” without being explicitly programmed [12]. The importance of machine learning grew with the increase of ca-pacity and availability of computational resources, leading in the last decades to some revolutionizing practical applications. Today machine learning is a subject of inten-sive research. The technology giants and universities are actively pursuing machine learning research and development. Numerous start-ups have emerged developing machine learning based products.
A machine learning algorithm is developed for a problem related to some data generating process. Constructing a machine learning algorithm involves specifying its architecture and training it on a data obtained from the data generating process. A trained algorithm is then able to make predictions or other types of intelligent decisions on a new data from the same data generating process. The ability to perform well on a new data is calledgeneralizability, and is a crucial property of a machine
learning algorithm. On practical level, validating the performance of the algorithm is accomplished by testing it on more data.
Research and development crucially requires existence of adequate infrastructure surrounding it. Some of the important components of these infrastructure, related to the projects in this report, are:
C H A P T E R 2 . BAC KG R O U N D
• Data acquisition/ data collection framework. • Software for data processing.
• Benchmarking platform for algorithms.
2.1.1 Data in machine learning
Perhaps, the single most important item in the above list is the availability of data. Data is used for training machine learning algorithms as well as for testing and quan-titatively evaluating the performance of algorithms over time. Indeed, the importance of data for machine learning can not be overestimated. It is argued that datasets are at least as important for artificial intelligence development as advances in algorithms themselves [20].
Availability of adequate data is of utmost importance for companies which develop machine learning based products. This is true because of two reasons: Firstly, machine learning technology requires training data. Secondly, data is required to be able to test the performance of the technology at any given time, frequently for a specific use case. Testing and benchmarking is important for two purposes: For the internal use, it provides to developers and managers information about the status of the product, and the ability to see how algorithms are improving with time. For external use, company is able to provide concrete and verifiable information to its clients, investors and other stakeholders about its product for specific applications.
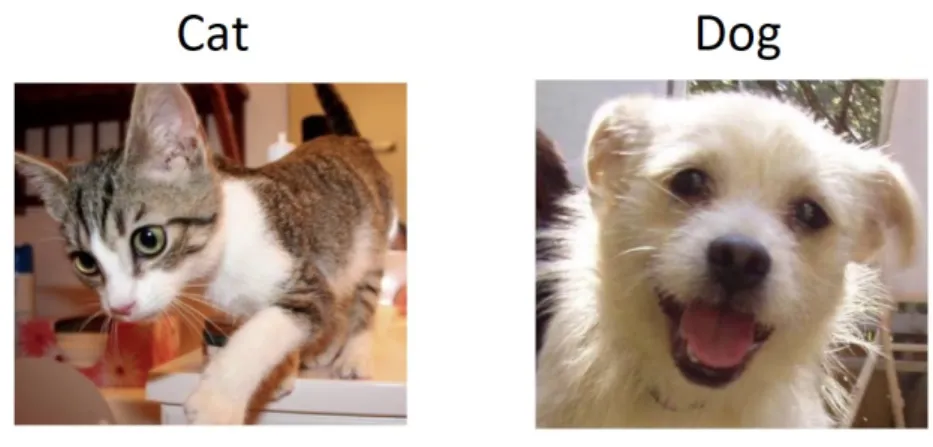
Machine learning problems involve making some kind of judgement from the data. A judgment can be classifying a datapoint into a class or making some prediction from it. This judgment is the target of the learning. Learning can be divided into two types, supervised learning and unsupervised learning. In unsupervised learning, one is learning from data that does not include explicit information about the target. While in supervised learning the function that maps the input data points to the output targets is learned from a dataset of sample input-output pairs. For unsupervised learning we only need samples of input data. While, in the supervised learning, we need a training dataset which consists of input data samples together with labels which are values of the target taken as the ground truth. The machine learning algorithm learns how to make correct judgments from such training data. As an example, for supervised image classification task, the training dataset would consist of images each of which is assigned a class label.
Building datasets for supervised learning comprises a major challenge. Labeling large datasets is a costly process, diligence is needed to automatize it, and sometimes some degree of human involvement is necessary. Methodologies used to create a dataset vary. Data may be collected in a lab in controlled experiments. Data can be sourced from the internet, or though crowdsourcing. Data can be also obtained by synthesizing it.
2 . 2 . C O M P U T E R V I S I O N DATA S E T S
Figure 2.1: Example of images labeled with classes
2.1.2 Software for data processing
Creating machine learning datasets besides human input frequently requires data processing software for various tasks. The Project II in this report is an example of de-veloping such software for the computer vision task of camera object pose estimation.
2.1.3 Benchmarking platforms
For machine learning companies it is a good practice to have a benchmarking frame-work. Development of machine learning solutions for complex problems is a con-stantly evolving process. In this situation, existence of a proper benchmakring plat-form is important for quantifying errors, for knowing perplat-formance metrics for the current algorithms, and for seeing how the models improve over time. In addition in the industry application, there might be various use cases to which the algorithms apply. Then one needs to know what are the performance metrics for each of the use cases and how they improve over time. To achieve this one needs proper versioning system for models. One need to define use cases, and which data is relevant to each of them. One needs a database to store model results. And, one needs a dashboard for visualization of metrics.
2.2
Computer vision datasets
One of the areas where machine learning has had a tremendous influence in recent years is computer vision. In particular, the reemergence of deep learning has revo-lutionized computer vision in the last ten years or so. Modern convolutional neural networks achieved enormous leaps in pattern recognition, pattern detection and other computer vision tasks compared to what was previously possible with traditional im-age processing methods.
C H A P T E R 2 . BAC KG R O U N D
In the case of computer vision, the data on which algorithms operate are images. Supervised training and validation require image data to be annotated, as for example, for image classification each image is annotated by a label specifying its class. The up-heaval of machine learning in computer vision, besides development of new machine learning architectures and improvement in computing capacity, has been accompa-nied with creation of training datasets. A huge effort has been dedicated to the task of constructing machine learning datasets for various computer vision applications. Some of the famous computer vision datasets include MNIST, ImageNet [5], CIFAR-10 [13], Microsoft COCO [14] and many others (see [19] for a long list).
For computer vision applications, data collection involves taking images or record-ing videos, which can be seen as sequences of images. In 3D computer vision (see below) in addition to RGB images we also have depth images. For supervised learn-ing, we need labels for images or video frames in our dataset. Frequently, the raw data is not annotated with training labels directly. Rather we have annotations about the recording environment, the world. These annotations may include coordinates of world objects, coordinate transformation parameters etc. Training labels for some particular machine learning problem are then inferred from these parameters. In ad-dition, we may need to record information such as e.g. lighting conditions and time of recordings, as well as characteristics of world objects and/or persons, such as e.g. motion speed of an object and age of a person. The decision on what world information do we keep track of during the recordings is part of the data creation process.
One important characteristics of training dataset is variability. In practice, training dataset is only a tiny portion of the real data for which the algorithm is trying to learn the problem. To train a good model the training data has to represent the whole distribution of the real data which the model is trying to learn. In computer vision applications, the image or video files that we collect should show extensive degree of variation. First we should have variability in terms of environment, such as variability in lighting conditions. Secondly, we should have the problem specific variability: If for example, our model is trying to learn dogs from images, in our dataset we should have images of dogs of varied size, colour, appearing in various body position, showing from different angles etc.
In practice one also has to consider the variability of use cases of the machine learning application. For example, if we are studying human attention sensing, we will want to consider use cases for driving, retail shopping, gaming etc. Aside from training general models, it will be useful to train models for each particular use case. For this again, adequate data is needed. Therefore, we should know which part of our data is relevant to which use case.
These are some of the considerations that should be taking into account when designing and building a computer vision datasets.
2 . 3 . H U M A N D E T E C T I O N A N D T R AC K I N G
2.3
Human detection and tracking
The objective of tracking is to estimate location and pose of an object from a video. The goal of human tracking is to identify the pose of various body parts (e.g. hands, fingers, head etc.) at each frame, and track it over time. In applications, eventually the object of interest may be behaviour recognition, attention sensing, intention estimation, emotion recognition etc. Computationally however, estimating pose of body parts involves finding the locations of certain body landmarks, and estimating parameters defining the pose of the body parts. Tracking then involves estimating these data at each frame over time.
Figure 2.2: Human pose estimation and tracking from the work [1]
Human detection and tracking dataset consists of images or videos containing people. The training labels are parameters such as locations of human bodies and human body landmarks and parameters for various body poses such as head pose.
A number of machine learning datasets exist for human detection and tracking, many of them specialized to more specific problems such as human pose estimation [2], face recognition (see [6]), head pose estimation [8], [9] eye tracking [7], [21] and so on. They have been collected using different methods and means. Some of these were cre-ated through controlled data collections, others were collected though crowdsourcing method. While, in other approaches image synthesizing was used.
2.4
3D scanning and 3D computer vision
3D scanning is a technology which captures geometric shape of objects in the real world and, possibly, analyses characteristics such as color. There are number of 3D
C H A P T E R 2 . BAC KG R O U N D
scanning methods includinglaser scanning, time-of-flight and structures-light
technolo-gies (for more details see [3]).
Popular modern commodity 3D scanning cameras are Realsence from Intel and Kinect from Microsoft. The former is supported by an open source cross platform SDK [10]. These cameras have both 3D scanning depth stream and an RGB stream. From the depth measurements and the camera pin-hole model it is possible to computepoint clouds, which are sets of points in a 3D space. Point clouds are used to create polygon meshes. Besides, 3D scanning devices calibrate between depth and RGB streams, and
generatetexture mapping which defines color information for the surface scanned by
the depth sensor.
3D computer graphics store geometric objects in 3D space, such as meshes, for visualizing them in 2D or performing computational operations on them.
3D provides more information than 2D images which can be exploited in comput-ing. Machine learning, and in particular deep learning, has been applied to depth and color data for recognition, detection, tracking etc.
C
h
a
p
t
e
r
3
P r o j e c t I : M a c h i n e L e a r n i n g Da ta s e t f o r
Hu m a n D e t e c t i o n a n d Tr a c k i n g
The European Startup uses data for training and benchmarking its machine learning algorithms. The objective of the project was to create a specialized machine learning dataset for human detection and tracking. The dataset was to be comprised of depth and RGB video recordings, together with annotations about the recording environment. The goal was to record more than 50 people of different appearance within varying ambient conditions and contexts.1
3.1
European Startup Dataset
As a result of the project a Euroean Startup Dataset was created. The dataset consists of a few hundred recordings by depth sensing cameras. Each recording is around 2 minutes long. Each of them has an RGB stream and a depth stream. The recordings show a person doing simple body movements following the content displayed on a screen placed in front of them. The recordings show great degree of diversity. Par-ticipants of varied age, gender, race and appearance where recorded. The recording ambient lighting conditions variability was maximized. Furthermore, recordings were differentiated by the screen type and the recording scenario. Three types of screens were used for the recordings. The recordings were done in a number of scenarios, for each of which specified instructions were given to the participants as to how to move their head or body during the experiment.
Besides the videos, the following data is included in the dataset. For each recording, screen camera pose parameters are saved. For each recording, pixel coordinates of
1For confidentiality reasons we can not reveal the exact nature of the dataset, therefore the description of the dataset and the data collection process are given in general terms.
C H A P T E R 3 . P R O J E C T I : M AC H I N E L E A R N I N G DATA S E T F O R H U M A N D E T E C T I O N A N D T R AC K I N G
elements of the screen content are saved for about 50 different frames at which it is assumed that the participant’s body position was engaged with the screen content as specified by the experiment rules. For each recording, there is a metadata containing information about the screen type, the recording scenario, as well as recording ambient conditions and the participant’s characteristics. The following tables summarize the European Startup Dataset:
European Startup Dataset More than 200 Recordings
Recording RGB video Depth video
Frame-wise parameters of the screen content Participant
Scenario Screen type
3.2
Data collection
The data was collected from more than 50 people over three weeks period. The dataset was collected from volunteer participants.
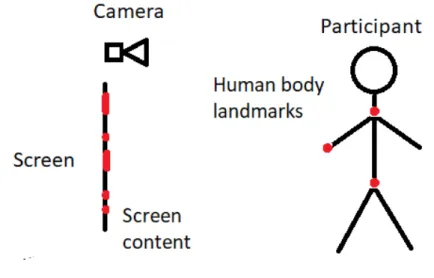
With each participant a few video recording experiments were made. During a recording experiment the participant watches content displayed on a screen which changes through time. The participant moves their body following the shown content, for example pointing some body parts at various elements of the screen content. A depth sensing camera is placed in front of the screen facing the participant, and records the participant (see Figure3.1). From time to time the participant “clicks” on an input device (such as a mouse or a space bar) confirming that at that moment their body was positioned relative to the screen content as specified by the rules. This is when the pixel coordinates of the screen elements are saved. In this way we ensure that at the moments of "clicks"the participant was properly engaged with the screen content. Then, from the position of the elements of the screen content in the world it is possible to infer the ground truth body pose parameters which are the training labels for our algorithms.
3 . 2 . DATA C O L L E C T I O N
Figure 3.1: Recording scene. The participant is asked to change the body position following the content shown on the screen.
As a result, the raw data produced by the recording experiments consisted of frame-wise annotated video recordings, which make up the corpus of the European Startup Dataset.
The data collection process involved a number of design and organizational chal-lenges and decisions. One had to make sure that the process was followed correctly by the participants and the organizers. For this purpose a precise data collection protocol was designed. In particular the protocol defined the rules of engagement by partici-pants with the screen content. Also on the organizational side, since our experiments involved people, data privacy issues had to be taken into account. In particular we ensured that our activity was GDPR compatible [18].
Logistically, one had to secure locations, volunteer participants and other material for the recordings. These resources had to exhibit sufficient diversity. The recording environments had to be diverse in illumination condition. As for participants, one had to secure people of diverse age, gender, ethnicity and other characteristics. In addition, we want to record the person at different times (over few days). The screen on which the engagement content was displayed had to be of different size and mobility. We used a LCD screen, a projector and a tablet which could be hand hold by the participant.
Resource Diversity Dimension
Location Illumination condition
Participant Age, Gender, Ethnicity, Clothing type, Time of recording
C H A P T E R 3 . P R O J E C T I : M AC H I N E L E A R N I N G DATA S E T F O R H U M A N D E T E C T I O N A N D T R AC K I N G
Diversity was also needed in the contexts in which participants appeared in the recordings. We sought to record people in diverse angles of view, body positions, motion etc. To this end we designed a few “scenarios” which a participant had to follow. These scenarios were specified in the data collection protocol. They imitated various situations in the real life in which people can be found, such as driving or retail shopping.
Context Diversity Dimension
Recording scenario Mobility, Screen content spacial variance, body and head positions of participants
Another component of data collection was screen-camera calibration. The purpose of this is to estimate the pose of the screen (translation and rotation) with respect to the camera. This is needed to transform the 2D pixel coordinates of the screen content elements saved by the recording software to the 3D coordinates of the world which we can actually use. The screen-camera calibration is accomplished with the help of the tool developed in Project II. More details about the tool appear there. From the data collection perspective, every time a recording scene was set up, the data necessary for running the calibration tool later was collected. This involved making some recordings at the recording scene at the start and the end of the experiments (recording “external” and “internal” recordings for calibration as it is described in Chapter 2). These recordings were also added to the dataset.
Data collection lasted for over 3 weeks, during which more than 50 volunteer participants were recorded. We collected a rich dataset of video recordings.
3.3
Annotating data with training labels
Besides the videos the machine learning datasets should have training labels. For our human detection and tracking dataset a label consists of locations of body landmarks and pose parameters of body parts. The locations of body landmarks are estimated through machine learning pipelines. The body pose parameters v = (v1, v2, . . . , vk) then
are inferred from the coordinates of the elements of the screen content (p1, p2. . . , pn)
and the body landmark coordinates (x1, x2, . . . xm)
v = F(p1, p2. . . , pn, x1, x2, . . . xm). (3.1)
The coordinates are in the World Coordinates System (WCS) which is defined and fixed with respect to the recording camera. The screen content parameters p can be estimated from the 2D pixel coordinates of the elements of the screen content which are stored in the dataset once we know the transformation from the screen
3 . 4 . I M P L E M E N TAT I O N D E TA I L S O F T H E E U R O P E A N S TA R T U P DATA S E T
pixel coordinates to the WCS. This transformation is determined by thescreen-camera calibration parameters, and are specific for each recording setup. They are estimated
through the calibration tool developed in Project II.
To find the calibration parameters, the calibration tool was run for each recording setup on the calibration videos recorded during the data collection. The scree-camera calibration parameters were found for each recording setup and added to the dataset.
Figure 3.2: Example of screen camera calibration parameters.
3.4
Implementation details of the European Startup Dataset
A machine learning dataset needs a programming interface to allow researchers to work with it easily. European Startup Dataset interface was implemented in python. The implementation included programmatic abstractions of dataset components, such as videos, participants, recording scenarios etc.
C
h
a
p
t
e
r
4
P r o j e c t I I : S c r e e n Ca m e r a Ca l i b r a t i o n
To o l
As explained in Section 3.3 in the previous chapter, to infer training labels in the European Startup Dataset we need to be able to compute screen-camera calibration parameters for each recorded video in it. The objective of this project was to design a method for computing these parameters, and build a tool for this task.
4.1
Screen camera calibration parameters
We recap the recording process to define the problem more precisely.
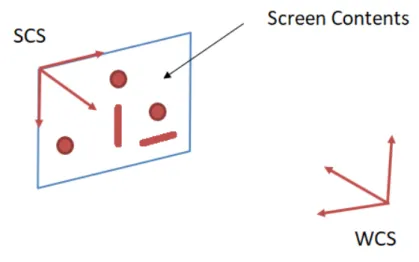
During a recording the participant, i.e. the person whose recording is made, is standing in from of the screen on which engagement content is shown. A depth sensing camera is placed in front of the screen facing the participant. This recording scene is diagrammatically shown on Figure3.1. The two coordinate systems are associated to the screen and the camera. The world coordinate system (WCS) is associated to the position of the recording camera. The screen coordinate system (SCS) is associated to the screen. It’s origin is defined to be the top-left corner of the screen. It’s X axis is directed along the top horizontal edge of the screen and the Y axis is directed along the left vertical edge of the screen. It’s Z axis is perpendicular to the screen and facing towards the participant.
The purpose of the calibration tool is to estimate a transformation between WCS and SCS. This can be given by a rotation matrix R and a translation vector t. Then, the training labels, which are the body pose parameters, can be found by3.1, plugging in for each element of the screen content p (which is given in WCS)
C H A P T E R 4 . P R O J E C T I I : S C R E E N C A M E R A C A L I B R AT I O N T O O L
Figure 4.1: Visual target and the World and the Screen coordinate systems
p = R(p0) + T , (4.1)
where p0 is the coordinates of the elements of the screen content in SCS. The latter itself is estimated from the pixel coordinates of the element of the screen q = (qx, qy)
by
p0 = (p0x, p0y, 0) = (kxqx, kyqy, 0), (4.2)
where kxand ky are scaling factors which convert pixels to metric units. To summarize,
p is computed from the saved pixel coordinates q as:
px py pz = RKq + t = R00 R01 R02 R10 R11 R12 R20 R21 R22 kx 0 0 0 ky 0 0 0 0 qx qy 0 + t0 t1 t2 (4.3)
The rotation matrix R, the translation vector t, as well as the scaling factors k are the parameters which are estimated by the screen camera calibration tool.
4.2
Calibration with linear regression
As we can see in the equation4.3p depends on q linearly. If we set X = RK, for each i = 0 . . . 2 we have
pi= X0iq0+ X0iq1+ ti. (4.4)
which we can jointly rewrite as
pi= X00q0i0+ X01qi00 + X10q0i1+ X11q0i1+ X20qi20 + X21q0i2+ t1d0i+ t2d1i+ t3d2i. (4.5) 16
4 . 3 . C A L I B R AT I O N T O O L where q0ij= qi, if i = j 0, otherwise. (4.6) and dij= 1, if i = j 0, otherwise. (4.7)
As we see this is a linear regression problem. Assuming that we have a dataset of true (q, p) pairs we can find the least squares solution with the usual pseudo-inverse formula. Solving gives us the first two column vectors X1 and X2 of X. The first column vectors R0 and R1of R are then normalizations of these, while kx and ky are
their norms. The third column R2of R is obtained as the cross product of R0and R1. Or, mathematically: kx= kX0k ky= kX1k R0= X0/kx R1= X1/ky R2= R0×R1 (4.8)
4.3
Calibration tool
The calibration tool works by collecting point correspondences (q, p) and then solving the linear regression problem . A point correspondence is a pair (q, p) wherein q is a pixel coordinates of a point on a screen, and p is the 3D WCS coordinates of the same point.
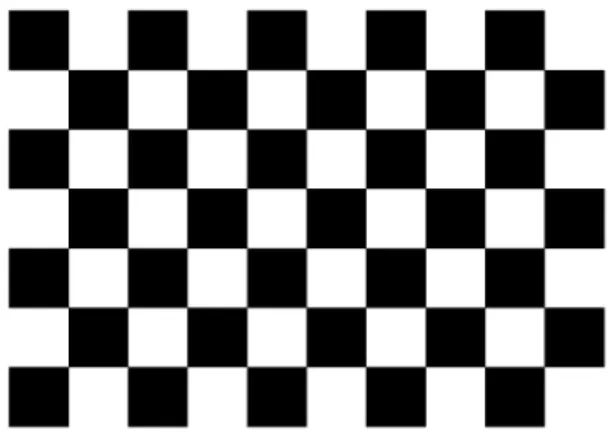
Figure 4.2: Checkerboard pattern. The coordinates of corners of a checkerboard are collected by the calibration tool.
C H A P T E R 4 . P R O J E C T I I : S C R E E N C A M E R A C A L I B R AT I O N T O O L
The points whose coordinates the calibration tool will collect are the corners of a checkerboard pattern displayed on a screen. The pixel coordinates of the checkerboard pattern are known. The problem is estimating their coordinates in WCS.
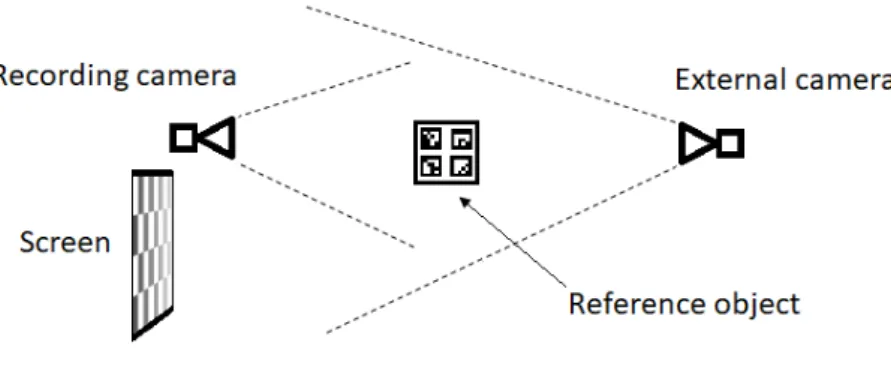
The WCS is fixed with respect to the recording camera. Therefore, we can estimate the WCS coordinates of a point which is visible by the recording camera. However, the recording camera is placed so that it can not see the screen. This means that we can not directly estimate coordinates of a point on a screen by the recording camera. The solution is to introduce another camera in the calibration process. The new camera, which we will call an external camera is placed so that it sees the screen. At the same time we get a reference object, and place it so that both the recording camera and exter-nal camera see it (see Figure4.3). Then, the external camera can find coordinates of a point on a screen with respect to its own coordinate system. While since the reference object is visible by the both cameras, both of them can estimate coordinates of some reference points in their respective coordinate systems. These reference coordinates then are used to find the transformation from the external camera coordinate system to the recording camera coordinate system.
Figure 4.3: Calibration process
The calibration tool was implemented with an online mode and a recording-based mode. In the online mode the calibration tool runs on live video data from the two cameras, and collects point correspondences on the fly. In the recorded mode, the calibration tool runs on saved recordings.
In the online mode the calibration process works as follows:
1. The Screen and the Recording Camera are placed fixed in the positions in which they will be during the data collection experiment.
2. The External Camera is positioned in a way that it usually sees the Screen. 3. The Reference Object is placed in a way that it is usually visible by the both
cameras.
4 . 3 . C A L I B R AT I O N T O O L
4. When the calibration tool starts, at each live video frame the external camera estimates coordinates of the corners of the checkerboard pattern, while both the external camera and the recording camera estimate coordinates of some refer-ence points on the referrefer-ence object (see Section4.5). Using the coordinates of the reference points estimated by both cameras a transformation is found be-tween the coordinate systems of the two cameras. Using this transformation the checkerboard pattern coordinates are transformed to the WCS, and are saved. At the same time the pixel coordinates of the checkerboard pattern are saved. After few frames, the points collection stops. The collected point correspondences are fed to the linear regression which finds the calibration parameters.
In the recorded mode the tool runs on recorded videos. Another difference of the recorded mode from the live mode is that, the reference point coordinates are not estimated by the recording camera frame-wise, but over the whole video. This means that, unlike in the live mode, the reference object has to stay fixed at the position. Calibration in the recorded mode is done as follows:
1. The Screen and the Recording Camera are placed fixed in the positions in which they will be during the data collection experiment.
2. The Reference Object is placed in a way that it is visible to the Recording Camera, and it stays fixed.
3. The Recording Camera makes a recording of the Reference Object and a video is saved, called Internal Video.
4. The External Camera is positioned in a way that it usually sees both the Reference Object and the Screen, it makes a recording and saves a video, called External Video.
5. The calibration tool is run on the recorded data. First it processes the Internal Video from where it get the coordinates of the Reference Points on the Reference Object. Next it processes the External Video. At each frame the coordinates of the corners of the Checkerboard patterns are estimated. At the same time the coordinates of the reference points are estimated and using them a transforma-tion between the two cameras is found. Then, using this transformatransforma-tion the WCS coordinates of the checkerboard corners at that frame are estimated and saved together with the pixel coordinates. After the video data is processed and point correspondences are collected the calibration parameters are found by solving the linear regression problem.
C H A P T E R 4 . P R O J E C T I I : S C R E E N C A M E R A C A L I B R AT I O N T O O L
4.4
Estimating 3D coordinates of points
As described above, the calibration process involves estimating 3D coordinates of points, such as corners of a checkerboard pattern, or reference points on a reference object.
At each video frame a checkerboard pattern is detected using OpenCV functions [15]. This returns 2D coordinates of the chessboard corners on the image. Then, the 3D coordinates are estimated either by Perspective-n-Point method or by using depth video data.
Perspective-n-Point method can estimate 3D coordinates of points from their 2D projections on the image. OpenCV function SolvePnP is the OpenCV implementation of this method which we used [15].
The alternative is to use 3D depth data, which brings extra precision to the estima-tion. In this approach, first using the depth data we estimate the plane on which the points lie (our points always lie on a plane, either the screen or the reference object which is planar), by fitting a plane to the point cloud of the depth frame. Next we find rays from the focal point of the camera going through the 2D projection of the points. Finally we find the 3D coordinates as intersection points of the estimated plane and the rays.
4.5
Transformation between camera coordinates
The calibration tool involves finding a transformation form coordinate system of one camera to another one. This is done with help of a reference object. Reference object is an object which is seen by both cameras. The two cameras estimate certain points on the reference object, using which then the transformation is found.
Figure 4.4: Examples of Aruco markers. 20
4 . 5 . T R A N S F O R M AT I O N B E T W E E N C A M E R A C O O R D I N AT E S
The reference object should have points which are easily detectable by a camera. We used a cardboard to which we attached Aruco markers [16], [17]. Aruco marker is a synthetic square marker composed by a wide black border and a inner binary matrix which determines its identifier. Aruco library [17] contains functions for detecting, pose estimation and visualization of Aruco markers, making Aruco good tool for pose estimation applications.
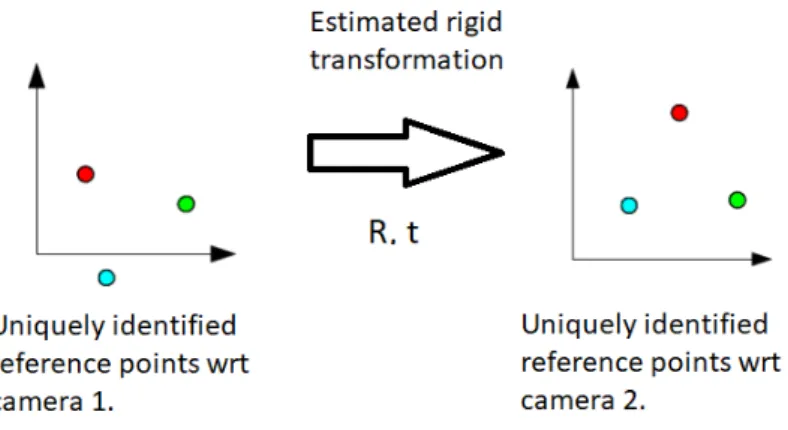
We placed several Aruco markers on our reference object, each Aruco marker gives four reference points, each of which is uniquely identifiable by the Aruco marker identifier and the determined index among each four on the same marker. In the calibration tool, both cameras detect these uniquely identified reference points. As a result we get 3D coordinates of the reference points in the two camera coordinate systems. The transformation between these coordinate system then is found with Kabsch algorithm [11] described below.
Figure 4.5: Transformation between the camera coordinate systems.
Given two sets of corresponding points A and B (as for example, reference points estimated by the two cameras in our setting above) the algorithm to find optimal rotation and translation which aligns A to B proceeds as follows:
1. Find centroids of both sets:
centroidA= mean(A),
centroidB= mean(B).
(4.9)
2. Bring both sets to the origin:
Ao= A − centroidA,
Bo= B − centroidB.
C H A P T E R 4 . P R O J E C T I I : S C R E E N C A M E R A C A L I B R AT I O N T O O L
3. Find cross-covariance matrix
H = AToBo.
4. Calculate the SVD of the covariance matrix
H = U SVT.
5. Find the rotation matrix by
R = V UT.
6. If det(R) < 0, correct R by multiplying it’s third column by −1. 7. Find the translation by
t = centroidB−R(centroidA).
4.6
Validation of calibration parameters
To validate the calibration parameters we implemented a visualization tool. It runs on a video made by the external camera filming the recording camera and the screen. At each frame the screen position is estimated, then using the found screen camera calibration parameters the position of the camera is found and a camera schema is drawn on the frame. This allows us to make a visual comparison of the estimated camera position and the real camera position.
4 . 6 . VA L I DAT I O N O F C A L I B R AT I O N PA R A M E T E R S
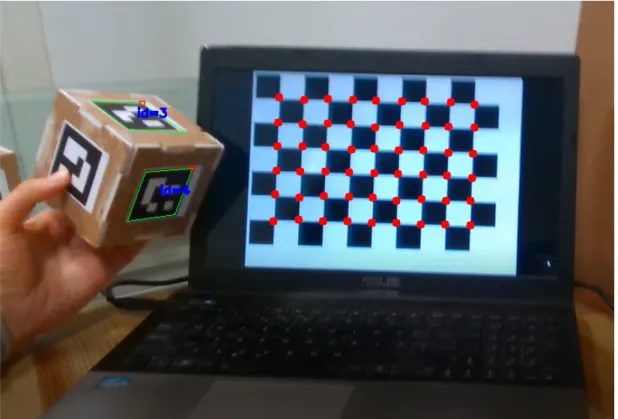
Figure 4.6: Example of detecting a chessboard patterns and Aruco markers. OpenCV library is used.
C
h
a
p
t
e
r
5
P r o j e c t I I I : Be n c h m a r k i n g P l a t f o r m
The European Startup develops a cutting-edge technology which it strives to constantly improve. The European Startup needs a mechanism which will allow seeing how its technology improves over time, both for internal and external use. The aim of this project was to kick start a platform for this purpose.
5.1
Benchmarking platform
The benchmarking platform consists of a database for storing the output of machine learning pipelines and a dashboard for visualization of metrics, as well as data move-ment modules for import and export of data.
5.2
Metrics and use cases
The processing pipeline requires multiple steps, such as face detection, head pose esti-mation, body pose estiesti-mation, etc. The metrics of interests are quantitative measures of the performance of the algorithms, such as how many false detections are made, how many misses the system exhibits, or how large are the errors. In the benchmarking platform we keep track of these metrics.
People detection and tracking pipelines change as algorithms improve over time. In the benchmarking platform each pipeline should be uniquely identifiable. This is done using a git tag.
In addition we designed several use cases, each of them corresponding to applica-tion use case such as behaviour tracking while driving, or behaviour tracking while retail shopping. A use case is identified by it relevant data. For example, for a retail
C H A P T E R 5 . P R O J E C T I I I : B E N C H M A R K I N G P L AT F O R M
Figure 5.1: Benchmarking platform
shopping use case we might use videos which show people passing by the camera as they would in a retail store aisles.
5.3
Database
We built a database for our benchmarking platform using MySQL. Our database should stores results of people detection and tracking experiments as well as our pipelines, use cases, persons (experiment participants) and recordings. The database should also reflect the relationship among these data. During the design process, data to be stored was identified and data interrelationships defined. We build a normalized database with a few tables. Some of the tables are for data from machine learning pipelines, for example a table for body landmark coordinates and a table for head pose parameters. Other tables are for metadata, for example a table for pipelines and a table for recordings.
We implemented data export module which exports the results of running a pipeline to the database. We also implemented modules that import metadata about persons and recordings from the European Startup Dataset. Use case definintion mechanism was also implemented.
5 . 4 . DA S H B OA R D
5.4
Dashboard
We designed a dashboard with python Plotly Dash library [4]. The dashboard visual-izes the people detection and tracking metrics. The user of the dashboard can specify pipeline and/or use case etc. Dash will load data for that specific request, compute metrics and visualize them.
Plotly Dash defines dashboard page layout similarly to HTML, and it comes with various widgets for data visualization. Dash supports reactive programming style which we followed in our implementation. The input of the user is automatically propagated throughout the dashboard and metrics and visualizations are updated.
C o n c lu s i o n
In the work described in this report we created a machine learning dataset for peo-ple detection and tracking, impeo-plemented tools necessary to create the dataset, impeo-ple- imple-mented dataset programming interface, build a database to store results of machine learning pipelines, and created a dashboard to visualize performance metrics of people detection and tracking machine learning algorithms.
The machine learning dataset will be used for training people detection and track-ing machine learntrack-ing algorithms as well as for testtrack-ing them. For the later purpose, the benchmakring platform was set up, which consists of a database and a dashboard. All of these is a part of an infrastructure surrounding the core technology of the European computer vision startup. Developing this infrastructure is a continuous process which will progress with the growth of the company and its technology.
B i b l i o g r a p h y
[1] M. Andriluka, S. Roth, and B. Schiele. “Monocular 3d pose estimation and tracking by detection.” In: Computer Vision and Pattern Recognition (CVPR), 2010 IEEE Conference on. IEEE. 2010, pp. 623–630.
[2] M. Andriluka, L. Pishchulin, P. Gehler, and B. Schiele. “2D Human Pose Esti-mation: New Benchmark and State of the Art Analysis.” In:IEEE Conference on Computer Vision and Pattern Recognition (CVPR). 2014.
[3] B. Curless. “From range scans to 3D models.” In: ACM SIGGRAPH Computer Graphics 33.4 (1999), pp. 38–41.
[4] Dash by Plotly. [Online; accessed 13-October-2018]. u r l: https://plot.ly/
products/dash/.
[5] J. Deng, W. Dong, R. Socher, L.-J. Li, K. Li, and L. Fei-Fei. “Imagenet: A large-scale hierarchical image database.” In:Computer Vision and Pattern Recognition, 2009. CVPR 2009. IEEE Conference on. Ieee. 2009, pp. 248–255.
[6] Face Recognition Databases.http://www.face-rec.org/databases/. Accessed:
2018-11-15.
[7] G. Fanelli, J. Gall, and L. Van Gool. “Real time head pose estimation with random regression forests.” In:Computer Vision and Pattern Recognition (CVPR), 2011 IEEE Conference on. IEEE. 2011, pp. 617–624.
[8] G. Fanelli, M. Dantone, J. Gall, A. Fossati, and L. Van Gool. “Random Forests for Real Time 3D Face Analysis.” In:Int. J. Comput. Vision 101.3 (2013), pp. 437–
458.
[9] Idiap research institute. https://www.idiap.ch/dataset/headpose. https : / / www . idiap.ch/dataset/headpose. Accessed: 2018-11-15.
[10] Intel RealSense team.Intel RealSense SDK.https://github.com/IntelRealSense/ librealsense. 2018.
[11] W. Kabsch. “A solution for the best rotation to relate two sets of vectors.” In:Acta Crystallographica Section A: Crystal Physics, Diffraction, Theoretical and General Crystallography 32.5 (1976), pp. 922–923.
B I B L I O G R A P H Y
[12] J. R. Koza, F. H. Bennett, D. Andre, and M. A. Keane. “Automated design of both the topology and sizing of analog electrical circuits using genetic programming.”
In:Artificial Intelligence in Design’96. Springer, 1996, pp. 151–170.
[13] A. Krizhevsky, V. Nair, and G. Hinton. “The CIFAR-10 dataset.” In: online: http://www. cs. toronto. edu/kriz/cifar. html (2014).
[14] T.-Y. Lin, M. Maire, S. Belongie, J. Hays, P. Perona, D. Ramanan, P. Dollár, and C. L. Zitnick. “Microsoft coco: Common objects in context.” In:European confer-ence on computer vision. Springer. 2014, pp. 740–755.
[15] OpenCV. Camera Calibration and 3D Reconstruction. [Online; accessed
13-October-2018]. 2018. u r l: https : / / docs . opencv . org / master / d9 / d0c / group__calib3d.html.
[16] OpenCV.Detection of ArUco Markers. [Online; accessed 13-October-2018]. 2018.
u r l: https://docs.opencv.org/3.1.0/d5/dae/tutorial_aruco_detection.
html.
[17] OpenCV contributors.OpenCV ArUco Marker Detection.https://github.com/ opencv/opencv_contrib/tree/master/modules/aruco. 2018.
[18] “Regulation (EU) 2016/679 of the European Parliament and of the Council of 27 April 2016 on the protection of natural persons with regard to the processing of personal data and on the free movement of such data, and repealing Direc-tive 95/46/EC (General Data Protection Regulation).” In:Official Journal of the European Union L119 (4 May 2016), pp. 1–88.
[19] Wikipedia contributors.List of datasets for machine learning research — Wikipedia,
The Free Encyclopedia. [Online; accessed 13-September-2018]. 2018. url:https:
/ / en . wikipedia . org / wiki / List _ of _ datasets _ for _ machine _ learning _ research&oldid=863887793.
[20] A. Wissner-Gross.Datasets over Algorithms, Edge.com. 2016. u r l:https://www. edge.org/response-detail/26587(visited on 10/13/2018).
[21] X. Zhang, Y. Sugano, M. Fritz, and A. Bulling. “Appearance-based gaze estima-tion in the wild.” In:Proceedings of the IEEE Conference on Computer Vision and Pattern Recognition. 2015, pp. 4511–4520.