DOES WILD RABBIT POPULATION SIZE AFFECT CONNECTIVITY?
MACHADO R. *, SANTOS P.
†*ICAAM - Instituto de Ciências Agrárias e Ambientais Mediterrânicas, Universidade de Évora, Núcleo da Mitra, Ap. 94, 7006-554 Évora, Portugal.
†Departamento de Paisagem, Ambiente e Ordenamento, Escola de Ciências e Tecnologia, ICAAM - Instituto de Ciências
Agrárias e Ambientais Mediterrânicas, Instituto de Investigação e Formação Avançada, Universidade de Évora, Ap. 94, 7002-554 Évora, Portugal.
Abstract: Wild rabbit is a relevant species in the Iberian Peninsula due to its ecological and economic roles. Conservationists and game managers therefore have a shared interest in assuring the existence of resilient and sustainable populations. Although management principles and guidelines are mostly known and understood, often the results are not as good as expected. Local abundance can vary significantly even in short periods, while the colonisation of adjacent territories is uncommon, probably due to the territorial behaviour of the species. Aware that the foundation of nuclei requires interaction among individuals, we hypothesised that rabbit abundance plays a significant part in population connectivity. In order to find out whether the population size affects nuclei connectivity, we conducted a graph theory-based connectivity analysis. The results confirm that connectivity grows with rabbit abundance, but only to a certain degree, and there is a spatial separation of the nuclei regardless of the population size. These outcomes suggest that a comprehensive wild rabbit population increment plan should address both the abundance and spatial distribution, but should not aim at achieving a continuous distribution of wild rabbit with constant or similar abundance. Regarding specific management actions, we argue that in restocking operations new nuclei should be located within dispersal range from the existing ones to promote inter-nuclei connectivity, but not too close, as the nuclei segregation tendency is likely to persist due to the species’ territoriality.
Key Words: Oryctolagus cuniculus, graph theory, population recovery, connectivity metrics, game management.
INTRODUCTION
The wild rabbit (Oryctolagus cuniculus) is considered a keystone species in the Iberian Peninsula. It has a relevant role in the region’s food webs as prey for more than 30 predators (Delibes-Mateos et al., 2008a). Emblematic predator species such as the Spanish imperial eagle (Aquila adalberti ) and the Iberian lynx (Lynx pardinus) depend on reasonably dense populations of wild rabbits (Ferrer and Negro, 2004). Wild rabbit has great economic importance in the Iberian Peninsula (Ferreira, 2012; Garrido, 2012) and therefore in Portugal (Paixão et al., 2009).
Over recent decades, rabbit populations have declined significantly in the Iberian Peninsula due to the combined effect of human-induced habitat changes and two viral diseases, myxomatosis and rabbit haemorrhagic disease (Delibes-Mateos et al., 2009). The diseases strongly influenced the reduction of rabbit populations, and factors such as agriculture intensification and habitat loss, fragmentation and degradation helped to accelerate the decline (Moreno et al., 2007). Recovery strategies based on habitat management, predator control, vaccination and restocking have been put into practice for hunting and conservation purposes (Calvete et al., 1997). Thousands of rabbits have been released in the Iberian Peninsula in an attempt to reverse the population decline (Delibes-Mateos et al., 2008b). Habitat improvement measures are often implemented due to their effectiveness in increasing local doi:10.4995/wrs.2019.12068
© WRSA, UPV, 2003
Correspondence: R.D.P. Machado, rdpm@uevora.pt. Received July 2019 - Accepted October 2019. https://doi.org/10.4995/wrs.2019.12068
R
a b b i t
S
cience
rabbit abundance (Moreno and Villafuerte, 1995; Moreno et al., 2004; Catalán et al., 2008; Godinho et al., 2013; Encarnação et al., 2019). Furthermore, a proper landscape structure is vital to fulfil the species’ requirements, allowing populations to expand their range. This is closely related to the concept of landscape connectivity, understood as the degree to which the landscape allows or impedes movement among resource patches (Taylor et al., 1993). Connectivity has direct influence on animal dispersal and population persistence (Johnson et al., 1992) and for that reason it is a major concern for biodiversity conservation (Fahrig and Merriam, 1985). Previous works in the same region with the purpose of enhancing rabbit populations on the scale of hunting estates have shown difficulty in obtaining a spatially continuous rabbit presence in contiguous areas similarly suitable for the species (Godinho et al., 2013). This often gives rise to higher local densities rather than occupancy of adjacent areas, which results in a fragmented rather than a continuous distribution (Encarnação et al., 2012). Besides core ecological requirements, to some extent common to all species, there are species-specific behavioural factors influencing the rabbit’s spatial distribution and dynamics.
Wild rabbits display very complex social behaviour that significantly influences their routine. It is a territorial species that lives in groups and defends territories against its conspecifics (Mitchell-Jones et al., 1999). They mark their territories with latrines placed at different distances from the burrows located at the territory’s core (Mykytowycz, 1968). The size of territories depends on the resources available and other factors, but they tend to be relatively small.
Several authors measured wild rabbit home ranges and reported diameters ranging from 45 m to more than 100 m (Künkele and von Holst, 1996; Lombardi et al., 2007; ; Devillard et al., 2008; Monclús and de Miguel, 2013). Using foreign rabbits for acclimation study purposes in this study area, we previously obtained results of average home ranges of 5190 m2. Assuming, for simplification, that the territories have a circular shape, this area represents a
diameter of 81.3 m (Machado et al., 2017). Moreover, Godinho et al. (2013), studying wild rabbit population nuclei in this region, verified that distances to shelter (artificial warrens and ecotone) smaller than 100 m, and ideally smaller than 50 m, have an important role in the presence and abundance of wild rabbit in low-density populations. Comparable dispersal distances for native wild rabbits are difficult to obtain because most studies that have addressed species dispersal mechanisms used introduced animals, took place in confined areas or featured some other kind of influence, such as predator control measures. Calvete et al. (1997) measured average dispersal distances of 435 m and Moreno et al. (2004) registered maximum travelled distances of 1027 m in Spain, while in a previous study in Portugal, in the same study area, we recorded a maximum distance travelled of 180 m, using foreign rabbits during the acclimation period (Machado et al., 2017). Wild rabbit natal dispersal is male biased, although many females also disperse. Künkele and von Holst (1996) verified that females usually move to a neighbouring colony, whereas males may move further away, suggesting some kind of inbreeding avoidance mechanism. New settlements depend on habitat suitability, but also require social interactions between members of different groups. Thus, the greater the number of individuals in the neighbouring nuclei, the greater the probability of interaction among them.
Taking into consideration wild rabbit social behaviour, space use and dispersal strategies, we hypothesise that population size directly influences connectivity despite the naturally fragmented distribution the species is likely to display. To analyse whether connectivity grows with population size, we used a graph theory-based approach, conducting multi-temporal nuclei functional connectivity evaluations based on the spatial distribution of nuclei and population size.
MATERIAL AND METHODS
Study area
The study area is a 1224 ha hunting estate in the Caldeirão mountain range in southern Portugal (37°13’N, 7°58’W) that is part of the Natura 2000 Network (Caldeirão Nature 2000 site - 986 ha and the Barrocal Nature 2000 site - 238 ha) (Figure 1). The altitude ranges from 160 to 430 m and shallow leptosols are dominant, covering about 78% of the area (soils map of Portugal 1:50 000; SROA, 1961). Land cover mainly consists of cork oak (Quercus suber ) forest (41.6%), bushes (35.3%), agricultural fields (orchards and crops: 20.6%), and Pinus sp. (2.3%) (land cover map
of Portugal 2007; IGP, 2010). The landscape is generally homogeneous, with large extensions of bushes that are also present in most of the cork oak forest. The presence of orchards and crops associated with a number of streams and reservoirs within the broader monotonous landscape constitutes a land-cover mosaic, suitable for wild rabbit. However, some steep slopes and mainly the thin soils over rock make it difficult for rabbits to dig warrens and thus reach high densities. The species abundance was very low probably due to this limiting factor (see Godinho et al., 2013), although other reasons such as overhunting might have been contributing. In order to boost the rabbit populations, habitat improvement measures were implemented in the hunting estate. When this study’s fieldwork was conducted, besides adjustments in the hunting pressure, there were also artificial warrens, watering points and pastures in place.
Rabbit survey
Previously identified rabbit nuclei were monitored through 57 transects established along dirt tracks (total length = 16234 m, mean = 285 m). Direct methods (Barrio et al., 2010) were not applied due to the generalised low density of rabbits and because visibility was highly reduced due to the rough topography and dense vegetation cover. Instead, we used latrine counts as a proxy variable of wild rabbit relative abundance. Latrine counts have been used widely as an expeditious indirect method to estimate rabbit abundance (Palma et al., 1999; Virgós et al., 2003; Calvete et al., 2006; Beja et al., 2007; Beja et al., 2008; Sarmento et al., 2012; Guerrero-Casado et al., 2013). Despite the method’s limitations with respect to regional scale programmes, it can still detect local variations in densities (Fernandez-de-Simon et al., 2011), as required in this study. We considered a latrine as an accumulation of at least 20 excrements over a surface of 200×300 mm (Virgós et al., 2003). Assuming that larger latrines indicate a larger number of users (Tarroso et al., 2006), we attributed higher weights to larger latrines. The weights were attributed based on the work by Sarmento et al., (2004) and are as follows: 1: 20-50 droppings; 2: 51-125 droppings and 3: >125 droppings. The surveys were conducted twice a year: in June, which is considered the season of highest rabbit abundance and December, when kindling usually begins (Beltrán, 1991). A total of 10 surveys were completed from December 2009 to June 2014.
Connectivity analysis
Recently, graph theory has been successfully used in connectivity assessment, modelling and planning (Foltête et al., 2014). Based on its foundations, graph theory represents a landscape as a set of patches (nodes) and connections between them (links). The species’ dispersal ability (measured, estimated or simulated) is required data to measure functional connectivity. With this data, nodes are classified as connected or disconnected and a value of importance can thus be assigned to each node and link. In this study, we used the Conefor Sensinode 2.6 software (Saura and Torné, 2009), which has been widely used with success to analyse connectivity regarding fauna (Van Looy et al., 2014; Espinoza et al., 2015; Segurado et al., 2015), flora and vegetation (Aavik et al., 2014; Crouzeilles et al., 2014) and protected areas (Piquer-Rodríguez et al., 2012; Santini et al., 2016).
The inputs for the connectivity analysis were obtained via ArcGIS 10.2 software (ESRI, Redlands, CA, USA). A 100 m radius buffer centred on each latrine (which is a 3.14 ha circular area) was calculated. This area is intentionally slightly larger than the territory sizes mentioned previously, in order to set boundaries which rabbits are less likely to cross during daily routine activities, but only as a consequence of dispersal movements. Overlapping buffers produced by nearby latrines were merged together, assuming they belonged to the same territory. These areas with confirmed presence of rabbits are understood as nodes and their count is an important metric, the number of nodes (NN). Closely related to NN is the metric number of links (NL). Whenever movement between two nodes is possible
1
there is a link. Based on past data and taking the rough relief into account, we defined 500 m as the maximum dispersal distance. This means that there is a link whenever two nodes are located at a distance of 500 m or less. A group of linked nodes represents a connected region, where social interactions among rabbits can take place, and is called a component. An isolated nucleus forms a component in itself (Pascual-Hortal and Saura, 2006). The metric number of components (NC) was also computed. If a component relies on a node to assure its integrity, that node is called a connector. If a connector territory disappears, it fragments the component and generates at least two separate components. Connectors are geometrically relevant to maintain the nuclei network solid and the number of connectors (NCon) was also calculated. The Integral Index of Connectivity (IIC), ranging from 0 to 1, brings it all together and provides an assessment of the global connectivity in each survey (Pascual-Hortal and Saura, 2006). Weighted latrine count (WLC), a proxy of population size, was defined as node attribute.
. IIC A nl a a 1 L ij i j j n i n 2 1 1 =
|
=|
= + (1)n: total number of nodes; ai and aj: proxy of abundance/population size of nodes i and j; nlij: number of links (shortest path) between nodes i and j; AL: Proxy of the total abundance/population size in each survey (WLC).
The first step of the multi-temporal analysis consisted of computing the index and parameters for the ten surveys. The comparison between the variation in IIC, (∂IIC), and total population size between two surveys (∂WLC) provides insights on how the connectivity is supported by the total population size or by the spatial arrangement of the nuclei. ∂IIC is given by the difference between the IIC value after and before the spatial change, divided by the IIC value before the change (Saura et al., 2011):
IIC IIC IIC IIC
∂
before after before
= - (2)
In addition, a correlation matrix was built in order to verify and interpret the interactions observed between the connectivity outputs (NN, NL, NC, Ncon, and IIC) and the population size (WLC). This procedure was executed using R software (R Core Team 2018) and the package and ‘Hmisc’ (Harrel, 2014).
RESULTS
Rabbit survey
The 57 transects, with an overall length of 16234 m, were surveyed twice a year, in June and December. A total of 1717 latrines were registered (n1 = 943, n2 = 407 and n3 = 367) during the monitoring period. Generally, the number of latrines recorded increased in June and decreased in December (Figure 2), following the natural species seasonal fluctuation. The only exception happened between the surveys 2 and 3, probably due to the generalised rabbit population increment that was taking place at that time in the hunting estate.
Connectivity analysis
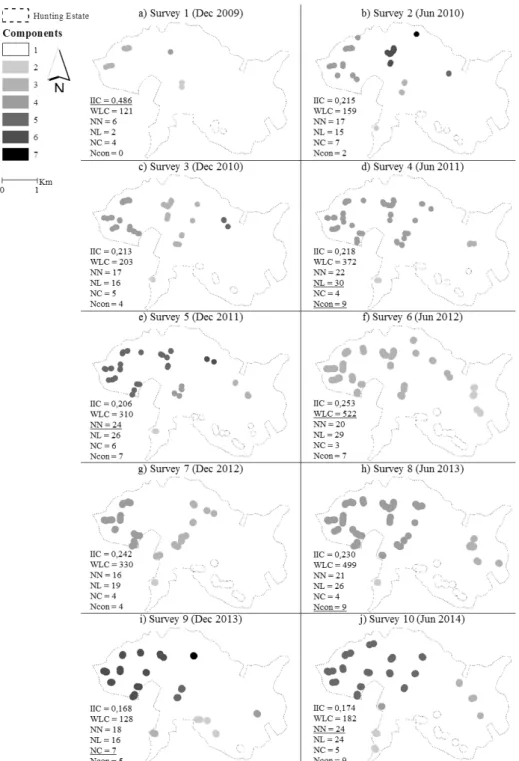
The connectivity analysis involved the calculation of IIC as well as the breakdown of the number of nodes, links, components and connectors present in each survey (Figure 3). ∂IIC and ∂WLC were also calculated for a better understanding of the dynamics present in the hunting estate (Table 1).
The NN increased greatly during the study period. The highest values were found in the fifth and in the tenth survey. The NL was small in the beginning but rapidly increased due to the emergence of new nuclei near the existing ones. The maximum NL registered was 30, in the Figure 2: Number of latrines and weighted latrines found
Figure 3: Spatial representation of the connectivity assessment results. IIC: Integral Index of Connectivity; WLC: weighted latrine count; NN: number of nodes; NL: number of links; NC: number of components; Ncon: number of connectors. The highest values observed in all the surveys are underlined.
fourth survey dated June 2011. The NC ranged between three and seven and, unlike the NN, NL and Ncon did not suffer a clear increment during the study period. Ncon exhibited some oscillations, but seemed to be increasing as more territories were being established. Connectivity, measured by IIC, had an initial clear decline, then displayed some oscillations between a narrow range of values, until it declined again between the 8th and 9th surveys. In the
discussion section we explain why the first decline was beneficial and the second was harmful.
According to Table 1, the 1st survey results, our baseline, differ from those of all the other surveys, particularly
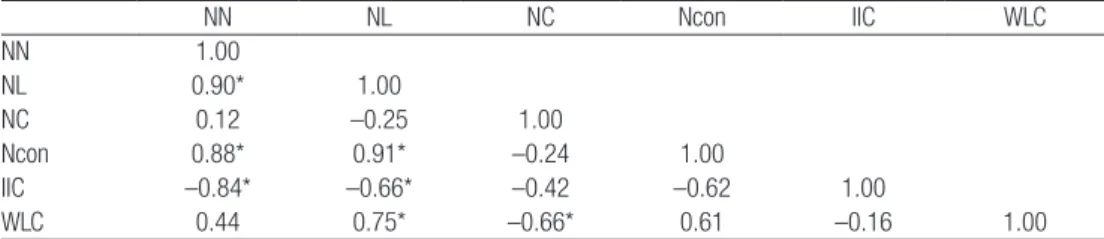
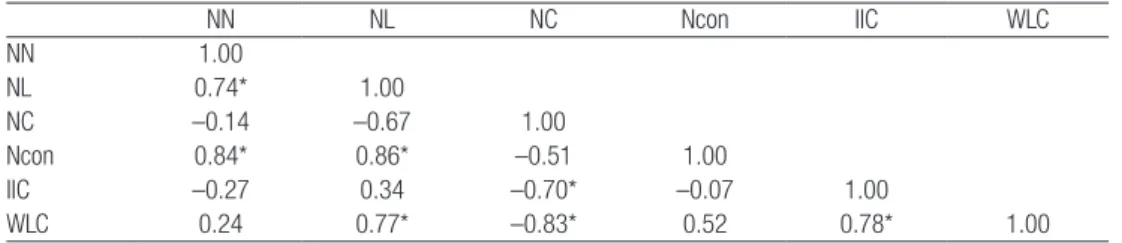
regarding IIC. It represented a particular situation with very low abundance (WLC), yet reasonable connectivity (IIC) due to nuclei scarcity (low NN). This is hardly consistent and comparable with the dynamics in both population size and nuclei connectivity originated by the habitat improvement measures. For this reason, we calculated two correlation matrices, showing the relations between pairs of metrics associated to connectivity and also the proxy of population size, one with all the data available from the ten surveys (Table 2) and another in which we purposely left out the survey 1 data (Table 3).
Both tables share some trends such as positive and significant correlations between NN and NL, NN and Ncon, NL and Ncon and NL and WLC. Likewise, significant and negative correlations such as NC and WLC can be found in both tables. Overall, the correlation direction is often the same although the strength varies. However, there are three cases where the values are considerably different and even opposite. One is the correlation between NN and NC, weak in both tables but with different directions. The other two concern the main metrics used in our approach, IIC and WLC. The correlation between NL and IIC is negative and significant in the first table and positive in the second. In fact, most times IIC varied in the same direction of the NL (Table 1), as more linked nuclei are beneficial to connectivity. The correlation between WLC and IIC is weak and negative in Table 2 but strong, positive and even significant in Table 3. Comparing ∂WLC (relative variation in WLC) and ∂IIC (relative variation in IIC), it is clear they have the same direction in the majority of the surveys (Table 1). Once again, the value of the 1st survey differs substantially from the others
and points towards false conclusions. Table 1: Connectivity analysis.
Survey NN NL NC Ncon IIC WLC ∂IIC ∂WLC
1 (Dec 2009) 6 2 4 0 0.486† 121 - -2 (Jun -2010) 17 15 7† 2 0.215 159 –0.558† 0.31 3 (Dec 2010) 17 16 5 4 0.213 203 –0.010 0.28 4 (Jun 2011) 22 30† 4 9† 0.218 372 0.023 0.83† 5 (Dec 2011) 24† 26 6 7 0.206 310 –0.051 –0.17 6 (Jun 2012) 20 29 3 7 0.253 522† 0.224 0.68 7 (Dec 2012) 16 19 4 4 0.242 330 –0.042 –0.37 8 (Jun 2013) 21 26 4 9† 0.230 499 –0.050 0.51 9 (Dec 2013) 18 16 7† 5 0.168 128 –0.269 –0.74 10 (Jun2014) 24† 24 5 9† 0.174 182 0.036 0.42
NN: number of nodes; NL: number of links; NC: number of components; Ncon: number of connectors; IIC: Integral Index od Connectivity; WLC: Weighted latrine count; ∂IIC: relative variation in IIC; ∂WLC: relative variation in WLC.
†highest values observed in all the surveys.
Table 2: Correlation matrix. Ten surveys (1 to 10).
NN NL NC Ncon IIC WLC NN 1.00 NL 0.90* 1.00 NC 0.12 –0.25 1.00 Ncon 0.88* 0.91* –0.24 1.00 IIC –0.84* –0.66* –0.42 –0.62 1.00 WLC 0.44 0.75* –0.66* 0.61 –0.16 1.00
NN: number of nodes; NL: number of links; NC: number of components; Ncon: number of connectors; IIC: Integral Index of Connectivity; WLC: Weighted latrine count. * P-value<0.05.
DISCUSSION
Rabbit abundance typically fluctuates seasonally and yearly oscillations in nuclei are expected to happen to some degree. It is known that season influences wild rabbit presence and abundance (Beltrán, 1991; Gonçalves et al., 2002; Godinho et al., 2013). We took that into consideration while interpreting the results, but did not account for it in the study design, as our goal was not to find out how much of the rabbit abundance variation is explained by season but instead to look at the global picture of the monitoring period and look for patterns and trends.
The amount of nuclei (NN) displayed an increasing trend (Table 1) and is negatively correlated to IIC (r=–0.27) (Table 2), which means the majority of the new nuclei did not contribute to increasing global connectivity, probably because they were isolated and/or sparsely populated. The NL also increased during the study period due to the emergence of new nuclei (r=0.74) and had a positive correlation with IIC (r=0.34), which shows that many new territories were in fact connected, providing possibilities for dispersal movements to nearby nuclei. A negative correlation between connected regions, components and IIC (r=-0.70) suggests that component fusion contributed to the connectivity increment. The way to promote component merging is by filling the gaps, building nuclei in between them that may act like stepping stones (connectors). The strategy of providing conditions for rabbit expansion to nearby areas turned out to be successful, as shown by the negative correlations between NC and NCon (r=-0.51) and between NN and NC (r=-0.14). Because the role of connectors is to link components together, Ncon is highly correlated to NL (r=0.86). IIC and NL are positively correlated (r=0.34), which was expected due to the intrinsic importance of links to connectivity. Regarding population size, it is expected that more individuals will be synonymous with more nuclei, (r=0.24), and that ultimately this is reflected in higher connectivity levels (r=0.78). The key aspect to highlight is that although IIC is influenced by population size, the segregation between nuclei remains even when the population increased considerably.
There were three phases during the monitoring period. The first was characterised by a markedly increasing population trend in the first four surveys, which we attribute to the habitat improvement measures that were being implemented. The habitat suitability increment allowed established nuclei to strengthen and probably helped wandering rabbits to organise themselves in new nuclei. There was an increment of NN, NL and Ncon. The second phase showed some stability and natural seasonal fluctuations, with population size and connectivity displaying higher values in summer and lower in winter. The third phase encompasses the last three surveys and is characterised by a negative trend due to a strong incidence of rabbit haemorrhagic disease (Abrantes et al., 2013; Delibes-Mateos et al., 2014; Guerrero-Casado et al., 2016). Comparing the summers of 2013 and 2014, the NN and NC slightly increased, the NL slightly decreased, the Ncon did not change but the IIC decreased substantially. This shows that the more spatial and geometric aspects of connectivity did not vary much and that the low population size was the major factor responsible for the overall decrement in connectivity. The nuclei still existed but were less populated, reducing the probability of dispersion and interaction. The population collapse gave rise to a functional connectivity failure in the network of nuclei that was being consolidated and improved before the epizooty.
Table 3: Correlation matrix. Nine surveys (2 to 10).
NN NL NC Ncon IIC WLC NN 1.00 NL 0.74* 1.00 NC –0.14 –0.67 1.00 Ncon 0.84* 0.86* –0.51 1.00 IIC –0.27 0.34 –0.70* –0.07 1.00 WLC 0.24 0.77* –0.83* 0.52 0.78* 1.00
NN: number of nodes; NL: number of links; NC: number of components; Ncon: number of connectors; IIC: Integral Index of Connectivity; WLC: Weighted latrine count. *P-value<0.05
CONCLUSIONS AND MANAGEMENT RECOMMENDATIONS
The present work led to two main conclusions: i) Connectivity grows, to a certain extent, with rabbit abundance. ii) There is nuclei spatial segregation regardless of the population size.
Therefore, the general management recommendation is that a sustainable wild rabbit population increment must focus on both abundance and spatial distribution. On the one hand, nuclei should be located close enough to each other to allow interaction between individuals from different nuclei. On the other hand, managers should not expect to achieve a continuous distribution of wild rabbit, as the spatial segregation of the nuclei is likely to stand regardless of the population size. Practical recommendations in line with this chain of thought are: Artificial warrens, usually used for restocking with foreign rabbits, should be built within dispersal range from existing nuclei, but not too close. Carrying out habitat improvement measures (pastures, watering points, etc.) in places where a new nucleus would be geometrically valuable for the entire nuclei network. Avoid trying to build and promote isolated nuclei. Consider whether it is most advantageous for the global connectivity to build new nuclei or to strengthen existing ones. As a final note, we would like to state that although we do not know to what extent our findings can be extrapolated to other places, we believe the procedure and the reasoning behind it can be helpful to game managers and conservationists.
Acknowledgements: This work was funded by FEDER Funds through the Operational Programme for Competitiveness Factors - COMPETE and National Funds through FCT - Foundation for Science and Technology under the Strategic Projects PEst-C/AGR/UI0115/2011 and PEst-OE/AGR/UI0115/2014. Rui Machado also holds a scholarship (SFRH/BD/137807/2018) granted by FCT. Finally, we would like to thank the Associação de Caçadores de Querença for their valuable support with the fieldwork.
REFERENCES
Aavik T., Holderegger R., Bolliger J. 2014. The structural and functional connectivity of the grassland plant Lychnis flos-cuculi. Heredity, 112: 471-478.
https://doi.org//10.1038/hdy.2013.120
Abrantes J., Lopes A.M., Dalton K.P., Melo P., Correia J.J., Ramada M., Alves P.C., Parra F., Esteves P.J. 2013. New variant of rabbit hemorrhagic disease virus, Portugal, 2012-2013 [letter]. Emerg. Infect. Dis., 19: 1900-1902.
https://doi.org/10.3201/eid1911.130908
Barrio I.C., Acevedo P., Tortosa F.S. 2010. Assessment of methods for estimating wild rabbit population abundance in agricultural landscapes. Eur. J. Wildlife Res., 56: 335-340.
https://doi.org/10.1007/s10344-009-0327-7
Beja P., Gordinho L., Reino L., Loureiro F., Santos-Reis M., Borralho R. 2008. Predator abundance in relation to small game management in southern Portugal: conservation implications. Eur. J. Wildlife Res., 55: 227-238.
https://doi.org/10.1007/s10344-008-0236-1
Beja P., Pais M., Palma L. 2007. Rabbit Oryctolagus cuniculus habitats in Mediterranean scrubland: the role of scrub structure and composition. Wildlife Biol., 13: 28-37. https://doi.
org/10.2981/0909-6396(2007)13[28:ROCHIM]2.0.CO;2
Beltrán J.F. 1991. Temporal abundance pattern of the wild rabbit in Doñana, SW Spain. Mammalia, 55: 591-599.
https://doi.org/10.1515/mamm.1991.55.4.591
Calvete C., Pelayo E., Sampietro J. 2006. Habitat factors related to wild rabbit population trends after the initial impact of rabbit haemorrhagic disease. Wildlife Res., 33: 467-474.
https://doi.org/10.1071/WR05107
Calvete C., Villafuerte R., Lucientes J., Osácar J.J. 1997. Effectiveness of traditional wild rabbit restocking in Spain. J. Zool., 241: 271-277.
https://doi.org/10.1111/j.1469-7998.1997.tb01957.x
Catalán I., Rodríguez-Hidalgo P., Tortosa F.S. 2008. Is habitat management an effective tool for wild rabbit (Oryctolagus
cuniculus) population reinforcement? Eur. J. Wildlife Res., 54: 449-453. https://doi.org/10.1007/s10344-007-0169-0
Crouzeilles R., Prevedello J.A., Figueiredo M. de S.L., Lorini M.L., Grelle C.E.V. 2014. The effects of the number, size and isolation of patches along a gradient of native vegetation cover: How can we increment habitat availability? Landsc. Ecol., 29:
479-489. https://doi.org/10.1007/s10980-013-9978-6
Delibes M., Hiraldo F. 1981. The rabbit as prey in the Iberian Mediterranean ecosystem. In: Myers K., MacInnes C.D. (ed).
Proceedings of the World Lagomorph Conference. University of Guelph, Ontario, 614-622.
Delibes-Mateos M., Delibes M., Ferreras P., Villafuerte R. 2008a. Key role of European rabbits in the conservation of the Western Mediterranean basin hotspot. Conserv. Biol,. 22: 1106-1117.
https://doi.org/10.1111/j.1523-1739.2008.00993.x
Delibes-Mateos M., Ferreras P., Villafuerte R. 2008b. Rabbit populations and game management : the situation after 15 years of rabbit haemorrhagic disease in central-southern Spain. Biodivers. Conserv., 17: 559-574.
https://doi.org/10.1007/s10531-007-9272-5
Delibes-Mateos M., Ferreras P., Villafuerte R. 2009. European rabbit population trends and associated factors: a review of the situation in the Iberian Peninsula. Mammal. Rev., 39:
Delibes-Mateos M., Ferreira C., Carro F., Escudero M.A., Gortázar C. 2014. Ecosystem effects of variant rabbit hemorrhagic disease virus, Iberian Peninsula. Emerg. Infect. Dis., 20:
2166-2168. https://doi.org/10.3201/eid2012.140517
Devillard S., Aubineau J., Berger F., Léonard Y., Roobrouck A., Marchandeau S. 2008. Home range of the European rabbit (Oryctolagus cuniculus) in three contrasting French populations. Mamm. Biol., 73: 128-137.
https://doi.org/10.1016/j.mambio.2007.01.003
Encarnação C., Medinas D., Alves P.C., Mira A. 2019. Does short-term habitat management for the European rabbit (Oryctolagus cuniculus) have lasting effects? Ecol. Res., 34:
296-308. https://doi.org/10.1111/1440-1703.1064
Encarnação C., Pinheiro P., Mira A. 2012. Influence of habitat management on European rabbit populations in Monchique Natura 2000 Site, southern Portugal. In 4th World Lagomorph
Conference. (BOKU - University of Natural Resources and Life Sciences, Viena)
Espinoza M., Ledee E.J.I., Simpfendorfer C.A., Tobin A.J., Heupel M.R. 2015. Contrasting movements and connectivity of reef-associated sharks using acoustic telemetry: Implications for management. Ecol. Appl., 25: 2101-2118.
https://doi.org/10.1890/14-2293.1
Fahrig L., Merriam G. 1985. Habitat patch connectivity and population survival. Ecology 66: 1762-1768.
https://doi.org/10.2307/2937372
Fernandez-de-Simon J., Díaz-Ruiz F., Cirilli F., Tortosa F.S., Villafuerte R., Delibes-Mateos M., Ferreras P. 2011. Towards a standardized index of European rabbit abundance in Iberian Mediterranean habitats. Eur. J. Wildlife Res., 57: 1091-1100.
https://doi.org/10.1007/s10344-011-0524-z
Ferreira C. 2012. European rabbit research in the Iberian Peninsula: state of the art and future perspectives. Eur. J. Wildlife Res.,
58: 885-895. https://doi.org/10.1007/s10344-012-0664-9
Ferreira C., Alves P.C. 2009. Influence of habitat management on the abundance and diet of wild rabbit (Oryctolagus cuniculus algirus) populations in Mediterranean ecosystems. Eur. J. Wildlife Res.,
55: 487-496. https://doi.org/10.1007/s10344-009-0257-4
Ferrer M., Negro J.J. 2004. The near extinction of two large European predators: super specialists pay a price. Conserv. Biol., 18:
344-349. https://doi.org/10.1111/j.1523-1739.2004.00096.x
Foltête J.C., Girardet X., Clauzel C. 2014. A methodological framework for the use of landscape graphs in land-use planning. Landscape Urban Plan., 124: 140-150.
https://doi.org/10.1016/j.landurbplan.2013.12.012
Garrido J.L. 2012. La caza. Sector económico. Valoración por subsectores. FEDENCA-EEC, Madrid.
Godinho S., Mestre F., Ferreira J.P., Machado R., Santos P. 2013. Effectiveness of habitat management in the recovery of low-density populations of wild rabbit. Eur. J. Wildlife Res., 59:
847-858. https://doi.org/10.1007/s10344-013-0738-3
Gonçalves H., Alves P.C., Rocha A. 2002. Seasonal variation in the reproductive activity of the wild rabbit (Oryctolagus cuniculus
algirus) in a Mediterranean ecosystem. Wildlife Res., 29: 165-173. https://doi.org/10.1071/WR00048
Guerrero-Casado J., Carpio A.J., Ruiz-Aizpurua L., Tortosa F.S. 2013. Restocking a keystone species in a biodiversity hotspot: Recovering the European rabbit on a landscape scale. J. Nat. Conserv., 21: 444-448.
https://doi.org/10.1016/j.jnc.2013.07.006
Guerrero-Casado J., Carpio A.J., Tortosa F.S. 2016. Recent negative trends of wild rabbit populations in southern Spain after the arrival of the new variant of the rabbit hemorrhagic disease virus RHDV2. Mamm. Biol., 81: 361-364.
https://doi.org/10.1016/j.mambio.2016.03.006
Harrel F.E. 2014. Hmisc: A package of miscellaneous R functions. Programs available from http://biostat.mc.vanderbilt.edu/
Hmisc.
Johnson A.R., Wiens J.A., Milne B.T., Crist T.O. 1992. Animal movements and population dynamics in heterogeneous landscapes. Landsc. Ecol., 7: 63-75.
https://doi.org/10.1007/BF02573958
Künkele J., von Holst D. 1996. Natal dispersal in the European wild rabbit. Anim. Behav., 51: 1047-1059.
https://doi.org/10.1006/anbe.1996.0106
Lombardi L., Fernández N., Moreno S. 2007. Habitat use and spatial behaviour in the European rabbit in three Mediterranean environments. Basic Appl. Ecol., 8: 453-463.
https://doi.org/10.1016/j.baae.2006.09.004
Van Looy K., Piffady J., Cavillon C., Tormos T., Landry P.,Souchon Y. 2014. Integrated modelling of functional and structural connectivity of river corridors for European otter recovery. Ecol. Modell., 273: 228-235.
https://doi.org/10.1016/j.ecolmodel.2013.11.010
Machado R., Magalhães P., Godinho S., Santos P. 2017. Wild rabbit restocking: suitable acclimation conditions foster adaptive behaviour and improve survival of captive reared rabbits. World Rabbit Sci., 25: 407-414.
https://doi.org/10.4995/wrs.2017.4107
Mitchell-Jones A., Amori G., Bogdanowicz W., Kryštufek B., Reijnders, PJH Spitzenberger F., Stubbe M., Thissen J., Vohralik V., Zima J. 1999. The Atlas of European Mammals.
Academic Press: London, UK.
Moleón M., Sánchez-Zapata J.A., Real J., García-Charton J.A., Gil-Sánchez J.M., Palma L., Bautista J., Bayle P. 2009. Large-scale spatio-temporal shifts in the diet of a predator mediated by an emerging infectious disease of its main prey. J. Biogeogr., 36: 1502-1515.
https://doi.org/10.1111/j.1365-2699.2009.02078.x
Monclús R., de Miguel F.J. 2013. Distribución espacial de las letrinas de conejo (Oryctolagus cuniculus) en el monte de Valdelatas (Madrid). Galemys, 15: 157-165.
Moreno S., Beltrán J.F., Cotilla I., Kuffner B., Laffite R., Jordán G., Ayala J., Quintero C., Jiménez A., Castro F., Cabezas S., Villafuerte R. 2007. Long-term decline of European wild rabbit (Oryctolagus cuniculus) in south-western Spain. Wildlife Res.,
34: 652-658. https://doi.org/10.1071/WR06142
Moreno S., Villafuerte R. 1995. Traditional management of scrubland for the conservation of rabbits and their predators in Doñana National Park, Spain. Biol. Conserv.,73: 81-85.
https://doi.org/10.1016/0006-3207(95)90069-1
Moreno S., Villafuerte R., Cabezas S., Lombardi L. 2004. Wild rabbit restocking for predator conservation in Spain. Biol. Conserv. 118:
183-193. https://doi.org/10.1016/j.biocon.2003.07.020
Mykytowycz R. 1968. Territorial marking by rabbits. Sci. Am., 218:
116-126.
Paixão R., Godinho S., Santos P. 2009. Is the Nature 2000 Network associated with small-game bag results? Eur. J. Wildlife Res.,
55: 553-559. https://doi.org/10.1007/s10344-009-0274-3
Palma L., Beja P., Rodrigues M. 1999. The use of sighting data to analyse Iberian lynx habitat and distribution. J. Appl. Ecol. 36: 812-824.
Pascual-Hortal L., Saura S. 2006. Comparison and development of new graph-based landscape connectivity indices : towards the priorization of habitat patches and corridors for conservation. Landsc. Ecol., 21: 959-967.
https://doi.org/10.1007/s10980-006-0013-z
Piquer-Rodríguez M., Kuemmerle T., Alcaraz-Segura D., Zurita-Milla R., Cabello J. 2012. Future land use effects on the connectivity of protected area networks in southeastern Spain. J. Nat. Conserv., 20: 326-336.
https://doi.org/10.1016/j.jnc.2012.07.001
R Core Team 2018. R: A language and environment for statistical computing. R Foundation for Statistical Computing, Vienna, Austria. URL https://www.R-project.org/.
Santini L., Saura S., Rondinini C. 2016. A composite network approach for assessing multi-species connectivity: An application to road defragmentation prioritisation. PLoS ONE
11: 1-15. https://doi.org/10.1371/journal.pone.0164794
Sarmento P., Cruz J., Monterroso P., Tarroso P., Negrões N., Ferreira C. 2004. The Iberian lynx in Portugal. Status survey and conservation action plan. Instituto da Conservação da Natureza (ICN).
Sarmento P., Cruz J., Paula A., Eira C., Capinha M., Ambrósio I., Ferreira C., Fonseca C. 2012. Occupancy, colonization and extinction patterns of rabbit populations: implications for Iberian lynx conservation. Eur. J. Wildlife Res. 58: 523-533.
https://doi.org/10.1007/s10344-011-0599-6
Saura S., Estreguil C., Mouton C., and Rodríguez-Freire M. 2011. Network analysis to assess landscape connectivity trends: Application to European forests (1990-2000). Ecol. Indic., 11:
407-416. https://doi.org/10.1016/j.ecolind.2010.06.011
Saura S., Torné J. 2009. Conefor Sensinode 2.2: A software package for quantifying the importance of habitat patches for landscape connectivity. Environ. Model. Softw., 24: 135-139.
https://doi.org/10.1016/j.envsoft.2008.05.005
Segurado P., Branco P., Avelar A.P., Ferreira M.T. 2015. Historical changes in the functional connectivity of rivers based on spatial network analysis and the past occurrences of diadromous species in Portugal. Aquat. Sci., 77: 427-440.
https://doi.org/10.1007/s00027-014-0371-6
Tarroso P., Ferreira C., Paupério J. 2006. Métodos de monitorização das populações de coelho-bravo. In ‘Gestão de populações
de coelho-bravo (Oryctolagus cuniculus algirus)’. Eds C. Ferreira and P.C. Alves. pp. 81-100. Federação Alentejana de Caçadores.
Taylor P.D., Fahrig L., Henein K., Merriam G. 1993. Connectivity Is a Vital Element of Landscape Structure. Oikos 68: 571-573.
https://doi.org/10.2307/3544927
Vicente J.R., Fernandes R.F., Randin C.F., Broennimann O., Gonçalves J., Marcos B., Pôças I., Alves P., Guisan A., Honrado J.P. 2013. Will climate change drive alien invasive plants into areas of high protection value? An improved model-based regional assessment to prioritise the management of invasions. J. Environ. Manage., 131:
185-195. https://doi.org/10.1016/j.jenvman.2013.09.032
Villafuerte R., Lazo A., Moreno S. 1997. Influence of food abundance and quality on rabbit fluctuations: conservation and management implications in Doñana National Park (SW Spain). Rev. Ecol., 52: 345-356.
Virgós E., Cabezas-Díaz S., Malo A., Lozano J., López-Huertas D. 2003. Factors shaping European rabbit abundance in continuous and fragmented populations of central Spain. Acta Theriol., 48: 113-122.