A Work Project, presented as part of the requirements for the Award of an
International Master in Finance
from the
NOVA
– School of Business and Economics
and a
Professional Master in Finance
from the
Fundação Getulio Vargas
– São Paulo School of Economics
THE EFFECT OF ACQUISITION ANNOUNCEMENTS ON
STOCK RETURNS OF ACQUIRING FIRMS:
A SHORT- AND LONG-TERM STUDY FOR DEVELOPED AND EMERGING
COUNTRIES FOCUSING ON DOMESTIC AND CROSS-BORDER ACQUISITIONS
AND THE IMPACT OF INSTITUTIONAL ENVIRONMENT
Florian Otto
NOVA SBE Student numbers: 3363 & 29365
FGV-EESP Student number: 338939
A Project carried out on the Double Degree EESP-FGV,
under supervision of:
Professor Rafael Zambrana (NOVA SBE, Lisbon, Portugal)
Professor Joelson Sampaio (EESP-FGV, São Paulo, Brazil)
Date:
10
th
September 2017
2
Abstract
This paper uses an empirical event-study approach to investigate the effect of acquisition
announcements on the share price of bidding firms. By using a globalised set of acquirers from
14 different markets, this work aims to develop an understanding of the impact of acquisition
announcements on developed- and emerging-market acquirers. The sample contains 624
acquisition announcements with target firms located throughout the world between 1997 and
2015. The results contradict the conventional wisdom that developed-market acquirers
generally experience losses. Both emerging-market and developed-market bidders gain
significantly in the short term. Moreover, for developed-market acquirers, the announcement
of cross-border acquisitions (CBAs) yields higher abnormal returns than the announcement of
domestic acquisitions. On the other hand, emerging-market bidders gain from announcing
domestic acquisitions, and lose substantially when publishing news about CBAs. In addition,
the institutional environment is found to have an impact on acquirer returns.
Keywords
: Acquisitions, Abnormal Returns, Cross-border Acquisitions, Institutional
Environment
3
Table of Contents
1.
Introduction ... 4
2.
Literature Review and Developed Hypothesis ... 6
2.1 Acquirer Returns in Developed and Emerging Countries ... 6
2.2 Acquirer Returns in Domestic and Cross-Border Acquisitions ... 9
2.3 Institutional Environment and the Impact on Acquirer Returns in CBAs ... 10
3.
Data Collection and Summary Statistics ... 11
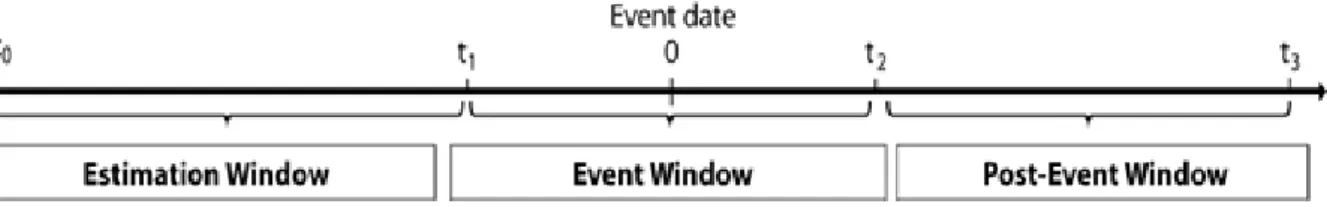
4.
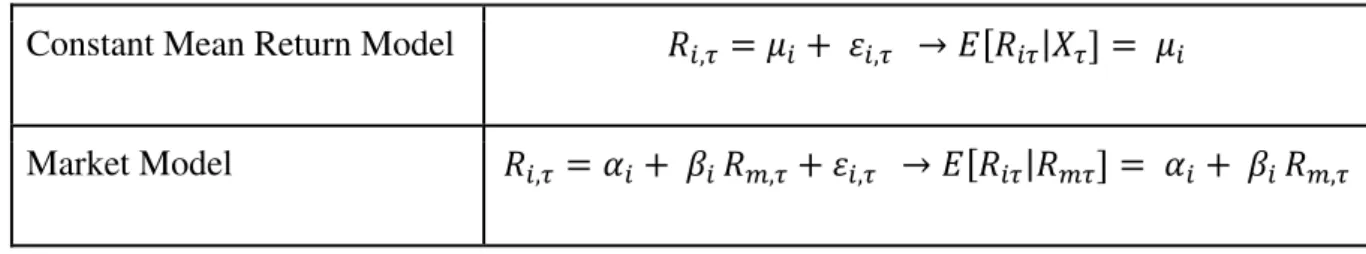
Methodology ... 13
4.1 One-Factor Market Model ... 17
4.2 Aggregated Cumulative Abnormal Returns ... 19
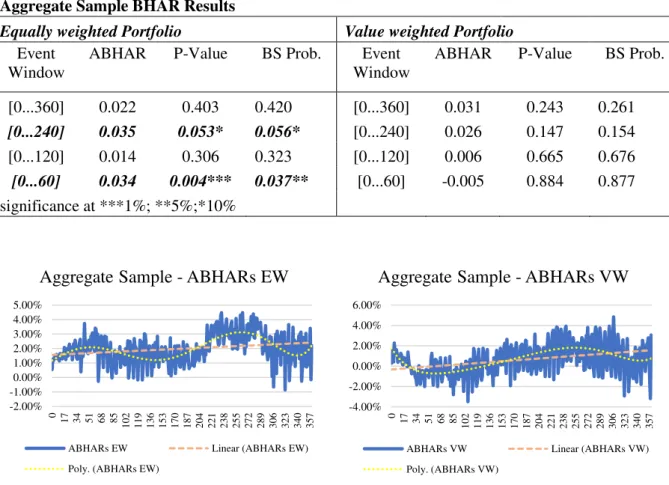
4.3 Aggregated Buy-and-hold Abnormal Returns... 19
4.4 Significance Tests ... 20
5.
Empirical Results ... 23
5.1 Empirical Results of the Aggregate Sample ... 23
5.1.1 Aggregate Sample Short-term Event Study ... 23
5.1.2 Aggregate Sample Long-term Event Study ... 25
5.2 Empirical Results of Individual Countries ... 27
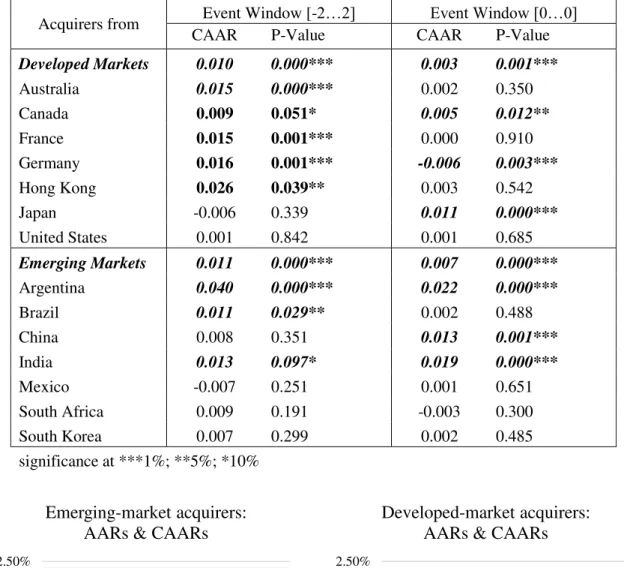
5.2.1 Individual Countries Short-term Event Study ... 27
5.2.2 Individual Countries Long-term Event Study ... 29
5.3 Domestic and Cross-border Acquisitions Results ... 33
5.3.1 Domestic and Cross-border Acquisitions Short-term Event Study ... 33
5.3.2 Domestic and Cross-border Acquisitions Long-term Event Study ... 36
5.4 Impact of Institutional Environment Results ... 39
5.4.1 Impact of Institutional Environment on Short-term Event Study ... 39
5.4.2 Impact of Institutional Environment Long-term Event Study ... 41
6.
Limitations ... 43
7.
Conclusion ... 44
References ... 46
4
1.
Introduction
Different kinds of mergers and acquisitions (M&As) are present in all industries and across all
countries and continents. In fact, M&A activities have always been an integral part of the
inorganic growth strategies of corporates throughout the world. A record year for the number
of worldwide M&A transactions was marked in 2016, when more than 48,000 deals were
announced, with a corresponding total deal value of above US$3.5 trillion.
1
Most of the deals
are small and mid-size in value and only a fraction of the total deals are considered to be
mega-deals, i.e. M&A transactions with a value higher than US$1billion.
2
Not only has the number of M&A transactions increased in recent decades, but public and
institutional interests, as well as numerous services supporting and consulting parties engaged
in M&As, have become an integral part of this kind of deal-making. Moreover, the impacts of
these events on numerous variables have been discussed in academic research, as well as in
professional information technology circles all over the world. The focus of this research has
been primarily on North American and European markets. Past studies have demonstrated that,
in most cases, announcements of acquisitions tend to destroy value for shareholders of acquiring
firms
– in both short- and long-term perspectives.
3
While public deals of listed companies create
a considerable amount of publicity and press coverage, acquirers are likely not to meet the
public
’s high expectations and fall short in generating shareholder value or synergies. This
paper contributes to the existing literature and research by analysing the stock returns of
acquiring firms at the time of acquisition announcements not only in developed markets, but
also in emerging markets and a frontier market, as noted by the Morgan Stanley Capital
1
https://imaa-institute.org/mergers-and-acquisitions-statistics/
2https://imaa-institute.org/m-and-a-statistics-transaction-type/
5
International (MSCI) market classification.
4
The paper identifies the top acquisitions by value
in 14 different markets, and compares the security performance of acquiring firms in the short
term, i.e. around the announcement date, as well as in the long term
– up to 18 months after the
official announcement. The following countries were selected to form part of the study:
Argentina, Australia, Brazil, Canada, China, France, Germany, Hong Kong, India, Japan,
Mexico, South Africa, South Korea, and the United States. The research focuses on the
aggregate sample and on each individual country, while also analysing the impact of domestic
and cross-border acquisitions (CBAs), and the impact of the institutional environment in the
target country on shareholder value creation.
The results indicate show that both developed-market and emerging-market bidders benefit
from announcing acquisitions in the short term. Moreover, when developed-market acquirers
announce cross-border acquisitions, higher abnormal returns are reported than when
announcing domestic acquisitions. For emerging-market bidders the effect is reversed. With
regard to the impact of the institutional environment in the target country, this paper finds that
when announcing CBAs in less developed countries, in terms of institutional environment,
bidders benefit substantially.
The rest of this paper is organised as follows. Chapter 2 examines the relevant literature and its
various findings on the topics being investigated. Thereafter, the method of data collection is
explained and highlights relating to important data summary statistics are provided. Chapter 4
elaborates on the empirical methodology approach. In the following chapter, empirical results
and comments on the contribution to existing literature are presented. Chapter 6 deals with
possible limitations of the study. The paper concludes with a discussion of the implications
of
this study and possibilities for further research.
6
2.
Literature Review and Developed Hypothesis
The effect of acquisition announcements on the stock prices of acquiring firms and target firms
has already been investigated by several studies and research papers in a number of countries.
This chapter first briefly describes the M&A environment, and goes on to summarise relevant
findings from various countries and the focus topics being investigated. Hypotheses are then
developed based on previous literature and findings.
The purpose of and motivation for this study are to enhance academic research on the
comparison of acquirer returns at the time of acquisition announcements between different
countries and markets. Previous research into these topics has focused primarily on specific
countries. By using a multi-country sample with announcement events from companies listed
in 14 different markets, this paper aims to establish important evidence on the impact of
acquisition announcements on acquirer returns globally. Moreover, the main research question
is then modified to analyse the influence of domestic and cross-border acquisitions and how the
institutional environment of the target country affects acquirer returns.
2.1 Acquirer Returns in Developed and Emerging Countries
Mergers and acquisitions are considered as part of what many refer to as the
‘market for
corporate control
’ (Berk & DeMarzo, 2011). The global M&A market is very active, with an
average transaction value of more than US$1 trillion per annum over the past 20 years (Berk &
DeMarzo, 2011). Considering this enormous transaction value and the publicity and press
coverage being created, it is very probable that M&A announcements have an impact on stock
returns. This impact has been extensively researched in several ways, especially in developed
countries. However, these studies often arrive at different results and contradictory outcomes.
A study by Malatesta (1983) finds significant negative abnormal returns in the long term for
7
acquiring firms, and significant negative abnormal returns as an immediate effect after M&A
announcements. Agrawel, Jaffe and Mandelker (1992) support the findings by Malatesta, and
conclude that stockholders of acquiring firms suffer a statistically significant wealth loss of
approximately 10% over the first years following an M&A announcement. Betton, Eckbo, and
Thorburn (2008), on the other hand, find that shareholders of acquiring companies realise a
significant positive 0.73% gain on their stock prices shortly after an M&A announcement.
Betton et al. (2008) argue for a small significant gain for acquirers, while Malatesta (1983) finds
significant negative abnormal returns in the short term. On the basis of the findings mentioned
above, it appears that various authors in developed countries arrive at contradictory results, at
least in the short-term. Based on these contradictions and the twenty-year time span of this
study, it is expected that positive and negative abnormal returns counter each other in the short
and long term. The existence of this counter-effect means that there should be no significant
abnormal returns for the data analysed in developed markets.
However, several studies found that in emerging markets, acquiring firms and their
shareholders do experience significant positive abnormal returns in relation to corporate
takeover actions. Simoes, Macedo-Soares, Klotzle and Pinto (2012) investigate the effect of
acquisition announcements on the acquirer
’s stock prices in Latin America. They find that in
Argentina, statistically significant abnormal returns are experienced by acquirers when the
event is announced and in the days subsequent to the acquisition
– whereas this is not the case
in Brazil. The authors identify a more efficient market in Brazil, in terms of the semi-strong
efficient market hypothesis (Simoes et al., 2012). Moreover, Brito, Batistella and Fama (2005)
conclude that in Brazil there are no significant abnormal returns for acquirers at the time of the
announcement. Therefore, Simoes et al. (2012) and Brito et al. (2005) agree that in Brazil,
8
markets seem to be efficient, with no significant abnormal returns for the acquirer around
acquisitions are announced.
In addition to the research on M&A activities in South America, several studies have also
researched the impact of M&A in Asia. Rani, Yadaf and Jain (2012) analyse share price
performance after M&A announcements in India. Their results indicate that shareholders of
acquiring firms generate a 1.6% statistically significant abnormal return during a five-day event
window. In China, Chi, Sun and Young (2011) investigate a large sample of acquiring firms in
the Chinese stock market. They identify significant positive abnormal returns six months before
the announcement date and in the respective event windows of the acquisitions (Chi et al.,
2011). They claim information leakage as a possible reason for the abnormal returns
experienced before the official announcement date. Therefore, in addition to short-term
abnormal returns in a South American country, significant evidence also exists for abnormal
returns in India and China around the announcement date.
On the basis of the above discussion and the reviewed literature this paper develops the
following three hypotheses:
H1: Using the aggregate sample of acquisition announcement events there are no significant
abnormal returns for acquirers during the respective event windows.
H1a: An analysis of the MSCI
5
sample of announcements made by companies listed in
developed countries leads to the hypothesis that there are no significant abnormal returns for
acquirers during the respective event windows.
9
H1b: Isolating from the sample those announcements made by firms listed in emerging
countries only, leads to the hypothesis that there are significant positive abnormal returns for
acquirers in emerging countries.
2.2 Acquirer Returns in Domestic and Cross-Border Acquisitions
Over and above studies investigating the general impact of an acquisition announcement on
acquirer returns in developed and emerging countries, there has also been considerable
academic research into CBAs. Cross-border acquisitions have increased to the point where they
constitute one third of the global number of deals, as discussed by Erel, Liao and Weisbach
(2012). However, academic understanding of these deals
– as against domestic M&As – is
limited and often contradictory. In developed countries, research by experts on
internationalisation predicts positive returns from cross-border acquisitions due to the positive
effects of synergies and global expansion;
6
while other experts argue that CBAs result in wealth
destruction, created by asymmetric information when evaluating foreign targets.
7
Similarly,
with regard to emerging countries, Bhagat, Malhotra and Zhu (2011) discuss evidence of a
significant positive market response to emerging-country acquirers in CBAs, while Aybar and
Ficici (2009) identify that equity markets react negatively to emerging-market CBA
announcements. Moreover, other important studies agree that CBAs create more value for
acquiring shareholders than domestic acquisitions do. This finding holds good both for
developed markets and for several emerging economies, as discussed by Moeller and
Schlingemann (2005) and Feito-Ruiz and Menéndez-Requejo (2011). In order to extend the
6