Faculdade de Engenharia da Universidade do Porto
Driver drowsiness detection using non-intrusive
signal acquisition
Licínio Manuel França de Oliveira
M
ASTER’
S THESISIntegrated Master in Bioengineering
Internal Supervisor: Jaime dos Santos Cardoso, PhD
External Supervisor: André Ribeiro Lourenço, PhD
i
Abstract
Driving a car is a complex, multifaceted and potentially risky activity requiring full mobilization of physiological and cognitive resources. Drowsiness leads to a decline in cognitive performance, being the cause of many driving accidents. In multiple European countries drowsy driving accounts for 10 to 30 % of all road accidents. A solution to this problem is the inclusion of Advanced Driver Assistance Systems in vehicles that can warn the driver if sleepiness is detected.
In order to detect drowsiness, subjective, vehicle-based, behavioral (visual based), physiologic and hybrid methods are used. Hybrid methods consist in a fusion of the previous ones and are, arguably, the most promising approach to efficiently detect drowsiness as it combines the strengths of the different methods. However, the individual limitations of each still need to be overcome, as the intrusive conditions needed to properly acquire a physiologic signal, generally considered the more reliable to detect drowsiness.
This thesis focus on detecting drowsiness using non-intrusive measures, as it is the most promising solution to use on a real life application. As such, one of the goals was to assess if the performance of a drowsiness detector based in non-intrusive behavioral measures was comparable to a detector based in a physiologic intrusive signal (EOG).
Using the measures from a large validated dataset (SleepEye), acquired in an experimental field study in real traffic on real roads, and applying a supervised machine learning classification problem it was concluded that the extracted video features (head orientation, eyelid opening, pupil diameter and gaze direction) performance was similar to the obtained using only EOG. Specifically, the best results have an accuracy, with a total of 17 video features and for multiple classifiers, of roughly 84% for a binary problem categorization (‘awake’ vs ‘drowsy’) and 73% for a three class problem (‘awake’ vs ‘medium’ vs ‘drowsy’).
In view of the potential of a hybrid methodology, several experiments were done, using the same dataset, combining video (17 features) with ECG (16 features). The best accuracy result, similar for multiple classifiers, was close to 89 %. Again, the two class problem was better than the three class by around 10%. Other elaborated strategies as classifier combination, imbalanced data and sequential data approaches were also tested but no considerable
ii
improvements were obtained, supporting that, likely, the obtained results are the limit of what is achievable with this dataset or with the selected features.
Due to the restrictions of the first dataset, that is, only measures already extracted were available without direct access to the raw video source, an experimental work was developed to allow an enriched measure extraction from video. Specifically, the developed framework allows the extraction of additional drowsiness related measures by analyzing the drivers face with a standard camera that can be easily implemented in a real life application. However, further generalization of the algorithm to different light conditions and camera positioning still need to be researched.
In summary, using a non-intrusive drowsiness detection system is the most promising direction to build a real life applicable solution. A solution that could be enhanced by taking advantage of different methods, i.e., a hybrid system.
Keywords: Drowsiness detection, physiologic measures, behavioral measures, non- intrusive hybrid system, machine learning, computer vision.
iii
Resumo
Conduzir um carro é uma atividade complexa, multifacetada e potencialmente arriscada que requer a utilização de recursos fisiológicos e cognitivos na sua totalidade. A sonolência leva a um declínio no desempenho cognitivo, sendo a causa de muitos acidentes de viação. Em vários países europeus, a condução sonolenta é responsável por 10 a 30% de todos os acidentes rodoviários. Uma solução para este problema é a inclusão em veículos de sistemas de deteção de sonolência para alertar o motorista se esta for detetada.
Para detetar a sonolência, são utilizados métodos subjetivos, métodos baseados em veículos, no comportamento dos condutores, fisiológicos e híbridos. Os métodos híbridos consistem numa fusão dos restantes e são, questionavelmente, a abordagem mais promissora para detetar eficientemente a sonolência, uma vez que combina as vantagens dos diferentes métodos. No entanto, as limitações individuais de cada um necessitam de ser superadas, como é o caso das condições intrusivas necessárias para adquirir adequadamente sinais fisiológicos, geralmente considerados os mais fidedignos para detetar sonolência.
Esta tese foca-se na deteção de sonolência usando medidas não-intrusivas, visto ser a forma mais promissora para usar numa aplicação em condições reais. Como tal, um dos objetivos foi avaliar se o desempenho de um detetor de sonolência baseado em medidas comportamentais, não intrusivas, era comparável a um detetor baseado num sinal fisiológico (EOG), intrusivo.
Usando as medidas de um dataset autenticado (SleepEye), adquirido num estudo de condução naturalista, e aplicando um problema supervisionado de classificação de machine learning, foi possível concluir que o desempenho usando medidas visuais (orientação da cabeça, abertura das pálpebras, diâmetro da pupila e direção do olhar) é semelhante ao obtido usando apenas o sinal de EOG. Concretamente, os melhores resultados, obtidos com um total de 17 características de vídeo e para diferentes classificadores, tem uma precisão, aproximadamente, de 84% para uma divisão binária do problema ('acordado' vs 'sonolento') e 73% para um problema de três classes ('acordado' vs 'médio' vs 'sonolento').
Tendo em conta a potencialidade de uma metodologia híbrida, foram realizados diversos testes, utilizando o mesmo conjunto de dados, combinando vídeo (17 características) com ECG (16 características). O melhor resultado, semelhante para vários classificadores, foi cerca de
iv
89%. Novamente, a divisão binária do problema foi cerca de 10% melhor do que a divisão em três classes. Outras estratégias como combinação de classificadores, imbalancing approaches e de dados sequenciais foram também testadas, mas nenhuma melhoria considerável foi obtida, concluindo-se que, provavelmente, os resultados obtidos são o limite do que é alcançável com este conjunto de dados ou com as características selecionadas.
Devido às restrições do primeiro dataset, ou seja, apenas medidas já extraídas estavam disponíveis, sem possibilidade de acesso direto aos videos originais, um trabalho experimental foi desenvolvido para permitir a extração de medidas adicionais indicadoras de sonolência. O framework desenvolvido permite a extração destas medidas, analisando a face dos motoristas com uma câmara standard que pode ser facilmente introduzida num veículo. Apesar de promissor, algumas limitações ainda estão presentes, nomeadamente, o algoritmo desenvolvido necessita de maior robustez face a diferentes condições de luminosidade e posicionamento da câmara.
Em suma, usar um sistema de deteção de sonolência baseado em métodos de aquisição não intrusivos é a direção mais promissora para construir uma solução aplicável em condições reais. Uma solução que poderá beneficiar da combinação de diferentes métodos, ou seja, um sistema híbrido.
Palavras-chave: Deteção de sonolência, medidas fisiológicas, comportamento condutor, sistema híbrido não intrusivo, machine learning, visão computacional.
v
Acknowledgements
First I would like to thank my supervisor, Professor Jaime Cardoso, for the continuous support and availability during my thesis development, for all the suggestions and advices. I would also like to thank him for promoting the collaboration and knowledge exchange between his students.
My sincere thanks also goes to my external supervisor Professor André Lourenço, from CardioID Technologies, who personally recorded a driving session to develop my research, and also to Professor Christer Ahlström, from Swedish National Road and Transport Research Institute, for providing the datasets that made this work possible. Their collaboration was very important and valuable in order to improve my work.
To the Faculty of Engineering of the University of Porto for the knowledge and excellent conditions provided during all my degree.
Last but not the least, I would like to thank to all my friends and my girlfriend for all the motivation and support. And, a final remark, to my family, especially to my parents, who always supported me, throughout my personal and academic life.
vii
Contents
1 Introduction
1
1.1 Context and motivation ... 1
1.2 Challenges and goals ... 2
1.3 Contributions ... 3
1.4 Thesis outline ... 3
2 Literature review
5
2.1 Driver drowsiness ... 52.2 Drowsiness detection methods ... 7
2.2.1 Subjective measures ... 7 2.2.2 Vehicle-based measures ... 8 2.2.3 Behavioral measures ... 9 2.2.4 Physiological measures ... 13 2.2.5 Hybrid methods ... 17 2.3 Commercial solutions ... 18 2.4 Experimental setups ... 21
2.4.1 Platforms and settings ... 21
2.4.2 Benefits and limitations ... 22
2.5 Performance assessment ... 24
3 A framework for driver drowsiness monitoring
27
3.1 Methods overview ... 273.2 Feature engineering ... 28
3.2.1 Feature extraction ... 28
3.2.2 Window size sensitivity ... 33
3.3 Classifiers ... 33
3.3.1 Support Vector Machine ... 33
3.3.2 Random Forest ... 34
3.3.3 Artificial Neural Networks ... 34
3.3.4 Gradient Boosting Tree ... 35
3.3.5 K-Nearest Neighbors ... 36
3.3.6 Classifier combination ... 36
3.4 Imbalance approach ... 38
viii CONTENTS
3.6 Subject-independent classification ... 39
3.7 Results and discussion ... 40
3.7.1 Classifiers and features comparison ... 40
3.7.2 Classifiers combination ... 46
3.7.3 Imbalanced data ... 49
3.7.4 Window size sensitivity ... 51
3.7.5 Sequential data ... 51
3.7.6 Subject-independent classification ... 53
4 A method for non-invasive acquisition of drowsiness measures
55
4.1 Framework description ... 554.2 Face detection ... 56
4.3 Face landmarks detection ... 57
4.4 Measure extraction ... 58 4.4.1 Facial expressions ... 59 4.4.2 Head pose ... 60 4.4.3 Gaze ... 61 4.4.4 Heart rate ... 62 4.5 Validation ... 63 4.5.1 Landmarks validation ... 63
4.5.2 Heart rate validation ... 66
4.5.3 Proof of concept ... 67
5 Conclusions and future work
69
5.1 Conclusions ... 695.2 Future work... 70
ix
List of Figures
2.1 Fatigue model. ... 6
2.2 Scheme of most used behavioral measures. ... 10
2.3 Example of different states of eye opening. ... 10
2.4 ECG waveform, with QRS complex identification example. The three waves of the QRS complex represent ventricular depolarization. ... 13
2.5 Representation of the main EEG signal rhythms used from drowsiness detection. ... 14
2.6 Driver Alert Control (DAC) warning signal. ... 19
2.7 WARDEN™ capacitive system, capable of acquiring ECG without skin contact. ... 20
2.8 Cardiowheel system developed by CardioID Technologies. ... 21
2.9 Tongji advanced driving simulator... 21
2.10 Comparison of the relation between ecological validity and control for the different experimental setups. ... 23
3.1 KSS rating and their corresponding states for 2-class and 3-class problems. ... 28
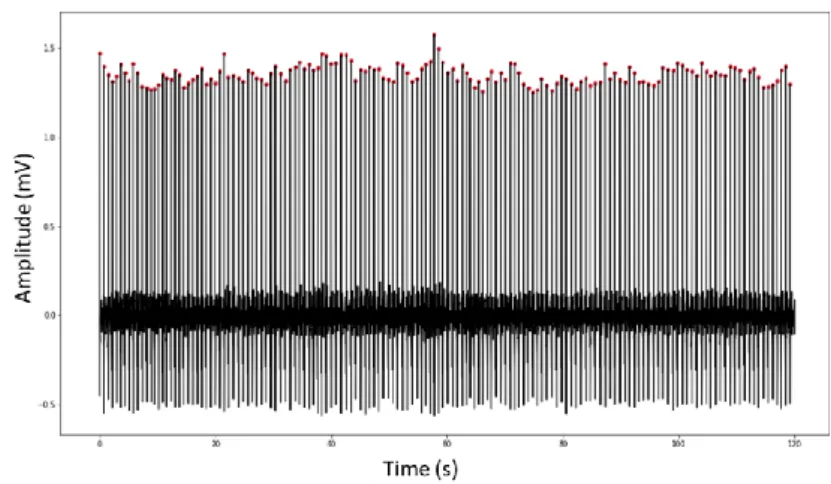
3.2 ECG signal with detected R peaks marked in red circles. ... 29
3.3 Detailed view of detect R peaks in ECG signal. ... 29
3.4 Scheme of points (t1 to t4 points marked in red) characterizing an eye blink. ... 31
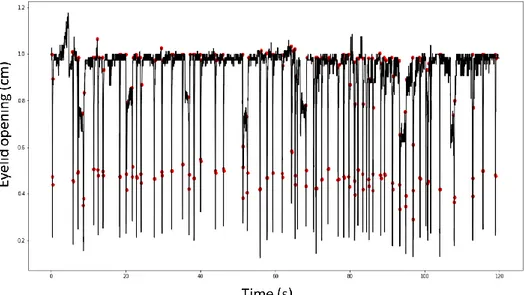
3.5 Detected eye blinks in eyelid opening signal. Each detected blink characterized for 4 points, previously described, in red. ... 31
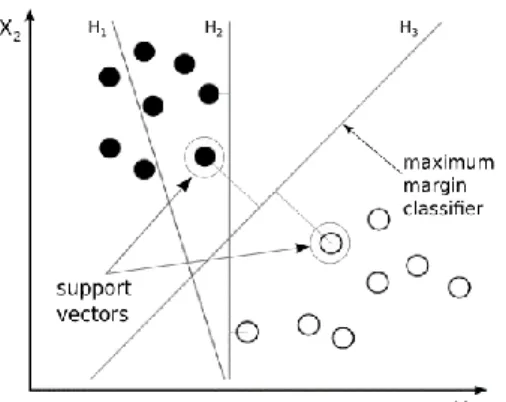
3.6 Example of a set of hyperplanes (H1,H2) and respective best separating hyperplane (H3) for a two features problem. ... 34
3.7 Example of random forest classifier architecture. ... 34
3.8 Example of ANN architecture with 5 inputs, 2 hidden layers with 10 nodes each and 3 outputs. ... 35
3.9 Gradient boosted decision tree ensemble... 36
3.10 Example of KNN algorithm. The sample (circle) is classified according to the majority of classes in the selected neighborhood (K). ... 36
3.11 Parallel classifier combination. ... 37
3.12 Data proportion for 2 and 3-classes problem division. ... 38
3.13 A markov chain with 5 states (S1 to S5) with selected state transitions. ... 39
3.14 Accuracy results (average and standard deviation) for two and three class problem for features extracted in different time windows. ... 51
x LIST OF FIGURES
4.1 Overall workflow of the drowsiness measures extraction process. ... 56
4.2 Overall CNN architecture. ... 57
4.3 The architectures of P-Net, R-Net, and O-Net, where “MP” means max pooling and “Conv” means convolution. ... 57
4.4 Facial landmarks 68 points mark-up. ... 58
4.5 Scheme of left eyelid distance calculation method. ... 59
4.6 Detailed view of the 68 mark up, with schematized references used for the eyebrow distance calculation method. ... 60
4.7 The PnP Problem scheme: Given a set of 3D points (Mi) expressed in a world reference frame, and their 2D projections (mi) onto the image, we seek to retrieve the pose relatively to the camera coordinate system. ... 61
4.8 Scheme for pupil displacement calculation. ... 62
4.9 Scheme of the 3D gaze approximation. ... 62
4.10 Example of detected (blue) and manually annotated (red) landmarks. ... 63
4.11 Illustration of detect eye and mouth contours and head orientation. ... 65
4.12 Example of measured eyelid opening distance. ... 65
4.13 Example of eyelid opening distance obtained by the Smart Eye Pro system... 65
4.14 Example of measured head pose angles. ... 66
4.15 Example of measured mouth opening. ... 66
xi
List of Tables
2.1 Karolinska Sleepiness Scale. ... 8
2.2 List of previous works on driver drowsiness detection using behavioral measures. ... 11
2.3 List of previous works on driver drowsiness detection using physiological measures. .. 16
2.4 Comparison between different drowsiness measurement types. ... 18
2.5 Confusion matrix of a binary alert/drowsy problem. ... 24
3.1 Features extracted from the ECG. ... 29
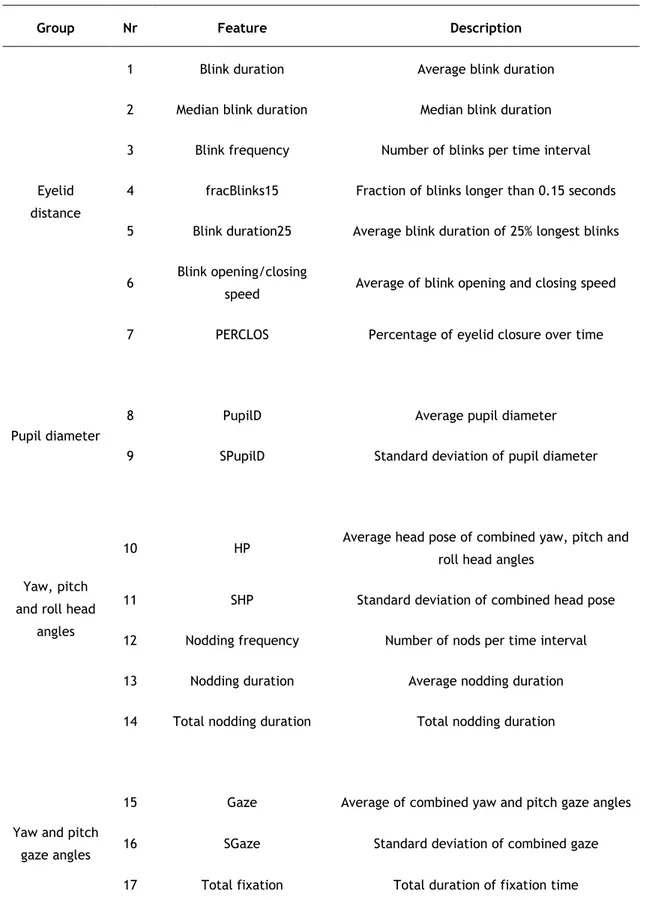
3.2 Features extracted from the available SmartEye measures. ... 32
3.3 Accuracy results (average and standard deviation) for combined classifiers using ECG and video features. ... 40
3.4 Normalized confusion matrix using SVM classifier with 2 labels. ... 41
3.5 Normalized confusion matrix using SVM classifier with 3 labels. ... 41
3.6 Normalized confusion matrix using RF classifier with 2 labels. ... 42
3.7 Normalized confusion matrix using RF classifier with 3 labels. ... 42
3.8 Normalized confusion matrix using ANN classifier with 2 labels. ... 43
3.9 Normalized confusion matrix using ANN classifier with 3 labels. ... 43
3.10 Normalized confusion matrix using GBT classifier with 2 labels... 44
3.11 Normalized confusion matrix using GBT classifier with 3 labels... 44
3.12 Normalized confusion matrix using KNN classifier with 2 labels. ... 45
3.13 Normalized confusion matrix using KNN classifier with 3 labels. ... 45
3.14 Accuracy results (average and standard deviation) for combined classifiers using ECG and video features. ... 46
3.15 Normalized confusion matrix using soft fusion of SVM and RF classifiers. ... 47
3.16 Normalized confusion matrix using soft fusion of SVM and GBT classifiers. ... 47
3.17 Normalized confusion matrix using soft fusion of GBT and RF classifiers. ... 47
3.18 Normalized confusion matrix using soft and hard fusion of SVM, RF and GBT classifiers. ... 47
3.19 Normalized confusion matrix using soft and hard fusion of SVM, RF and ANN classifiers. ... 48
3.20 Accuracy (average and standard deviation) results obtained with two SVM classifiers using different information sources. ... 49
3.21 Normalized confusion matrix for the two SVM classifiers using different information sources. ... 49
xii LIST OF TABLES
3.22 Accuracy (average and standard deviation) results for SVM classifier using ECG and
video features. ... 49
3.23 Normalized confusion for imbalanced approaches for 2 class problem. ... 50
3.24 Normalized confusion for imbalanced approaches for 3 class problem. ... 50
3.25 HMM accuracy (average and standard deviation) results using ECG features. ... 51
3.26 Normalized confusion matrix using HMM with 15 (seconds) x 8 sequences. ... 52
3.27 HMM accuracy (average and standard deviation) results obtained using the raw ECG signal. ... 52
3.28 Accuracy results for subject independent classification. ... 53
xiii
Abbreviations
ADAS Advanced Driver Assistance System
ADS Automated Driving Systems
AECS Average Eye Closure Speed
ANN Artificial Neural Networks
BN Bayesian networks
CAN Controller Area Network
CCD Charge-Coupled Device
CES Consumer Electronics Show
CMOS Complementary Metal- Oxide Semiconductor
CNN Convolutional Neural Network
DAC Driver Alert Control
DWT Discrete Wavelet Transform
ECG Electrocardiogram
EDA Electrodermal activity
EEG Electroencephalogram
EOG Electrooculogram
EMG Electromyogram
ESS Epworth Sleepiness Scale
FN False Negative
FP False Positive
FPS Frames per Second
GW Gabor Wavelets
HF High Frequency
HMM Hidden Markov Model
HOG Histogram of Oriented Gradients
HR Heart Rate
HRV Heart Rate Variability
IR Infrared
KNN K-Nearest Neighbors
KSS Karolinska Sleepiness Scale
LBP Local Binary Pattern
LDA Linear Discriminant Analysis
xiv ABBREVIATIONS
LF Low Frequency
MWT Maintenance of Wakefulness Test
MSLT Multiple Sleep Latency Test
NREM Non-Rapid Eye Movement
NHTSA National Highway Traffic Safety Administration PERCLOS PERcentage of Eyelid CLOsure
PnP Perspective n Point
PPG Photoplethysmogram
REM Rapid Eye Movement
RF Random Forest
RMSE Root Mean Square Error
SDLP Standard Deviation of Lane Position
SSS Stanford Sleepiness Scale
SVM Support Vector Machine
SWM Steering Wheel Movement
TN True Negative
TP True Positive
VAS Visual Analogue Scales
VLF Very Low Frequency
VTI Swedish National Road and Transport Research Institute
WPD Wavelet Packet Decomposition
1
Chapter 1
Introduction
1.1 Context and motivation
Driving a car is a complex, multifaceted and potentially risky activity requiring full mobilization of physiological and cognitive resources to maintain performance over time. Any loss of these resources can have dramatic consequences, namely accidents [1].
Most people are aware of the dangers of driving while intoxicated, but many do not know that drowsiness also impairs judgment, performance and reaction times just like alcohol and drugs. Studies show that being awake for more than 20 hours results in an impairment equal to a blood alcohol concentration of 0.08%, the legal limit in the United States [2].
A report from U.S. National Highway Traffic Safety Administration (NHTSA) [3], stated that drowsy driving was reportedly involved in 2.3 to 2.5% of all fatal crashes nationwide from 2011 through 2015. In 2015, 2.3% (824) of the fatalities that occurred on U.S. roadways are reported to have involved drowsy driving. Also, according to data from Australia, England, Finland, and other European nations, all of whom have more consistent crash reporting procedures than the U.S., drowsy driving represents 10 to 30 percent of all crashes [4].
In summary, the impact of drowsy driving in traffic accidents is of known severity and, as so, a problem that needs to be solved.
Still, with the current investment being made in autonomous cars by every major car manufacture, thus planning a future of self-driven cars [5], the study of this problem could be considered unnecessary.
However, the following analysis to the car automation process needs to be considered. Car automation can be grouped into six levels, where the first level (zero) describes a car with no autonomy and the last level (five), a fully autonomous car [6].
First, currently, there are broadly available only vehicles with level two of automation, that is, cars that have advanced driver assistance systems (ADAS), the vehicle can itself actually control both steering and braking/accelerating simultaneously under some restricted circumstances.
Secondly, while level three and four automation systems, that is Automated Driving Systems (ADS) where the vehicle can itself perform all aspects of the driving task under some circumstances, are expected to be gradually introduced over the next few years, the driver may still need to take to control of the vehicle after a long period of non-driving. Indeed, driver
2 Introduction
handover strategies is currently an area of big interest, in which, drowsiness plays a major role [7], only empathizing the critical necessity to further explore drowsy driving.
Lastly, the level five of automation is only expected to be available, in the best scenario, at least after 2025 [6], meaning that the transition between manual and full autonomous driving will be slow and a substantial proportion of the population will still drive non full automated cars for a significant number of years.
1.2 Challenges and goals
Drowsiness is related to a natural physiological need, as so, it simply cannot be eliminated [8]. For this reason, the current developed works approach the problem by monitoring and alerting the driver when they are drowsy or in a distracted state [9].
Multiple researches have already been done in this field, common techniques include monitoring the vehicle state, analyzing driver behavior or driver physiologic signals [10].
Vehicle monitoring correlation with driving drowsy has been shown [11], [12], and some cars manufacturers use this technique to evaluate driver drowsiness, as Volkswagen [13], Mercedes (MERCEDES Attention Assist™) [14] and Volvo (Driver Alert Control) [15]. However, vehicle-based measures are too dependent on road conditions [10].
Driver behavior monitored by a camera provides efficient measures, yawning, blinking and head orientation are all good indicators of a driver’s fatigue level [16]. Based on this technique, car suppliers like Bosch [17] and NVidia [18] are developing driver drowsiness detection systems. Typically, these method’s disadvantages are the dependence on proper lighting conditions and high difficulty in analyzing some features when the driver uses some object as glasses [19].
A more efficient approach is analyzing driver physiologic features, as they have high accuracy and allow an early drowsiness detection (physiological signals start to change in earlier stages of drowsiness) [8]. The biggest limitation using physiological signals is that they are usually acquired using intrusive methods [19] and although some approaches have been made to acquire signal using non-intrusive systems, loss of signal quality is still significant [20]. CardioID Technologies [21], Plessey [22] and StopSleep UK [23] are examples of companies that develop non-intrusive solutions to detect driver drowsiness based on physiologic signals.
In order to overcome the disadvantages of the different methods, some researches present as solution a fusion of different measurement types, creating a hybrid driver drowsiness detection system. Although the number of studies combining several types of measurement types is still reduced, current studies suggest that a combination of the three types of methods—behavioral, physiological and vehicle-based—is a promising avenue worth pursuing in the development of real-world, vehicle-mounted, driver drowsiness detection solution [8].
The overall challenge is ambitious: not only detecting, but also predicting, degradation in the driver’s operational state [20].
Considering all the above mentioned, the main purpose of this work is developing algorithms to create an accurate drowsiness detection system, with high relevance for methods that do not require intrusive acquisition systems, thus contemplating a valid introduction in a real world application. Combination of multiple drowsiness detection methods should also be assessed. Ultimately, the goal is leading to safer driving conditions and reduction in drowsy driving associated accidents.
1.3 Contributions 3
1.3 Contributions
In summary, the developed work contributes to the driver drowsiness detection field in the following aspects:
• Through a detailed literature analysis, present a clear explanation of the drowsiness concept and its causes, a review of state of the art methods for drowsiness detection both in scientific and commercial solutions, as well as, used experimental setups.
• Compare, using a large and validated dataset, containing more than 40 hours of driving data collected under a naturalist driving study, the drowsiness detection performance between non-invasive behavioral measures and invasive physiologic signals, as the ECG and EOG.
• Analyze a series of machine learning strategies that could be used to improve the overall drowsiness detection capability independently of the used features, but focusing on a multimodal approach, which is still not properly studied.
• Developing an experimental procedure, to easily allow the extraction of a high amount of driver drowsiness related features using a standard camera.
1.4 Thesis outline
Besides the current chapter, this document has four chapters.
The next chapter (Chapter 2) is a revision of the state of the art of driver drowsiness detection. Within this chapter, first, a clarification of the drowsiness concept and the causes that most contribute to a drowsy state is presented, followed by a revision of the main techniques used to detect drowsiness in scientific and commercial solutions. A summary of the main experimental setups used to conduct drowsiness detection studies and performance measures is also presented.
The third chapter (Chapter 3) reports the developed work using a supervised machine learning approach to classify the driver drowsiness state. This includes extracted features, tested classifiers and several machine learning strategies that are used to improve the detection performance.
The fourth chapter (Chapter 4) explains the exploratory framework developed in order to extract drowsiness related measures using a standard camera.
Lastly, in the fifth chapter (Chapter 5), the project main conclusions and future work suggestions are discussed.
5
Chapter 2
Literature review
In this chapter, first a clarification of the drowsiness concept and its causes are addressed, followed by a review of state of the art methodologies for drowsiness detection, including commercial solutions. The experimental setups and typical evaluation methodologies are also discussed.
2.1 Driver drowsiness
Sleep is an active period in which a lot of essential processing, restoration, and strengthening occurs [24]. It is a ubiquitous biological imperative process that appears to be evolutionarily conserved across species [25].
This process takes place in repeating cycles, averaging 90 minutes, and in each cycle the body alternates between two distinct modes: rapid eye movement (REM) sleep, the last part of the sleep cycle where typically dreams occur, and non-REM sleep, which consists of three separate stages [10], [26]:
Stage I: transition from awake to asleep; Stage II: light sleep;
Stages III: deep sleep.
These stages can be distinguished by measuring electrical activity in the brain with electroencephalography (EEG) or the eye movements via electrooculography (EOG) or muscle activity via electromyography (EMG).
Drowsiness is a transitional state between wakefulness and sleep (stage I) in which the “sleep onset process” has already begun, albeit intermittently, and is likely to proceed to sleep [27], [28], [29]. During this phase a reduction in vigilance (alertness) and performance is often observed.
In the context of the traffic safety and transportation field, the term drowsiness is often used interchangeably with sleepiness and fatigue, although having different meanings in research and clinical settings [4], [30], [31].
6 Literature review
Specifically, sleepiness is a more subjective concept than drowsiness. Usually it refers to the physiological drive to sleep, that is, it can be considered as a measure of a subject’s tendency at a particular time to doze or fall asleep, at least briefly [4], [27], [30].
Fatigue is a multidimensional construct that has been difficult for researchers to define [32], but typically is described as a global reduction in physical or mental arousal that results in a performance deficit and a reduced capacity of performing a task [30].
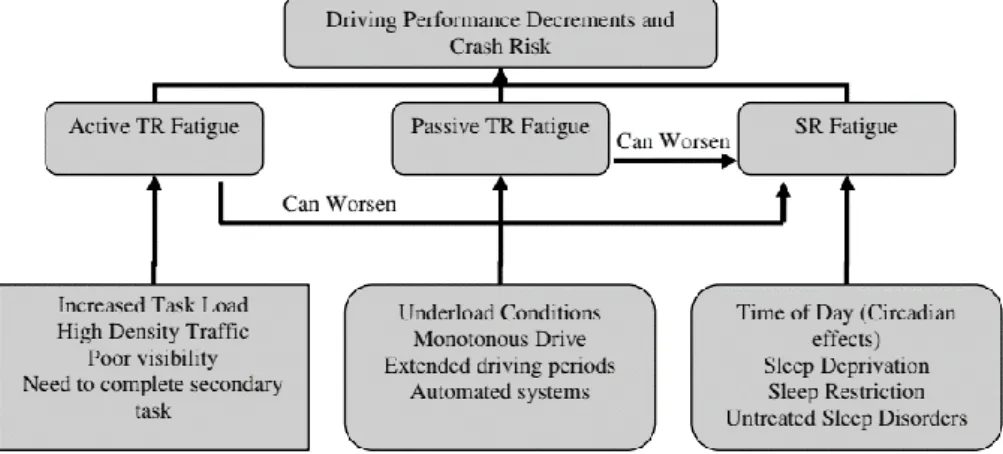
A person can be fatigued without being sleepy/drowsy, but a person cannot be sleepy without being fatigued [30]. It can be inferred that drowsiness/sleepiness is a consequence of fatigue [11]. Driver fatigue can be subcategorized into sleep-related (SR) and task-related (TR) fatigue based on the causal factors contributing to the fatigued state [32]. Figure 2.1, adapted from [32], illustrates this division, the types of fatigue, their causes, consequences and interactions.
SR fatigue is mainly influenced by circadian rhythms, sleep deprivation and sleep restriction.
Circadian rhythms are governed by an internal body clock that completes a cycle approximately every 24 h, circadian pacemaker is the name given to that clock. This internal clock is in the origin of sleepiness peaks at certain day times [8]. Moreover, a dysregulation of circadian rhythms results in increased drowsiness states, as it is the case when traveling to a different time zone. This happens because our circadian rhythms are slow to adjust and remain on their original biological schedule for several days, leading to sleepiness peaks during the middle of the afternoon or wakefulness peaks at late night. This experience is known as jet lag [33].
In relation to homeostatic factors, such as the duration of wakefulness and sleep deprivation, there is a correlation between the level of sleep deprivation and performance, that is, performance becomes worse the longer a person remains awake [34], [32].
Furthermore, drowsiness is affected by sleep quality or not obtaining adequate sleep (sleep restriction). Although the need for sleep varies among individuals, sleeping 8 h per 24-h period is common, and 7–9 h is needed to optimize performance. Experimental evidence shows that sleeping less than 4 consolidated hours per night impairs performance on vigilance tasks [8].
TR fatigue is caused by the driving task and driving environment. TR fatigue can be further subdivided into active or passive fatigue [32], [35], [36].
2.1 Driver drowsiness 7
Active fatigue is generally related to mental overload (high demand) driving conditions being the most common form of TR fatigue that drivers experience. Examples of high task demand situations include high density traffic, poor visibility, or the need to complete an auxiliary or secondary task (e.g. searching for an address) in addition to the driving task [35], [32].
Passive fatigue, in contrast, develops by experiencing underload conditions, for example, when the roadway is monotonous and there is little traffic. In this scenario, the driver is mainly monitoring the driving environment, that is, the driving task is predictable, which may lead to a reduction in effort exerted on the task [36], [32].
Despite the different causes of fatigue, independently of being sleep related or not, the perceptible signs are essentially the same. From a drivers perspective, the key signs of drowsiness are: trouble focusing, keeping eyes open or head up; yawning or rubbing the eyes repeatedly; daydreaming and wandering thoughts; drifting from lane; tailgating and missing signs or exits; feeling restless, irritable or aggressive and overall slower reaction time [2]. Furthermore, the traffic safety consequences are also equal, that is, an impaired performance at the wheel, with increased crashing risk, which can ultimately result in falling asleep at the wheel [32], [37].
For these reasons, in this work, whose main objective is to generically detect drowsiness, no causal factors were taken into consideration. However, a distinction should be taken in account when designing a countermeasure system, as sleeping and/or caffeine can be considered the only effective countermeasure for drowsiness/sleepiness, but the countermeasure for task related fatigue could be other [32], [30], for example, the use of automation technologies.
In addition, it should be noted that, in the following sections, no further distinction is made between fatigue, sleepiness and drowsiness.
2.2 Drowsiness detection methods
The main approaches for detecting driver drowsiness can be divided into four categories: subjective measures, vehicle-based measures, behavioral measures and physiological [8], [10], [38], [39]. A fifth category, hybrid methods, can also be considered, consisting in a combination of the methods of the previous categories.
2.2.1 Subjective measures
This type of measures is based on questionnaires which are performed either by the driver, that is, the driver assesses its own state of drowsiness, or by a supervisor evaluation. Some of the most used questionnaires include Karolinska Sleepiness Scale (KSS), Stanford Sleepiness Scale (SSS), Visual Analogue Scales (VAS) and Epworth Sleepiness Scale (ESS).
The Karolinska Sleepiness Scale is the most common used drowsiness scale [8], [40]. It is a 9-point Likert scale, a typical self-report rating format where subjects rank a quality from high to low or best to worst [41]. Several studies have already focused in validating the KSS, showing, for example, that there is a relatively strong intra-individual correlation between the KSS and electroencephalographic measurements [42], [43]. KSS scores are presented next, in Table 2.1.
8 Literature review
Table 2.1 - Karolinska Sleepiness Scale.
Level Sleepiness description
1 Extremely alert
2 Very alert
3 Alert
4 Rather alert
5 Neither alert nor sleepy
6 Some signs of sleepiness
7 Sleepy, but no difficulty remaining awake
8 Sleepy, some effort to keep alert
9 Extremely sleepy, fighting sleep
The Stanford Sleepiness Scale (SSS) is similar to the KSS, it is a Likert scale, having seven states [40], [44]. On the original test, typically, subjects were asked to rate their alertness level every 2 hours throughout the day by choosing a single number associated with specific alertness description.
Visual Analogue Scales (VAS) [8], [45] rating is performed by asking subjects to rate their “sleepiness” using a scale spread along a 100 mm wide line. Suggestions for sleep deprivation state range from “just about asleep” (left end) to “as wide awake as I can be” (right end). Subjects place a mark on the line expressing how sleepy they feel they are. Sleepiness level is measured by the distance in millimeters from one end of the scale to the mark placed on the line. The VAS is convenient since it can be rapidly administered as well as easily repeated.
The Epworth Sleepiness Scale (ESS) [46] measures a person’s general level of daytime sleepiness, or their average sleep propensity in daily life. It is a simple questionnaire based on retrospective reports of the likelihood of dozing off or falling asleep in a variety of different situations.
Other tests like the Maintenance of Wakefulness Test (MWT) and Multiple Sleep Latency Test (MSLT) may also be used to describe sleepiness levels [8].
A major drawback of this measurement type is the difficulty of implementation in real world driving conditions due to their subjective nature. Asking a driver to rate their arousal level may stimulate alertness, thus biasing the ratings. Variations in self-rated drowsiness can also be caused by stress or the use of drug substances [39]. In addition, the average estimates have to be interpreted with caution, as there are considerable individual differences in the relationship between subjective ratings [40].
2.2.2 Vehicle-based measures
Vehicle-based measures, as the name suggests, are obtained by monitoring the vehicle, that is, a correlation between the driver’s alertness state and a series of vehicle parameters is made [47]. The two most commonly used vehicle-based measures for driver drowsiness
2.2 Drowsiness detection methods 9
detection are: the steering wheel movement (SWM) and the standard deviation of lane position (SDLP) [48]. Other measures include monitor use of pedals (gas, break), usage of in-vehicle devices (switching radio, air conditioning) and cruising speed [15].
Steering wheel movement is measured using a steering angle sensor mounted on the steering column [10]. When drowsy, the number of micro-corrections on the steering wheel reduces compared to normal driving [11], [49]. To eliminate the effect of lane changes, the researchers consider only small steering wheel movements (between 0.5° and 5°), which are needed to adjust the lateral position within the lane [50].
Standard deviation of lane position is an established indicator of sleepiness related performance [12], [51]. SDLP consists in monitoring the car’s relative position within its lane with an externally-mounted camera. Specialized software is used to analyze the data acquired by the camera and compute the car’s position relative to the road’s middle lane [12]. Typically, a drowsy driver, or a driver who has fallen asleep will tend to leave the designated lane and crossing into a lane of opposing traffic or going off the road.
However, vehicle-based measures have a set of limitations. They tend to be too dependent on the geometric characteristics of the road (road marking, climatic and lighting conditions), and to a lesser extent the kinetic characteristics of the vehicle [10]. These measures can also be influenced by other driver’s states that not drowsiness, as cognitive distraction and visual distraction (texting task) [52].
Also, every driver has a different style of driving, there are drivers who can drive calmly because their long experience of driving and there are drivers who are still amateur and often drive reckless.
Regardless, all these disadvantages could possibly be overcome by developing robust enough strategies to adapt to the behavior of the driver and car type in order to avoid false alarms [19]. The biggest constraint, is possibly, that with the development of automated driving functions, as conditionally automated driving which gives drivers the freedom to let go of the steering wheel, steering behavior will no longer be a feasible detection method [53].
2.2.3 Behavioral measures
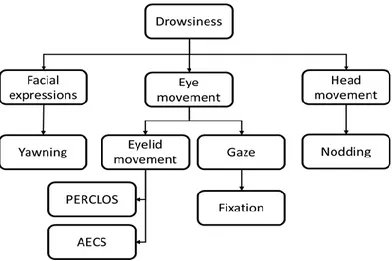
Behavioral measures consist in detecting driver visual features using a camera [19], [20]. Source of visual information can include facial expression, eye movement and head movement.
10 Literature review
Figure 2.2 - Scheme of most used behavioral measures.
Regarding facial expression features, several have been proposed in order to detect drowsiness, as wrinkles, chin, nose, lip, nasolabial fold, lid tightener and yawn [20], [19], [54], [55], [56], [57]. For example, yawn, is a common fatigue symptom and happens to every human being, furthermore, it is relatively easy to detect (for example, frequency of yawns), as such, yawn is one of the most used fatigue indicators from facial expression related features [58], [59].
Eye movement can be described by the eyelid and the gaze. Eyelid movement is often characterized by one measure, the Percentage of Eyelid Closure (PERCLOS).
PERCLOS is a robust feature used in drowsiness detection and one of the most used [19], [59], [60], [61], [62], [63], [64], [65]. It is obtained by the proportion of time that the subject’s eyes are closed over a specific period of time, allowing a correlation between drowsiness and frequency of blinking (Figure 2.3, adapted from [66]). In subjects experiencing drowsiness, PERCLOS measurements will be higher than in alert drivers, as the eyes are closed for longer periods of time and more often than in alert drivers [67].
Figure 2.3 - Example of different states of eye opening.
As mentioned PERCLOS is a strong drowsiness measure, however in most cases, proper lighting conditions are needed and use of glasses and sunglasses limit this feature accuracy. Also, it might happen that a driver who is trying to stay awake is able to fall asleep with his eyes open [20].
Examples of other eyelid related drowsiness measures are blink frequency and eye closure/opening speed, as Average Eye Closure Speed (AECS) [30], [68]. Eye closure/opening speed represents the amount of time needed to fully close the eyes or to fully open the eyes. A drowsy person will blink distinctly slower than an alert person [69].
The movement of a person's pupil (gaze) may have the potential to indicate one's intention and mental condition. For example, for a driver, the nominal gaze is frontal. Looking at other
2.2 Drowsiness detection methods 11
directions for an extended period of time may indicate fatigue or inattention. In addition, when people are drowsy, their visual awareness cannot cover a wide enough area, concentrating on one direction. Hence, gaze (deliberate fixation) and saccade eye movement may contain information about the one's level of alertness [64], [70], [71], [72].
When a driver is sleepy, some of the muscles in the body begin to relax, leading to nodding. For example, when drowsy, a person´s head tend to lean forward due to its weight. However, then, it becomes difficult to breath and the head returns to its normal state, which results in nodding [71].
Head pose, estimation of the position and orientation of a driver’s head, is a strong indicator of a driver’s field of view and current focus of attention. It is intrinsically linked to visual gaze estimation. Intuitively, it might seem that looking at the driver’s eyes might provide a better estimate of gaze direction, but in the case of lane-change intent prediction, for example, head dynamics were shown to be a more reliable cue [73], [74].
Usually, the framework for computing behavioral measures, from the captured drivers video, includes using Viola–Jones algorithm, Connected Component Analysis, Cascade of Classifiers, Hough Transform or Gabor Filter to detect the face, eye or mouth [10], [63], [75], [76]. Features are then extracted using a feature extraction technique, most used techniques are geometric constraints, Wavelet Packet Decomposition (WPD), Gabor Wavelets (GW) or Discrete Wavelet Transform (DWT). Recently, some approaches using Convolutional Neural Networks (CNNs) to extract drowsiness-related features from the face region have also been developed as in [77] and [78] works.
Having the interest features, some projects classify drowsiness state based on threshold levels, while other employ more elaborated classifiers, such as Support Vector Machine (SVM), fuzzy classifier, Bayesian Networks (BN), neural classifiers and Linear Discriminant Analysis (LDA) [10], [16], [58], [59], [60], [63], [64], [75], [79], [80].
Table 2.2, adapted from [10], summarizes some of the works using behavioral methods.
Table 2.2 - List of previous works on driver drowsiness detection using behavioral measures.
Source Drowsiness measure Detection techniques Feature Extraction Classification [80] Pupil, Head pose estimation Viola-Jones Algorithm Geometric constraints, Lucas–Kanade optical flow method SVM [63] Blink duration Viola-Jones algorithm, Neural network-based eye detector Eye Horizontal
Symmetry Threshold based
[65] PERCLOS,
Head pose
Viola-Jones Algorithm
Active
12 Literature review Source Drowsiness measure Detection techniques Feature Extraction Classification [16] PERCLOS, AECS, Gaze, Facial Expression, Head pose SVM classifier (eye detection) Kalman filter Gabor wavelet Generalized regression neural networks BN [81] PERCLOS, AECS,
Mouth opening Viola-Jones
Algorithm Correlation coefficient template matching SVM [82] Head pose, Yawning Geometric method Steerable filters, Histogram of oriented gradients (HOG), Haar features SVM [75] PERCLOS SVM classifier Harr features and
Adaboost classifier HOG, Maximum-Likelihood algorithm Spectral Regression Threshold based [76] PERCLOS Haar-like features
and Kalman filter Local binary
pattern (LBP) SVM [83] Eye closure duration, Frequency of eye closure
Hough Transform DWT Neural Classifier
[84] PERCLOS Haar Algorithm Kalman filter SVM
[85] Yawning Viola-Jones
Algorithm
Viola-Jones
Algorithm SVM
As stated, proper lightning conditions affect visual features detection performance, being challenging to get visual data which is independent from all types of illumination, for example, the contrast between day and night luminosity conditions [19]. Normal cameras do not perform well at night [10], [69] and, in order to overcome this limitation, some researchers have tried active illumination using an infrared (IR) Light Emitting Diode (LED) [10], [69]. Although working
2.2 Drowsiness detection methods 13
fairly well at night, LEDs are considered less robust during the day [10], [86]. The two most popular technologies for imaging sensors used in visible light cameras are CCD (Charge - Coupled Device) and CMOS (Complementary Metal - Oxide Semiconductor). Typically, CCD based cameras obtain images with higher resolution and lower noise level, on the other hand, CMOS based cameras are cheaper and more battery efficient [8]. Some works have also used depth cameras, for example, the Microsoft Kinect which captures 3D data combining a CMOS sensor with an IR laser to obtain image depth [87].
One of the major benefits of the visual measures is that they can be acquired non-intrusively [72].
2.2.4 Physiological measures
Physiological methods offer an objective, precise way to measure sleepiness. They are based upon the fact that physiological signals start to change in earlier stages of drowsiness, which could allow a potential driver drowsiness detection system some extra time to alert a drowsy driver and, thereby, preventing road accidents [8]. Electrocardiogram (ECG), electroencephalogram (EEG), electrooculogram (EOG), photoplethysmogram (PPG) and electrodermal activity (EDA) are physiological signals from where we can extract measures to detect drowsiness [20].
The ECG records the electric activity of the heart. This activity, more precisely the heart rate, is controlled by the balance between the two branches of the autonomic nervous system (ANS), the sympathetic nervous system and the parasympathetic nervous system. Wakefulness states are characterized by an increase in sympathetic activity and/or a decrease of para- sympathetic activity, while a decrease in mental workload/ a relaxation state, which can occur in sleepy drivers over prolonged monotonous driving, is characterized by an increase in parasympathetic activity and/or a decrease in sympathetic activity [20], [88], [89], [90].
ANS activity can be indirectly measured by the heart rate variability (HRV), a measure of the beat-to-beat (R-R Intervals, Figure 2.4, adapted from [91]). For example, an increased HRV indicates a higher parasympathetic activity, as the HR lowers resulting in more time between heartbeats, thus more variability.
Conventional approaches to analyze HRV include time and frequency domain methods.
Figure 2.4 - ECG waveform, with QRS complex identification example. The three waves of the QRS
complex represent ventricular depolarization.
Typical time domain HRV measures are the mean RR intervals, standard deviation of RR intervals (SDNN), root mean square of the differences between consecutive RR intervals (RMSSD), frequency of successive differences of RR intervals that spanned more than 50 ms (NN50) and percentage value of NN50 (pNN50) [89], [92], [90].
14 Literature review
Frequency domain analysis can be performed using power spectral density (PSD) of the RR interval series. RR series may be classified in three frequency bands: very low frequency (VLF) (0-0.04 Hz), low frequency (LF) (0.04-0.15 Hz), and high frequency (HF) (0.15-0.4 Hz) [89]. For example, LF and HF are reliable measures, respectively, of sympathetic and parasympathetic activity, thus when a driver progresses from an awake to a drowsy state there is a decrease in the LF/HF ratio [10], [88], [93], [94], [95].
To obtain these measures, first a pre-processing step needs to be applied to the ECG signal, as band pass filters, followed by algorithms for R-peak detection like Pan-Tompkins algorithm [96]. For the frequency domain analysis the signal domain conversion is done typically with Fast Fourier Transform (FFT) [97].
Even though the reliability and accuracy in detecting driver’s drowsiness based on ECG is high when compared to other methods, an important limitation of physiological signal measurement is its intrusive nature [19]. One possible way to overcome this problem is trying to use a non-intrusive system, however, it is less accurate compared to intrusive systems due to improper electrode contact [20].
Electroencephalogram (EEG) records electrical activity of the brain providing information represented by waves (frequency bands). It is a standard technique used in sleep studies [98]. The most relevant waves for drowsiness and sleepiness experiments are: alpha waves (8 – 12 Hz), they play an important part in the transition from wakefulness to sleep, although they are not directly related to sleepiness itself, but to ‘relaxed wakefulness’, which leads to a reduced readiness to react to stimuli; beta waves (13 – 30 Hz) are associated with increased alertness, arousal and excitement; theta waves (4 – 7 Hz) are commonly regarded as a clear indicator of lack of attention and the onset of sleep and delta waves (< 4 Hz) which originate during deep sleep [15], [98].
A schematization of the described waves is depicted next, in Figure 2.5, adapted from [99].
Figure 2.5 – Representation of the main EEG signal rhythms used from drowsiness detection. Variations in the EEG signal, such as increases in alpha and theta rhythms and reduction of beta waves, are interpreted as an indication of weariness and sleepiness [100]. To assess these changes, typically FFT or Wavelet Transform (WT) [101] are applied to the signal. In the same way as the ECG and other physiologic signals, to extract features from the signal, first, a pre-processing step is required, as applying a band pass filter [102], [103].
2.2 Drowsiness detection methods 15
Although the EEG signal in most cases discriminates accurately between alert and drowsy states, there are occasions where the states are not clearly differentiable, being difficult to distinguish them. For example, during the transition from wakefulness to sleep, there may be several minutes where the EEG looks like that of wakefulness, but awareness of the environment is already lost [104].
EEG signal acquisition also requires very specific conditions for being measured properly (intrusive methods). In a real-world driving scenario, the required acquisition system is of huge inconvenience, as it can hinder driving capabilities and potentially increase the chances of an accident happening [8].
The Electrooculogram (EOG) is a method used for measuring the potential difference between the front and back of the eye ball. The eye is a dipole with the positive cornea in the front and the negative retina in the back, this electric potential between cornea and retina lies in the range 0.4 - 1.0 mV. When the eyes are fixated straight ahead a steady baseline potential is measured by electrodes placed around the eyes. When moving the eyes a change in potential is detected as the poles come closer or farther away from the electrodes. The sign of the change depends on the direction of the movement [10], [72]. The EOG can therefore be used for detection of eye movements and blinks. In sleepiness studies, for instance, it can be used to differentiate rapid eye movements and non-rapid eye movements which are characteristic of an awake and drowsy state respectively [100].
Photoplethysmogram (PPG) is an optical obtained signal which measures volumetric changes in blood in peripheral circulation. It can be acquired by using a pulse oximeter that makes uses of low-intensity IR light which is proportional to the quantity of blood flowing through the blood vessels [9], [105]. PPG can be used to estimate, for example, heart and respiration rate.
The Electrodermal activity refers to the phenomena of skin conductance. Specifically, it is based on the fact that the electrical characteristics of the skin (skin conductivity) mainly change due to the level of sweat produced by sweat glands. In turn, the level of activity of the sweat glands directly reflects the mental state of the person [106]. Although EDA can be influenced by multiple other factors that not drowsiness, for example, by stress, it has already been explored in some driver drowsiness related studies as a complement to other physiologic signals [107], [108].
As in behavioral methods, more recently, some deep learning approaches, for instance, using CNNs, have also been used to efficiently extract features from the physiologic signals [109], [110]. However, most of the developed approaches extract features using the previously described methods, which are then used to evaluate the driver state applying a model as Artificial Neural Networks (ANN), Support Vector Machines (SVM), Linear Discriminant Analysis (LDA), Decision Trees or K-Nearest Neighbors algorithm (KNN).
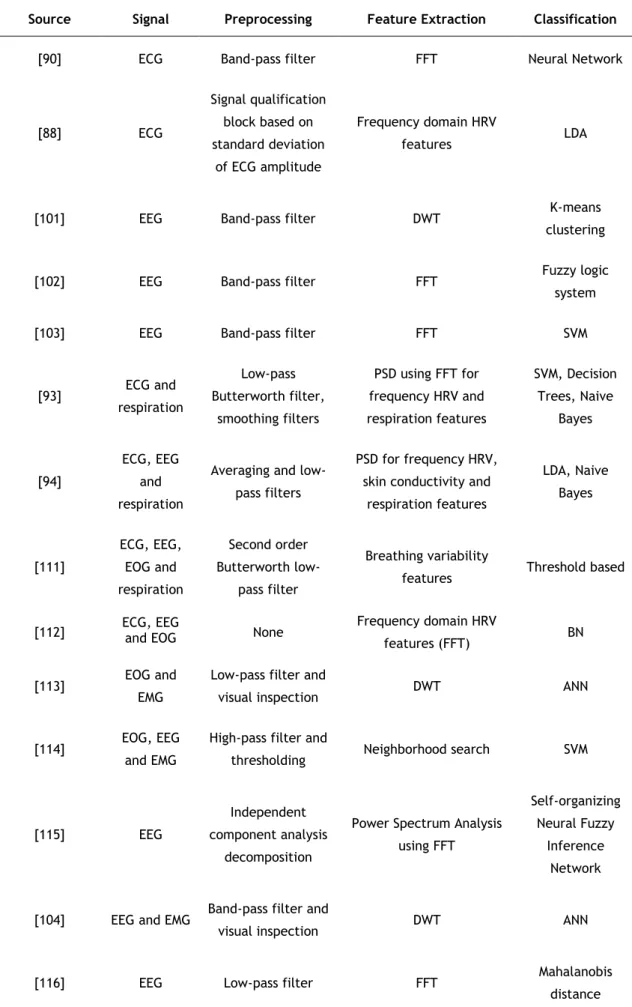
Table 2.3, adapted from [10], [92], reviews some of the approaches used to detect driver drowsiness based on physiologic measures.
16 Literature review
Table 2.3 - List of previous works on driver drowsiness detection using physiological measures.
Source Signal Preprocessing Feature Extraction Classification
[90] ECG Band-pass filter FFT Neural Network
[88] ECG Signal qualification block based on standard deviation of ECG amplitude Frequency domain HRV features LDA
[101] EEG Band-pass filter DWT K-means
clustering
[102] EEG Band-pass filter FFT Fuzzy logic
system
[103] EEG Band-pass filter FFT SVM
[93] ECG and respiration Low-pass Butterworth filter, smoothing filters PSD using FFT for frequency HRV and respiration features SVM, Decision Trees, Naive Bayes [94] ECG, EEG and respiration
Averaging and low-pass filters
PSD for frequency HRV, skin conductivity and
respiration features LDA, Naive Bayes [111] ECG, EEG, EOG and respiration Second order Butterworth low-pass filter Breathing variability
features Threshold based
[112] ECG, EEG and EOG None Frequency domain HRV
features (FFT) BN
[113] EOG and
EMG
Low-pass filter and
visual inspection DWT ANN
[114] EOG, EEG
and EMG
High-pass filter and
thresholding Neighborhood search SVM
[115] EEG
Independent component analysis
decomposition
Power Spectrum Analysis using FFT
Self-organizing Neural Fuzzy
Inference Network
[104] EEG and EMG Band-pass filter and
visual inspection DWT ANN
[116] EEG Low-pass filter FFT Mahalanobis
2.2 Drowsiness detection methods 17
Source Signal Preprocessing Feature Extraction Classification
[117] EEG Band-pass filter FFT
Linear Regression
Model
[95] EEG and ECG None
Mean power frequency EEG features and frequency domain HRV features (PSD) using FFT
Threshold based
It is important to take into account, that, although, in comparison, physiologic signals are one of the most reliable ways to detect drowsiness, they still have some limitations. For example, while EEG is excellent to distinguish between awake and sleep states, there might be some limitations when identifying the transitions state. Heart rate measures, as stated, generally have differences between alert and drowsy states, nonetheless heart rate is also affected by other factors.
2.2.5 Hybrid methods
As described over the previous sections, each measurement method has its strengths and weaknesses. Subjective measures are important as a support or ground truth but are not feasible for a real time monitoring system.
Vehicle-based measures provide satisfactory results, however, they tend to be too dependent on the geometric characteristics of the road (road marking, climatic and lighting conditions), and to a lesser extent the kinetic characteristics of the vehicle [10]. These measures can also be influenced by other driver states that not drowsiness as visual distraction (texting task).
Behavioral measures, although non-intrusive and easy to use, still have some drawbacks that must be considered in visual data acquisition from driver, as illumination and items used by driver such as glasses [19].
Physiologic measures generally provide the most accurate values and the biggest limitations is their intrusive nature. Although less intrusive measurements of some signal as the ECG have already been developed, signal quality is still lost, and for other methods as EEG and EOG, electrodes still need to be placed on the scalp or eye area in an intrusive manner [20].
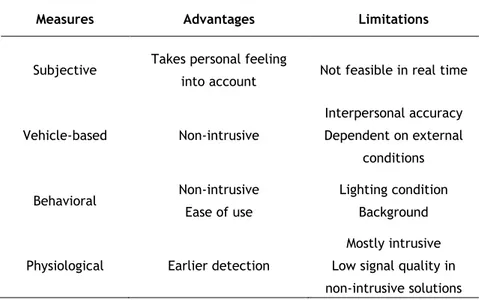
A summary of advantages and limitations of each method is presented in Table 2.4 (adapted from [38]).
18 Literature review
Table 2.4 – Comparison between different drowsiness measurement types.
Measures Advantages Limitations
Subjective Takes personal feeling
into account Not feasible in real time
Vehicle-based Non-intrusive Interpersonal accuracy Dependent on external conditions Behavioral Non-intrusive Ease of use Lighting condition Background
Physiological Earlier detection
Mostly intrusive Low signal quality in non-intrusive solutions
To obtain the best possible results, a promising option is to use several of the referred methods, creating a hybrid system from visual, physiological and driving behavior measures.
Although some works have already combined different drowsiness detection methods, there is still a big room to improvements [19]. An example of an hybrid drowsiness detection system is the work of [105] which included a system combining facial features, eye movement, and a physiologic signal, photoplethysmogram. Drowsiness analysis with driver’s facial data and steering wheel data was also performed by [118]. Vehicle-based and behavioral measures are also combined in [119]. Works as [1] have combined all the measurement types, using indicators such as heart rate variability, respiration rate, head and eyelid movements (blink duration, frequency and PERCLOS), time-to-lane-crossing, speed, steering wheel angle and position on the lane.
The proposed thesis goal fits in hybrid system methods group, as it will focus on the fusion of information obtained by physiologic signals (ECG) and from behavioral measurements.
2.3 Commercial solutions
From the above mentioned measures used for driver drowsiness detection, several systems have already been developed and commercialized.
Most systems use vehicle-based measures and/or behavioral measures. For example, Bosch [120], [121] develops solutions as a steering-angle sensor that is sold to car manufacturers. In addition, from driver’s steering behavior, the system algorithm evaluates approximately 70 signals received via the vehicle’s Controller Area Network (CAN), among them the length of a trip, use of turn signals, and the time of day. The function calculates the driver’s level of fatigue. If that level exceeds a certain value, an icon such as a coffee cup flashes on the instrument panel to warn drivers that they need a rest. This solution is used for example in Volkswagen’s Passat alltrack [13].
Bosch is also developing a camera system, presented in Consumer Electronics Show (CES) 2017 in Las Vegas [17], that will allow face recognition, intelligent personalization and driver drowsiness detection.
2.3 Commercial solutions 19
NVidia, a chip supplier to Audi, Mercedes, Tesla and others also presented at CES 2017, an artificial-intelligence tool (the Co-Pilot) that can learn the behaviors of individual drivers and determine when they are operating outside their norms [18]. The system will evaluate driver’s standard posture, head position, eye-blink rate, facial expression and steering style, among other indexes. Based on a vehicle’s capabilities, the driver will be warned or automatically driven to a safe spot when conditions warrant.
Valeo, a French supplier of automotive technology, also developed a camera [122], [123] that analyses eyelid movement, pupil position, head angle and other key features processing them in real time by an embedded computer. This data is then combined with vehicle trajectory and tracking information to determine how alert or how distracted the driver is, sending a warning if necessary.
MERCEDES Attention Assist™ [14] checks as many as 90 indexes, such as steering wheel angle and lane deviation and external factors as weather and road surface influences, for example, pothole avoidance that may be causing the irregular driving behavior. If the system determines drowsiness is the cause, it will send an audible and visible alert letting the driver know it’s time to take a break.
Driver Alert Control (DAC) by Volvo is a camera-based vehicle system that detects ideal road trajectory and compares it to steering wheel movements. The system provides sound alert and visual notification on instrument cluster (Figure 2.6 from [124]) when drowsiness is detected. Notification is repeated if driver behavior does not improve. The system is designed to function on highways and is activated when the speed exceeds 65 km/h [15], [125].
Figure 2.6 - Driver Alert Control (DAC) warning signal.
The brasillian division of Ford recently proposed the Safe Cap [126], made with special consideration for truck drivers. The Safe Cap includes an accelerometer and a gyroscope that measure drivers head movement. If drowsiness is detected light, sound and vibration warnings are activated to alert the driver.
Some companies have also developed drowsiness solutions based on driver physiological methods.
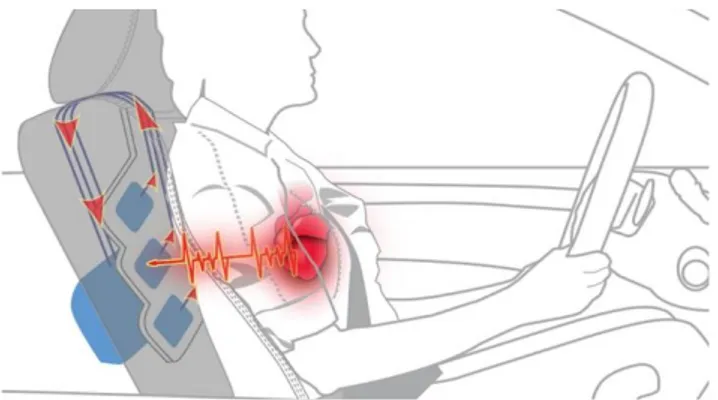
For example Plessey [22] uses a capacitive sensor that enables ECG signal acquisition without the need of skin contact (WARDEN™ system, Figure 2.7, adapted from [22]) .The system uses an array of sensors to detect changes in electric potential in the human body without
20 Literature review
direct skin contact and returns an accurate R peak signal from the users ECG, this in turn can be used to calculate already mention features as heart rate variance (HRV). The WARDEN™ system can be easily and discretely incorporated inside vehicle seatbacks to access the necessary biometric signals and provide earlier warning of drowsiness comparatively to non-physiological methods.
Figure 2.7 - WARDEN™ capacitive system, capable of acquiring ECG without skin contact. Harken [127], a public-private European consortium, is developing a fatigue detector by monitoring cardiac and respiratory rhythms, using an embedded, nonintrusive, acquisition system in the seat cover and safety belt of a car.
StopSleep UK [23] developed an anti-sleep ring, which using cutaneous sensors measures electrodermal activity, evaluating fatigue and alertness levels. As soon as levels of concentration start to decrease, StopSleep will send an alert to the driver (vibration and sound warnings).
Wearvigo [128], produces a wearable, a smart headset, that tracks over 20 parameters, such as blinks related measures, blink rates, blink durations and drooping eyelids, by analyzing biosignal patterns. In addition, with an accelerometer and gyroscope, movements of the head are also measured, as head nods.
CardioID Technologies, a Portuguese company, developed the cardiowheel (Figure 2.8) [129]. Cardiowheel is an Advanced Driver Assistance System that acquires the ECG from the driver’s hands to continuously detect drowsiness. This is done using a custom steering wheel cover equipped with special conductive elements, thus capturing the electrical impulses generated by the heart. In addition, from the measured ECG, it is possible to monitor the heart activity detecting multiple cardiac pathologies. Driver’s identity can also be extracted from the ECG signal.
2.3 Commercial solutions 21
Figure 2.8 – Cardiowheel system developed by CardioID Technologies.
2.4 Experimental setups
Acquiring data to study driver drowsiness is a complex process. Pragmatically, this process can be performed in essentially four types of experimental setups: driving simulators, test tracks, road studies and naturalistic driving studies [130], each of whom presents advantages and disadvantages. A thorough description of the introduced topics is presented next.
2.4.1 Platforms and settings
Driving simulators are middle to high fidelity simulators that provide the driver with an at least somewhat genuine feeling of sitting in a real car. The environment is computer generated, and it is possible to log a host of variables [130].
Tongji advanced driving simulator (Figure 2.9, adapted from [131]), is an example of one the most advanced simulators. It simulates a fully instrumented Renault 23 Megane III vehicle cab in a dome mounted on an 8 degree-of-freedom motion system 24 with an X-Y range of 20 × 5 meters. An immersive 5 projector system provides a front 25 image view.
Figure 2.9 - Tongji advanced driving simulator.
The Swedish National Road and Transport Research Institute (VTI) also has several advanced driving simulators, being the newest the Sim IV. This simulator also has high realistic simulation capacities providing the driver a 210-degree forward field of vision, both longitudinal and lateral acceleration and can simulate a passenger car and a truck compartments.
The NADS-1 advanced driving simulator from university of Iowa [132] and the TruckSIM from University of Leads driving simulator [133] are examples of other equally high realistic simulators.
![Table 2.2, adapted from [10], summarizes some of the works using behavioral methods.](https://thumb-eu.123doks.com/thumbv2/123dok_br/15839207.1084093/27.892.151.788.786.1146/table-adapted-summarizes-works-using-behavioral-methods.webp)