Raviraj Shetty
[email protected]Raghuvir B. Pai
Manipal Institute of Technology Dept. of Mechanical and Manufacturing Eng. Karnataka, IndiaShrikanth S.Rao
National Institute of Technology Department of Mechanical Engineering Karnataka, IndiaRajesh Nayak
Manipal Institute of Technology Dept. of Mechanical and Manufacturing Eng. Karnataka, IndiaTaguchi’s Technique in Machining of
Metal Matrix Composites
This paper presents the study on Taguchi’s optimization methodology, which is applied to optimize cutting parameters in turning of age hardened Al6061-15% vol. SiC 25 µm particle size metal matrix composites with Cubic boron nitride inserts (CBN) KB-90 grade using steam as cutting fluid. Analysis of variance (ANOVA) is used to study the effect of process parameters on the machining process. This procedure eliminates the need for repeated experiments, time and conserves the material by the conventional procedure. The turning parameters evaluated are speed, feed, depth of cut, nozzle diameter and steam pressure. A series of experiments are conducted using PSG A141 lathe (2.2 KW) to relate the cutting parameters on surface roughness, tool wear, cutting force, feed force, and thrust force. The measured results were collected and analyzed with the help of the commercial software package MINITAB15. As well, an orthogonal array, signal-to-noise ratio is employed to analyze the influence of these parameters. The method could be useful in predicting surface roughness, tool wear, cutting force, feed force and thrust force as a function of cutting parameters. From the analysis using Taguchi’s method, results indicate that among the all-significant parameters, steam pressure is the most significant parameter.
Keywords: metal matrix composites, design of experiments, steam, surface roughness, tool wear, cutting force, feed force, thrust force
Introduction
1Metal matrix composites (MMCs) derive their excellent mechanical properties from the combination of a hard reinforcement phase such as silicon carbide (SiC) and a ductile matrix material such as aluminum or magnesium. While current applications for this class of materials are primarily limited to aerospace and automotive applications, their development continues with resulting new products such as high voltage power transmission lines and heat sinks for electronic components (Evans et al, 2003).
In the 1990s, Podgorkv (1992) and Godelvski (1998) proposed a new and pollution-free green cutting technique with water vapor as coolant and lubricant during cutting process. Further fluid jet assisted machining as a highly effective method for cutting of conventional materials has been well explored by various researchers (Li; Seah, 2001) (Li, 1996a, 1996b) (Kaminski; Alvelid, 2000) (Hung; Yeo, 1997) (Weinert, 1993) (Wang; Rajurkar, 1997) (Mazurkiewicz et al., 1989) (Raviraj Shetty et al., 2006a, 2006b, 2006c, 2007a, 2007b) (Shenoy et al., 2006). Fluids such as air, water or steam mainly act as transportation carriers carrying the heat away from the cutting region, and the efficiency of such a cooling method largely depends on the jet pressure. Therefore, it is necessary to understand the relationship among the various controllable parameters and to identify the important parameters that influence the quality of turning. Moreover, it is necessary to optimize (Singh; Kumar, 2004, 2005) (Davim, 2001) the cutting parameters to obtain an extended tool life and a better productivity, which are influenced by surface roughness, tool wear, cutting force, feed force and thrust force. Design of experiment (DOE) is a statistical-based approach to analyze the influence of known process variables over unknown process variables. The present work deals with the aim of understanding the features of DOE for process optimization in turning of age hardened Al6061-15vol.% SiC 25µm particle size with Cubic boron nitride inserts (CBN) KB-90 grade using steam as cutting fluid.
Paper accepted October, 2008. Technical Editor: Anselmo E. Diniz.
Experimental Work
Material
Al–SiC MMC workpiece specimens having aluminum alloy 6061 as the matrix and containing 15% vol. of silicon carbide particles of 25 µm mean diameter in the form of cylindrical bars of 120 mm length and 40 mm diameter are manufactured at Vikram Sarbhai Space Centre (VSSC) Trivandrum by Stir casting process with pouring temperature 700-710°C, stirring rate 195 rpm, extrusion at 457°C, extrusion ratio 30:1, direct extrusion speed 6.1m/min to produce Ø40 mm cylindrical bars. The specimens were solutions treated for 2h at a temperature of 540oC in a muffle furnace; Temperatures were accurate to within ±2oC and quench delays in all cases were within 20 s. After solutionising, the samples were water quenched to room temperature, and subsequently aged for six different times to obtain samples with different Brinell hardness number (BHN), out of which one sample were selected, one with 94 BHN obtained at peakage condition, i.e. 2h at 220oC respectively. Sample selected were kept in a refrigerator right after the heat treatments. Figure 1 shows the Photo micrographic image of Al-SiCp.
Machining Test
The chemical composition of specimen is shown in Tab. 1. Turning method as a machining process was selected. The experimental study was carried out in PSG A141 lathe (2.2 KW). The selected cutting tool was Cubic Boron Nitride inserts KB-90 (ISO code), for machining of MMC materials. The ISO codes of cutting tool insert and tool holder were shown in Tab. 2, respectively. The level of variables used in the experiment were given in Tab. 3 with steam as cutting fluid and completed after 80s turning period. Surface condition of machined workpiece tool wear was observed using JEOL JSM-6380LA analytical scanning electron microscope. The cutting force and thrust force were measured by using an IEICOS Digital tool dynamometer respectively. Surface roughness was measured using Taylor/Hobson surtronoic 3+ surface roughness measuring instrument with cut-off length of 25.4 mm and averages of four readings were taken. Tool wear measurements were observed using Vision Plus Tool maker microscope METZ-1395 of range from 0-25 mm, least count – 10 µm and averages of four readings were taken. Figure 2 shows surface roughness and force measurement layout.
Table 1. Nominal chemical composition of Base metal (6061 Al alloy).
Element Cu Mg Si Cr Al
Weight.
percentage 0.25 1.0 0.6 0.25 Balance
Table 2. Details of cutting tool and tooling system used for experimentation.
Tool holder Specification STGCR 2020 K-16
CTGPR 1212 F 11
Tool geometry Specification
Approach angle:910 Tool nose radius:0.4 mm Rake angle: 00 Clearance angle: 70 Tool insert CBN (KB-90)
Specification
TPGN160304-LS TPGN 110304-LS
Table 3. Levels of variables used in the experiment.
Levels Low High
-1 1
(A) Cutting speed V (m/min) 45 101
(B) Feed f (mm/rev) 0.11 0.25
(C) Depth of cut(mm) 0.5 1.0
(D) Nozzle diameter (mm) 2 4
(E) Steam Pressure P (bar) 4 10
Figure 2. Surface roughness and force measurement layout.
Steam Generator and Steam Feeding System
In steam lubrication, a steam jet was pumped through a steam hose and expelled through a nozzle on to the cutting zone. The test rig consisted of a saturated steam supplier source, a super heater, a servo valve and a pressure gauge for controlling the supply pressure, nozzle, and steam flow meter for steam flow rate measurements. The steam temperature at the exit of the nozzle was maintained at 110oC, flow quantity of 36 l/h. Figure 3 shows the steam generator and steam feeding system.
Figure 3. Steam generator and steam feeding system.
Taguchi’s Method
Taguchi’s techniques have been used widely in engineering design (Ross, 1996) (Phadke, 1989). The main trust of Taguchi’s techniques is the use of parameter design, which is an engineering method for product or process design that focuses on determining the parameter (factor) settings producing the best levels of a quality characteristic (performance measure) with minimum variation. Taguchi designs provide a powerful and efficient method for designing processes that operate consistently and optimally over a variety of conditions. To determine the best design, it requires the use of a strategically designed experiment, which exposes the process to various levels of design parameters.
• nominal is the best characteristic
2
10 log
y
S y
N= s
(1)
• smaller is the best characteristic
(
2)
1 10 logS
y
N= − n
∑
(2)
• and larger the better characteristic
2
1 1
log
S
N n y
⎛ ⎞
= − ⎜ ⎟
⎝
∑
⎠(3)
where y is the average of observed data, 2
y
s
the variation of y, n the number of observations, and y the observed data or each type of the characteristics, with the above S/N ratio transformation the smaller the S/N ratio, the better is the result when we consider tool wear, surface roughness, cutting force and trust force.Two levels were specified for each of the factors as indicated in Tab. 3. The orthogonal array chosen was L32, which has 32 rows
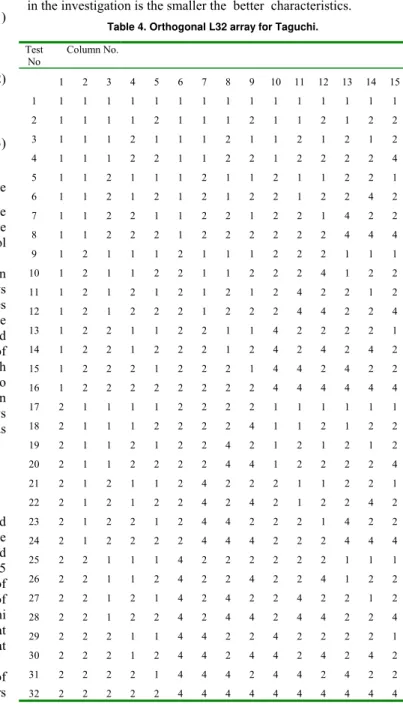
corresponding to the number of parameter combinations (31 degrees of freedom), with 15 columns at two levels as shown in Tab. 4. The first column was assigned to the cutting speed (m/min), the second column to the feed rate (mm/rev), the third column to the depth of cut (mm), the fourth column to the nozzle diameter (mm), the fifth column to the steam pressure (bar), and the remaining columns to the interactions. One test was performed for each combination resulting in a total of 32 tests (no replications), which allows analysis of the variance of the results. Also a random order was determined for running the tests.
Experimental Results and Data Analysis
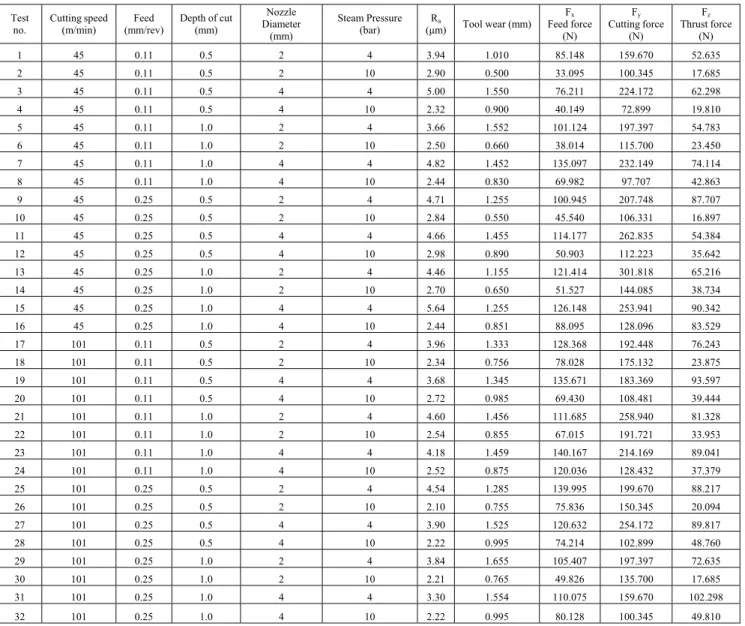
The plan of experiment is to find the important factors and combination of factors influencing the machining process to achieve the low surface roughness, tool wear, cutting force, feed force and thrust force values by using smaller the better characteristic. Table 5 illustrates the experimental results. The purpose of analysis of variance is to determine the parameters and combination of parameters significantly affecting the machining process. Taguchi recommends analyzing the S/N ratio using conceptual approach that involves graphing the effects and visually identifying the factors that appear to be significant.
The experimental results were analyzed with analysis of variance (ANOVA), which is used for identifying the factors significantly affecting the performance measures. The results of the ANOVA with the surface roughness, tool wear, cutting force, feed force and thrust force are shown in Tabs. 6-15. This analysis was carried out for a significance level of α = 0.05, i.e. for a confidence level of 95%. Tables 6 -15 show the P-values, that is, the realized significance levels, associated with the F-tests for each source of variation. The sources with a P-value less than 0.05 are considered to have a statistically significant contribution to the performance measures.
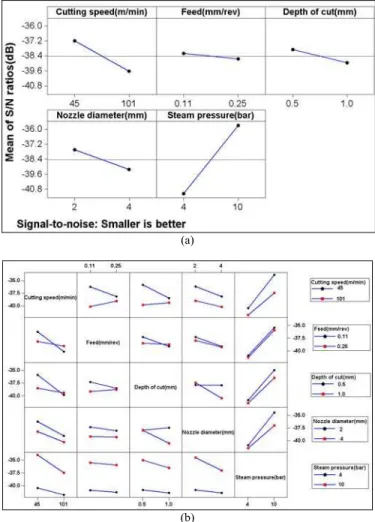
Effect of Control Parameters on Surface Roughness
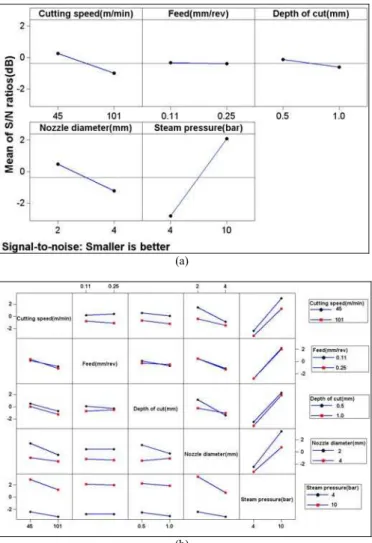
The calculated S/N ratio for five factors on the surface roughness in machining of MMCs for each level is shown in Fig. 4a. As shown in Tab. 6 and Figs. 4a-b steam pressure is a dominant parameter on the surface roughness followed by feed. The cutting speed had a lower effect on the surface roughness. Lower surface
roughness is always preferred. The quality characteristic considered in the investigation is the smaller the better characteristics.
Table 4. Orthogonal L32 array for Taguchi.
Test No
Column No.
1 2 3 4 5 6 7 8 9 10 11 12 13 14 15
1 1 1 1 1 1 1 1 1 1 1 1 1 1 1 1
2 1 1 1 1 2 1 1 1 2 1 1 2 1 2 2
3 1 1 1 2 1 1 1 2 1 1 2 1 2 1 2
4 1 1 1 2 2 1 1 2 2 1 2 2 2 2 4
5 1 1 2 1 1 1 2 1 1 2 1 1 2 2 1
6 1 1 2 1 2 1 2 1 2 2 1 2 2 4 2
7 1 1 2 2 1 1 2 2 1 2 2 1 4 2 2
8 1 1 2 2 2 1 2 2 2 2 2 2 4 4 4
9 1 2 1 1 1 2 1 1 1 2 2 2 1 1 1
10 1 2 1 1 2 2 1 1 2 2 2 4 1 2 2
11 1 2 1 2 1 2 1 2 1 2 4 2 2 1 2
12 1 2 1 2 2 2 1 2 2 2 4 4 2 2 4
13 1 2 2 1 1 2 2 1 1 4 2 2 2 2 1
14 1 2 2 1 2 2 2 1 2 4 2 4 2 4 2
15 1 2 2 2 1 2 2 2 1 4 4 2 4 2 2
16 1 2 2 2 2 2 2 2 2 4 4 4 4 4 4
17 2 1 1 1 1 2 2 2 2 1 1 1 1 1 1
18 2 1 1 1 2 2 2 2 4 1 1 2 1 2 2
19 2 1 1 2 1 2 2 4 2 1 2 1 2 1 2
20 2 1 1 2 2 2 2 4 4 1 2 2 2 2 4
21 2 1 2 1 1 2 4 2 2 2 1 1 2 2 1
22 2 1 2 1 2 2 4 2 4 2 1 2 2 4 2
23 2 1 2 2 1 2 4 4 2 2 2 1 4 2 2
24 2 1 2 2 2 2 4 4 4 2 2 2 4 4 4
25 2 2 1 1 1 4 2 2 2 2 2 2 1 1 1
26 2 2 1 1 2 4 2 2 4 2 2 4 1 2 2
27 2 2 1 2 1 4 2 4 2 2 4 2 2 1 2
28 2 2 1 2 2 4 2 4 4 2 4 4 2 2 4
29 2 2 2 1 1 4 4 2 2 4 2 2 2 2 1
30 2 2 2 1 2 4 4 2 4 4 2 4 2 4 2
31 2 2 2 2 1 4 4 4 2 4 4 2 4 2 2
32 2 2 2 2 2 4 4 4 4 4 4 4 4 4 4
In the present investigation, when the steam pressure is set at 10 bar the surface roughness is minimized. Contrary to the steam pressure, feed had the maximum effect. The reason being that the increase in feed increases the heat generation and hence the tool wear, which results in higher surface roughness. The increase in feed also increases the chatter, and it produces incomplete machining of work piece, which leads to higher surface roughness. The results shown prove that the roughness of the machined surface is highly influenced by the feed. Based on the above discussion and also in the evident optimum conditions for the surface roughness, it can be established: cutting speed (a): 101 m/min, feed (b): 0.11 mm/rev, depth of cut (c): 1 mm, nozzle diameter (d): 2mm, steam pressure (e): 10 bar.
Table 5. Experimental results for surface roughness, tool wear, cutting force, feed force and thrust force.
Test no.
Cutting speed (m/min)
Feed (mm/rev)
Depth of cut (mm)
Nozzle Diameter
(mm)
Steam Pressure (bar)
Ra
(µm) Tool wear (mm)
Fx
Feed force (N)
Fy
Cutting force (N)
Fz
Thrust force (N)
1 45 0.11 0.5 2 4 3.94 1.010 85.148 159.670 52.635
2 45 0.11 0.5 2 10 2.90 0.500 33.095 100.345 17.685
3 45 0.11 0.5 4 4 5.00 1.550 76.211 224.172 62.298
4 45 0.11 0.5 4 10 2.32 0.900 40.149 72.899 19.810
5 45 0.11 1.0 2 4 3.66 1.552 101.124 197.397 54.783
6 45 0.11 1.0 2 10 2.50 0.660 38.014 115.700 23.450
7 45 0.11 1.0 4 4 4.82 1.452 135.097 232.149 74.114
8 45 0.11 1.0 4 10 2.44 0.830 69.982 97.707 42.863
9 45 0.25 0.5 2 4 4.71 1.255 100.945 207.748 87.707
10 45 0.25 0.5 2 10 2.84 0.550 45.540 106.331 16.897
11 45 0.25 0.5 4 4 4.66 1.455 114.177 262.835 54.384
12 45 0.25 0.5 4 10 2.98 0.890 50.903 112.223 35.642
13 45 0.25 1.0 2 4 4.46 1.155 121.414 301.818 65.216
14 45 0.25 1.0 2 10 2.70 0.650 51.527 144.085 38.734
15 45 0.25 1.0 4 4 5.64 1.255 126.148 253.941 90.342
16 45 0.25 1.0 4 10 2.44 0.851 88.095 128.096 83.529
17 101 0.11 0.5 2 4 3.96 1.333 128.368 192.448 76.243
18 101 0.11 0.5 2 10 2.34 0.756 78.028 175.132 23.875
19 101 0.11 0.5 4 4 3.68 1.345 135.671 183.369 93.597
20 101 0.11 0.5 4 10 2.72 0.985 69.430 108.481 39.444
21 101 0.11 1.0 2 4 4.60 1.456 111.685 258.940 81.328
22 101 0.11 1.0 2 10 2.54 0.855 67.015 191.721 33.953
23 101 0.11 1.0 4 4 4.18 1.459 140.167 214.169 89.041
24 101 0.11 1.0 4 10 2.52 0.875 120.036 128.432 37.379
25 101 0.25 0.5 2 4 4.54 1.285 139.995 199.670 88.217
26 101 0.25 0.5 2 10 2.10 0.755 75.836 150.345 20.094
27 101 0.25 0.5 4 4 3.90 1.525 120.632 254.172 89.817
28 101 0.25 0.5 4 10 2.22 0.995 74.214 102.899 48.760
29 101 0.25 1.0 2 4 3.84 1.655 105.407 197.397 72.635
30 101 0.25 1.0 2 10 2.21 0.765 49.826 135.700 17.685
31 101 0.25 1.0 4 4 3.30 1.554 110.075 159.670 102.298
32 101 0.25 1.0 4 10 2.22 0.995 80.128 100.345 49.810
On the examination of the percentage of contribution (P%) of the different factors for surface roughness, Tab. 6, it can be seen that the steam pressure has the highest contribution of about 80.22%; thus steam pressure is an important factor to be taken into consideration while machining MMCs followed by feed (b) (P = 10.00%) and cutting speed (a) (P = 4.90%). Interactions do not present a statistical significance or a percentage of physical significance of contribution to the surface roughness. Figure 5 shows the SEM images showing the surface roughness on Al-SiC at steam pressure 4 bar and 10 bar.
Effect of Control Parameter on Tool Wear
Studies on tool wear have found that tool wear is predominantly caused by abrasion of the hard reinforcement particles in the MMCs. From Figures 5a-b it is very much clear that tool wear is lesser under 10 bar steam pressure compared to 4 bar. This is because lubrication effect of the steam jet enables the formation of saw-toothed type chips and more gaps appear at the chip and tool interface. This increase in gaps at the interface contributes to the higher penetrating ability of the steam and thus explains how very low tool wear readings are observed compared to 4 bar.
The calculated S/N ratio for five factors on the tool wear in machining of MMCs for each level is shown in Fig. 6a-b. As shown in Tab. 8 and in Figs. 6a-b, steam pressure is a dominant parameter on the tool wear. Based on the above discussion and also evident from Table 5a-b, the optimum conditions for the surface roughness can be established at cutting speed (a): 45 m/min, feed (b): 0.11 mm/rev, depth of cut (c): 1 mm, nozzle diameter (d): 2 mm, steam pressure (e): 10 bar.
Table 9 shows the ranking of each cutting parameter using the response table for signal to noise ratios (smaller is better) obtained for different parameter levels.
Table 6. Analysis of Variance for S/N ratios for surface roughness.
Source DF Seq SS Adj SS Adj MS F P P(%)
a
(m/min) 1 9.565 9.565 9.565 9.95 0.006 4.90
b
(mm/rev) 1 0.002 0.002 0.002 30 0.963 10.00
c (mm) 1 0.246 0.246 0.246 0.26 0.620 0.13
d (mm) 1 0.066 0.066 0.066 0.07 0.797 0.03
e (bar) 1 176.027 176.027 176.027 150.11 0.000 80.22
a x b 1 5.802 5.802 5.802 6.04 0.056 2.98
a x c 1 0.244 0.244 0.244 0.25 0.621 0.12
a x d 1 1.178 1.178 1.178 1.23 0.285 0.61
a x e 1 0.111 0.111 0.111 0.12 0.738 0.06
b x c 1 0.525 0.525 0.525 0.55 0.470 0.27
b x d 1 0.230 0.230 0.230 0.24 0.632 0.12
b x e 1 0.617 0.617 0.617 0.64 0.435 0.32
c x d 1 0.024 0.024 0.024 0.02 0.877 0.01
c x e 1 0.160 0.160 0.160 0.17 0.689 0.08
d x e 1 0.311 0.311 0.311 0.32 0.578 0.16
Residual
Error 16 15.381 15.381 0.961
Total 31 210.489
Table 7. Response table for S/N ratios - smaller is better (surface roughness).
Level a (m/min) b (mm/rev) c (mm) d (mm) e (bar)
1 -10.803 -10.265 -10.344 -10.211 -12.602
2 -9.71 -10.248 -10.169 -10.302 -7.911
Delta 1.093 0.016 0.175 0.091 4.691
Rank 2 5 3 4 1
Table 8. Analysis of variance for S/N ratios for tool wear.
Source DF Seq SS Adj SS Adj MS F P P(%)
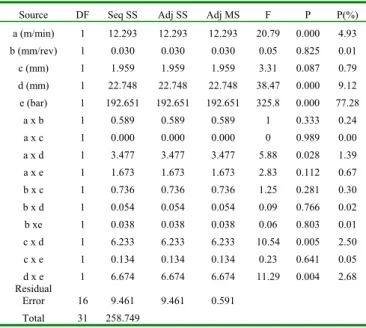
a (m/min) 1 12.293 12.293 12.293 20.79 0.000 4.93
b (mm/rev) 1 0.030 0.030 0.030 0.05 0.825 0.01
c (mm) 1 1.959 1.959 1.959 3.31 0.087 0.79
d (mm) 1 22.748 22.748 22.748 38.47 0.000 9.12
e (bar) 1 192.651 192.651 192.651 325.8 0.000 77.28
a x b 1 0.589 0.589 0.589 1 0.333 0.24
a x c 1 0.000 0.000 0.000 0 0.989 0.00
a x d 1 3.477 3.477 3.477 5.88 0.028 1.39
a x e 1 1.673 1.673 1.673 2.83 0.112 0.67
b x c 1 0.736 0.736 0.736 1.25 0.281 0.30
b x d 1 0.054 0.054 0.054 0.09 0.766 0.02
b xe 1 0.038 0.038 0.038 0.06 0.803 0.01
c x d 1 6.233 6.233 6.233 10.54 0.005 2.50
c x e 1 0.134 0.134 0.134 0.23 0.641 0.05
d x e 1 6.674 6.674 6.674 11.29 0.004 2.68
Residual
Error 16 9.461 9.461 0.591
Total 31 258.749
(a)
(b)
Figure 4. Main effects plot and interaction plot for S/N ratio (surface roughness).
Figure 5. SEM images showing the surface roughness on Al-SiC at steam pressure (a) 4 bar, and (b)10 bar.
Table 9. Response table for S/N ratios - smaller is better (tool wear).
Level a (m/min) b (mm/rev) c (mm) d (mm) e (bar)
1 0.2567 -0.3326 -0.1157 0.48 -2.8168
2 -0.983 -0.3938 -0.6106 -1.2063 2.0905
Delta 1.2396 0.0612 0.4949 1.6863 4.9073
(a)
(b)
Figure 6. Main effects plot and interaction plot for S/N ratio (tool wear).
Figure 7. SEM picture of the flank wear during machining.
Effect of Control Parameter on Cutting Force, Feed
Force and Thrust Force
In steam application, the cutting fluid is supplied at a high pressure and high velocity, resulting in the formation of minute capillaries, which penetrates in to the tool chip interface causing reduction in frictional contribution of the cutting force, thrust force and feed force. These minute capillaries exist at the tool chip
interface and as the chip moves up it contacts mainly at the top of the asperities and draw in steam, which chemically reacts to produce a thin solid film of low shear strength. This film keeps the chip and the tool apart and it causes reduction in friction. At 10 bar, this high pressure steam is fragmented into tiny globules and the size of it is inversely proportional to the pressure of injection. The velocity varies as a function of the square root of the injection pressure. This high velocity facilitates better penetration of the steam to the underside of the chip, facilitating its passage to the tool chip interface and resulting in the reduction of friction. Such a condition is not possible in oil water emulsion, where no such fragmentation is taking place and the kinetic energy of the fluid jet is in no way comparable to that during steam injection. The calculated S/N ratio for five factors on the surface roughness in machining of MMCs for each level is shown in Figs. 8a-b, 9a-b, and 10a-b. As shown in Tabs. 10, 12, 14 and in Figs. 8a-b, 9a-b, 10a-b, steam pressure is a dominant parameter on the cutting force, thrust force and feed force. Based on the above discussion and also evident from the optimum conditions for the cutting force, thrust force and feed force, it can be established: cutting speed (a): 45 m/min, feed (b): 0.11 mm/rev, depth of cut (c): 0.5mm, nozzle diameter (d): 4 mm, steam pressure (e): 10 bar.
Tables 11, 13, 15 show the ranking of each cutting parameter using the response table for signal to noise ratios (smaller is better) obtained for different parameter levels.
Table 10. Analysis of variance for S/N ratios for cutting force.
Source DF Seq SS Adj SS Adj MS F P P (%)
a (m/min) 1 16.183 16.183 16.183 14.96 0.001 5.28
b (mm/rev) 1 5.863 5.863 5.863 5.42 0.033 1.91
c (mm) 1 4.270 4.270 4.270 3.95 0.064 1.39
d (mm) 1 9.988 9.988 9.988 9.23 0.008 3.26
e (bar) 1 205.794 205.794 205.794 190.28 0.000 67.20
a x b 1 18.889 18.889 18.889 17.46 0.001 6.17
a x c 1 8.364 8.364 8.364 7.73 0.013 2.73
a x d 1 0.010 0.010 0.010 0.01 0.925 0.00
a x e 1 9.302 9.302 9.302 8.6 0.010 3.04
b x c 1 0.100 0.100 0.100 0.09 0.765 0.03
b x d 1 2.916 2.916 2.916 2.7 0.120 0.95
b x e 1 2.633 2.633 2.633 2.43 0.138 0.86
c x d 1 3.770 3.770 3.770 3.49 0.080 1.23
c x e 1 4.375 4.375 4.375 4.05 0.061 1.43
d x e 1 13.810 13.810 13.810 12.77 0.003 4.51
Residual Error 16 17.304 17.304 1.082
Total 31 323.570
Table 11. Response table for S/N ratios - smaller is better (cutting force).
Level a (m/min) b (mm/rev) c (mm) d (mm) e (bar)
1 -43.32 -43.61 -43.67 -43.48 -46.57
2 -44.75 -44.46 -44.4 -44.59 -41.5
Delta 1.42 0.86 0.73 1.12 5.07
On the examination of the percentage of contribution (P%) of the different factors (Tables 10, 12, 14), for cutting force, thrust force and feed force, it can be seen that steam pressure has the highest contribution of about 67.20%, 58.32 and 67.14; thus steam pressure is an important factor to be taken into consideration while machining MMCs. Interactions do not present a statistical significance, nor a percentage of physical significance of contribution to the surface roughness.
Table 12. Analysis of variance for S/N ratios for feed force.
Source DF Seq SS Adj SS Adj MS F P P (%)
a (m/min) 1 50.604 50.604 50.604 77.65 0.000 12.75
b (mm/rev) 1 1.003 1.003 1.003 1.54 0.233 0.25
c (mm) 1 7.899 7.899 7.899 12.12 0.003 1.99
d (mm) 1 21.537 21.537 21.537 33.05 0.000 5.43
e (bar) 1 231.384 231.384 231.384 355.04 0.000 58.32
a x b 1 19.922 19.922 19.922 30.57 0.000 5.02
a x c 1 20.651 20.651 20.651 31.69 0.000 5.21
a x d 1 0.740 0.740 0.740 1.14 0.302 0.19
a x e 1 11.177 11.177 11.177 17.15 0.001 2.82
b x c 1 4.330 4.330 4.330 6.64 0.020 1.09
b x d 1 1.183 1.183 1.183 1.82 0.197 0.30
b x e 1 0.010 0.010 0.010 0.02 0.904 0.00
c x d 1 15.735 15.735 15.735 24.14 0.000 3.96
c x e 1 1.280 1.280 1.280 1.96 0.180 0.32
d x e 1 9.319 9.319 9.319 14.3 0.002 2.35
Residual Error 16 10.428 10.428 0.652
Total 31 407.203
Table 13. Response table for S/N ratios - smaller is better (feed force).
Level a (m/min) b (mm/rev) c (mm) d (mm) e (bar)
1 -37.21 -38.29 -37.97 -37.64 -41.15
2 -39.72 -38.64 -38.96 -39.28 -35.77
Delta 2.52 0.35 0.99 1.64 5.38
Rank 2 5 4 3 1
Table 14. Analysis of variance for S/N ratios for thrust force.
Source DF Seq SS Adj SS Adj MS F P P (%)
a (m/min) 1 14.776 14.776 14.776 4.02 0.062 2.06
b (mm/rev) 1 12.071 12.071 12.071 3.29 0.089 1.68
c (mm) 1 25.715 25.715 25.715 7 0.018 3.58
d (mm) 1 77.313 77.313 77.313 21.05 0.000 10.78
e (bar) 1 481.481 481.481 481.481 131.11 0.000 67.14
a x b 1 16.593 16.593 16.593 4.52 0.049 2.31
a x c 1 21.470 21.470 21.470 5.85 0.028 3.00
a x d 1 0.924 0.924 0.924 0.25 0.623 0.13
a x e 1 6.718 6.718 6.718 1.83 0.195 0.94
b x c 1 0.047 0.047 0.047 0.01 0.911 0.01
b x d 1 5.767 5.767 5.767 1.57 0.228 0.80
b x e 1 0.608 0.608 0.608 0.17 0.690 0.09
c x d 1 4.637 4.637 4.637 1.26 0.278 0.65
c x e 1 15.353 15.353 15.353 4.18 0.058 2.14
d x e 1 33.628 33.628 33.628 9.16 0.008 4.69
Residual Error 16 58.759 58.759 3.672
Total 31 775.860
Table 15. Response table for S/N ratios - smaller is better (thrust force).
Level a (m/min) b (mm/rev) c (mm) d (mm) e (bar)
1 -33.01 -33.08 -32.79 -32.14 -37.57
2 -34.37 -34.31 -34.59 -35.25 -29.81
Delta 1.36 1.23 1.79 3.11 7.76
Rank 4 5 3 2 1
(a)
(b)
Figure 8. Main effects plot and interaction plot for S/N ratio (cutting force).
Conclusions
At the end of this work we thought of establishing a few valid conclusions for turning age hardened Al6061-15% vol. SiC 25 µm particle size with Cubic Boron Nitride inserts (CBN) KB-90 grade, using steam as cutting fluid and considering the methodology used.
The steam pressure is the most important parameter and has the highest physical as well statistical influence on surface roughness, tool wear, cutting force, feed force and thrust force (80.22%, 77.28%, 67.20%, 58.32% and 67.14% respectively)
(a)
(b)
Figure 9. Main effects plot and interaction plot for S/N ratio (feed force).
The interaction cutting speed/feed is the physical significance to the interactions analyzed in the surface roughness required to perform the machining operation.
The ranking of each cutting parameter using the response table for signal to noise ratios (smaller is better) obtained for different parameter levels shows steam pressure as the dominant factor during machining.
The influence of operating parameters in steam application was evaluated and it was observed that the cutting performance mainly depends on fluid application parameters such as steam pressure and nozzle diameter. It is clearly seen from the results that by carefully choosing these parameters it is possible to produce high quality components under steam application.
The results of the study show that with a proper selection of machining parameters, it is possible to obtain a better performance under steam lubrication conditions in turning of MMCs.
References
Davim, J.P., 2001, “A note on the determination of optimal cutting conditions for surface finish obtained in turning using design of experiments”, Journal of Materials Processing Technology, Vol. 116, pp. 305–308.
Davim, J.P., 2003, “Design optimization of cutting parameters for turning metal matrix composites based on the orthogonal arrays”, Journal of Materials Processing Technology, Vol. 132, pp. 340–344.
Evans, A., Marchi, C.S., Mortenson, A., 2003, “Metal Matrix Composites in Industry - an Introduction and a Survey”, Kluwer, Boston.
(a)
(b)
Figure 10. Main effects plot and interaction plot for S/N ratio (thrust force).
Ghani , J.A., Choudhury , I.A., Hassan, H.H., 2004, “Application of Taguchi method in the optimization of end milling operations”, Journal of Materials Processing Technology, Vol. 145, pp. 84–92.
Godlevski V.A., 1998, “Water steam lubrication during machining”,
Tribologia, Vol. 162, No. 6, 11, pp. 890–901.
Hung, N.P., Yeo, H., B.E., 1997, “On effect of cutting fluid on the machinability of metal matrix composites”, Journal of Materials Processing Technology, Vol. 67 ,pp. 157 –161.
Kaminski, J., Alvelid, B., 2000, “ Temperature reduction in the cutting zone in water-jet assisted turning”, Material Processing Technology, Vol. 106, pp.68–73.
Li, X.P., 1996a, “Study of the jet-flow rate of cooling in machining - part 1 - theoretical analysis”, Material Processing Technology, Vol. 62, pp.149–156.
Li, X.P., 1996b, “Study of the jet-flow rate of cooling in machining - part 2 - simulation study”, Material Processing Technology, Vol. 62, pp.157– 165.
Li, X.P., Seah, W.K.H., 2001, “Tool wear acceleration in relation to work piece reinforcement percentage in cutting metal matrix composites”,
Wear, Vol. 247, pp.161–171.
Lin. T.R., 2002, “Experimental design and performance analysis of TiN coated carbide tool in face milling stainless steel”, Journal of Materials Processing Technology, Vol. 127, pp.1–7.
Mazurkiewicz, M., Kubala, Z., Chow, J., 1989, “Metal machining with high pressure water-jet cooling assistance - a new possibility”, Engineering Industries, Vol. 111, pp.7–12.
Nian, C.Y., Yang, W.H., Tarng, Y.S., 1999, “Optimization of turning operations with multiple performance characteristics”, Journal of Materials Processing Technology, Vol. 95, pp. 90–96.
Podgorkov, V.V., 1992, Patent of USSR 1549721 MCI B23Q, Method of cutting in application, Russia.
Raviraj Shetty, Pai, R.B., Rao, S.S., Barboza, A.B.V., 2006a, “Tribological studies on PCBN tool in turning metal matrix composites with steam as coolant”. In: Proceedings of AUSTRIB´06 Intern. Tribological Conf., Brisbane, Australia (CD-ROM).
Raviraj Shetty, Pai, R.B., Rao, S.S., Kumar, D., 2007a, “Chip and built-up edge formation in turning age hardened AA6061/15 vol. % SiCp composites with steam as coolant”. In: Proc. of ICRAM´07 2nd Intern. Conf. on Recent Advances in Composite Materials, New Delhi, India (CD-ROM).
Raviraj Shetty, Pai, R.B., Rao, S.S., Rajesh Nayak., 2006b, “Tribological studies of steam penetration in different directions in turning of metal matrix composites using steam as coolant”. In: Proc. of ICIT´06 Intern. Conf. on Industrial Tribology, Bangalore, India (CD-ROM).
Raviraj Shetty, Pai, R.B., Rao, S.S., Shenoy, B.S., 2006c, “Study of tool wear in turning 15% SiCp reinforced 6061 aluminium metal matrix composite with steam as coolant”. In: Proc. of APMC´06 Intern.l Conf. on Advanced Material processing and characterization, Chennai, India (CD-ROM).
Raviraj Shetty, Pai, R.B., Rao, S.S., Vasudev M., 2007b, “Influence of lubrication condition on surface roughness in turning of metal matrix composites”. In: Proc. of ICCST 6th Intern. Conf. on Composite Science and Technology, Durban , South Africa (CD-ROM).
Ross., P.J., 1996, “Taguchi Techniques for Quality Engineering: Loss Function, Orthogonal Experiments, Parameter and Tolerance Design - 2nd ed.”, New York, NY: McGraw-Hill;
Shenoy, B.S., Raviraj Shetty, Pai, R.B., Rao, S.S., 2006, “Application of Finite-element analysis in orthogonal cutting of aluminium metal matrix composites”. In: Proceedings of ICAME’06 International Conference on Advances in Mechanical Engineering, Chennai, India (CD-ROM).
Singh, H., Kumar, P., 2004, “Tool wear optimization in turning operation by Taguchi method”, Indian Journal of. Engineering Material Science., Vol. 11, pp. 19–24.
Singh, H., Kumar, P., 2005, “Optimizing cutting force for turned parts using Taguchi’s parameter design approach”, Indian Journal of. Engineering Material Science., Vol. 12, pp. 97–103.
Su, Y.L., Yao, S.H., Wei, C.S., Kao , W.H., Wu, C.T., 1999, “Design and performance analysis of TiCN-coated cemented carbide milling cutters”,
Journal of Materials Processing Technology, Vol. 87, pp. 82–89.
Wang, Z.Y., Rajurkar, K.P., 1997, “Optimal wear of CBN tool in turning of silicon nitride with cryogenic cooling”, Machine. Tools and Manufacturing, Vol. 37, No.3, pp. 319-326.
Weinert, K.,1993, “A consideration of tool wear mechanism when machining metal matrix composites (MMC)”, Ann. of CIRP, Vol. 42, pp.95-98.