Residential Hybrid Ventilation Systems in Portugal:
Experimental Characterization
Manuel Pinto
1, Vasco Peixoto de Freitas
2,
João Carlos Viegas
3, Luís Matias
31
Department of Civil Engineering, Viseu Polytechnic Institute, Repeses Campus, 3504-510 VISEU, PORTUGAL
email: [email protected] 2
Building Physics Laboratory - Faculdade de Engenharia da Universidade do Porto Rua Dr. Roberto Frias, 4200-465 PORTO, PORTUGAL
3
National Laboratory of Civil Engineering, Av. do Brasil, 101, P-1700-066 LISBOA, PORTUGAL
Summary: Due to the variation in natural factors, such as wind speed and the stack effect, natural ventilation systems are unlikely to provide permanent ideal ventilation rates. As such, this paper will characterize the performance of hybrid ventilation systems that are a possible solution to this drawback. This project presents the experimental study characterizing the hybrid ventilation system in a 100-apartment residential complex in the Porto area. The results of the measurements of temperature, humidity, flow rates in ducts, ACH by the PFT technique and weather conditions taken in seven flats are presented.
Keywords: ventilation, dwellings, air change rate (ACH), PFT. Category:Case Studies
1 Introduction
The Portuguese standard for the natural ventilation of residential buildings [1] recommends an average of one ACH in main rooms (bedrooms and living/dining rooms) and four ACHs for service rooms (kitchens and bathrooms). Most recently built residential buildings might not comply with these rates [2]. “General and permanent ventilation” systems with continuous air admission through the main rooms and air exhaust in the service rooms must be implemented [3], [4].
The study analyzes seven flats, six of which have a hybrid ventilation system (continuous exhaust system in the kitchen and natural exhaust in the bathroom). The seventh flat has a natural ventilation system, in order to compare the performance of the two systems. The flats were selected to represent different orientations and different heights above ground (see Fig. 1).
3rd and 5th flat: 1st + 4th floor (hybrid system)
1st and 2nd flat: 1st + 4th floor (hybrid system)
4th flat:
2nd floor (natural system)
6th and 7th flat: 1st + 4th floor (hybrid system)
Fig. 1. Residential building containing the seven flats to be tested.
The following tests were performed:
- Window and inlet air permeability – in laboratory;
- Whole building air permeability of the flats
(ACH50);
- Inside and outside conditions (wind, temperature and relative humidity);
- Flow and temperature inside a bathroom duct; - PFT test (one week) simultaneously in the seven
flats;
- Thermal comfort conditions: PMV - Predicted mean vote and PPD - Predicted percentage of dissatisfied.
In addition to the above tests, the study also aims to examine the effects of alterations to the bathroom ducts, especially the following: the efficiency of a grid with low head loss and the effect of using a static ventilator.
2 Description of the flats and the
ventilation system
Fig. 2 shows a standard apartment and the location of the various ventilation system devices.
Bath (9.2m3 ): Natural exhaust Air inlets (2 30 m3 /h) Air inlets (2 30 m3 /h) Kitchen (23.2m3 ): Mechanical exhaust Bed1: 22.7m3 Bed2: 31.7m3 Living: 56.4m3
Fixed air inlet
2.1 Performance of building envelope
The air permeability of building components and the air permeability of the envelope were both investigated. The air permeability of windows was measured in the laboratory in a test rig complying with EN 1026: 2000 [5]. Windows fitted in the bedrooms and kitchen were similar and test measurements are given in Fig. 3.
Q = 0.1975 p0.8485 0.1 1 10 100 10 100 1000 Pressure [Pa] F lo w r a te [ m 3 /h .m 2 ]
Result Class 1 Class 2 Class 3 Class 4
Fig. 3. Laboratory measurement of air permeability of the bedroom and kitchen windows.
According to EN 12207: 1999 [6], the window air
permeability classification is 2. Aerodynamic
performance of ventilation inlets was assessed in an earlier paper [3] (see Fig. 4).
1,0 10,0 100,0 1,00 10,00 100,00 Pressure (Pa) F low rat e (m 3/ h)
Fig. 4. Laboratory measurement of the air inlet performance.
The ACH at 50 Pa of the flats is about 5.6 h-1 and
according to [7] is in the mid-range of whole building air permeability in Portugal.
2.2 Description of ventilation systems The hybrid system layout is as follows:
- The self regulated inlets (30 m3/h at 20 Pa) are
placed as shown in Fig. 2, fitted above the window;
- Diameter of the bathroom duct in the 1st, 2nd, 3rd
and 5th flats: Φ110 mm (PVC) with insulation
and a static ventilator;
- Diameter of the bathroom duct in the 6th and 7th
flats: Φ125 mm (PVC) with insulation and a static ventilator;
- Mechanical exhaust in the kitchen: diameter duct with Φ150 mm (metal). The schedule is: 12 noon-2.00 pm and 6.30 pm-9.30 pm at
120 m3/h and in the remaining hours at
60 m3/h;
- Water heater appliance duct: diameter duct with Φ175 mm (metal), collective (serving three
kitchens on the same vertical plane), on the 1st
floor and Φ125 mm, individual, on the 4th floor.
The fresh air requirement for the heater is about
4.3 heating power 100 m3/h.
The natural system implemented in the 4th flat (2nd
floor) is as follows:
- The self regulated inlets (30 m3/h at 20 Pa) are
placed according to Fig. 2, fitted above the window;
- Diameter of the bathroom duct: Φ110 mm (PVC) without insulation and the static ventilator; - Natural exhaust in the kitchen: Φ150 mm
(metal);
- Water heater appliance: diameter duct with Φ175 mm (metal), collective (serving three kitchens on the same vertical plane).
3 Field experiments in the summer
Tests were carried out between 2 and 11 August 2005 and the following parameters were obtained for vacant flats:
- Outdoor climatic conditions (wind speed and direction, temperature and relative humidity) found on the roof of the building;
- Ambient temperature and relative humidity in each flat;
- Air flow in the bathroom duct of the 3rd flat in one day;
- Average ACH for each room in all the flats, and the average ACH for the flats;
- Thermal comfort conditions: PMV - Predicted mean vote and PPD - Predicted percentage of dissatisfied.
3.1 Ambient conditions
Fig. 5 gives the outside climatic conditions measured for the period in question.
0 1 2 3 4 5 6 7 8 02-20 02-23 03-02 03-05 03-08 03-11 03-14 03-17 03-20
Hours in the 2nd and 3rd days of August 2005 [dd-hh]
Wi n d s p ee d [ m /s ] 0 60 120 180 240 300 360 Wi n d d ir ec ti o n [ º] Speed Direction
a) Wind: speed and direction between 2 and 3 August.
0 5 10 15 20 N NE E SE SE SW W NW Frequency [%] Average speed [km/h]
b) Wind: frequency of direction and average speed between 2 and 9 August.
15 20 25 30 35 40 45 02-12 03-12 04-12 05-12 06-12 07-12 08-12 09-12 Day in August 2005 [dd-hh] T em pe ra tur e [ ºC ] 10 20 30 40 50 60 70 80 90 100 R el . H um idi ty [ ºC ]] Temp RH
c) Outside temperature and relative humidity between 2 and 9 August.
Fig. 5. Outside climatic conditions.
The outside climatic conditions feature low wind speeds (1.3 m/s to 3.5 m/s), bearing approximately perpendicular to flats 3 to 5, that is, in the NW octant (predominantly in the afternoon and evening) and SE octant (predominantly in the morning) and high temperatures (see Fig. 5).
Fig. 6 shows the temperature and relative humidity measured inside the flats during the period in question. 21 22 23 24 25 26 03-00 03-12 04-00 04-12 05-00 Day in August 2005 [dd-hh] T em pe ra tur e [ °C ] Flat 1 Flat 2 Flat 3 Flat 4 Flat 6 Flat 7
a) Indoor temperature between the 3 and 4 August.
21 22 23 24 25 26 27 1st 2nd 3rd 4th (nat) 6th 7th FLATS T em pe ra tur e [ ºC ] 40 45 50 55 60 R el . h um idi ty [% ]] Temp. RH
b) Average indoor conditions between 2 and 9 August. Fig. 6. Temperature and relative humidity inside the flats.
In relation to the indoor hygrothermal conditions, Fig. 6 shows that, as was expected, the flats with the temperature extremes are those on the ground floor and the top floor, with an average difference of 3ºC (it was not possible to obtain values for flat 5). A slight fall in relative humidity was found in flats 1, 2 and 7, those most exposed to afternoon solar radiation. The temperatures in the rooms of flat 5 are given in Fig. 7, which also shows that the extreme temperatures occur in the rooms with the most and least exposure to solar radiation (kitchen and bathroom).
The indoor surface temperatures in bedroom 1 (facing NW) of flat 5 are given in Fig. 8, where it can be seen that temperature extremes are reached on the surfaces
with the most and least exposure to solar radiation (ceiling and floor).
23.0 23.5 24.0 24.5 25.0 25.5 26.0 03-00 03-03 03-06 03-09 03-12 03-15 03-18 Hour of 3 August 2005 [dd-hh] T em pe ra tur e [ ºC ] Bed1 Bed2 Bath Living Kitchen
Fig. 7. Temperatures of rooms in flat 5 on 5 August.
22.5 23.0 23.5 24.0 24.5 25.0 25.5 03-00 03-03 03-06 03-09 03-12 03-15 03-18 Hour of 3 August 2005 [dd-hh] Te m p e ra tu re [ ºC ]
Outside wall Lef twall
Ceiling Floor
Fig. 8. Indoor surface temperatures in bedroom 1 of flat 5 on 3 August.
It may be concluded that the ambient and surface temperatures follow the outside temperature and can amount to situations of discomfort, which are better assessed in §3.4.
3.2 Determination of the air exchange rates with the PFT technique
The PFT technique is a passive tracer gas technique for ventilation measurement in which perfluorinated hydrocarbons are used as tracers. The tracer gas is continuously infused into the room air at a low and constant rate from miniature containers via built-in capillary tubes (Fig. 9a)). Air sampling is performed using passive diffusive samplers filled with a charcoal sorbent (Fig. 9b)). The amount of tracer trapped in the samplers during the exposure time is analysed using gas chromatography with an electron capture detector. In the homogeneous emission techniques, the tracer gas emission rates from the sources are arranged to yield an equal emission rate per volume unit in the measurement object. The emission rate from a source can be adjusted by a metal wire extending to different depths in the capillary tube.
The local tracer concentration will be proportional to
the “local mean age of air ( p[h])” (see Eq. 1).
) V / s ( t k Mp p (1)
Where (s/V) is the constant tracer gas emission rate
gas collected in adsorption sampling during a time period t [h] and k is the sampling rate for a passive
sampling [m3/h]. This particular technique can
therefore be used to map the air distribution in a building. The inverted value of the local mean age of air can be interpreted as a “local air change rate” (ACHlocal) [8], [9] and [10].
a) b)
Fig. 9. Example of source and sampler capsules, a) capillary tracer gas source, with emission adjustment device, b) passive sampler with charcoal sorbent.
The following is a plan of the flat showing the location of the instruments used (Fig. 10).
1 5 6 4 2 3 Key:
- source capsule - sampler capsule Fig. 10. Plan of the flat showing position of equipment used.
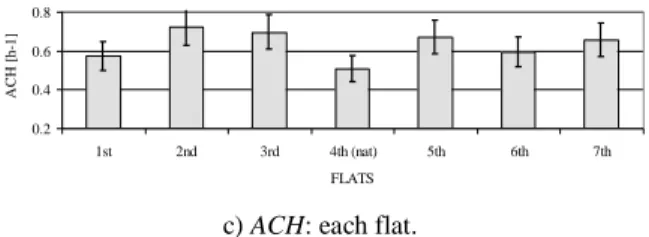
Fig. 11 displays the ACH in the bathrooms, kitchens and for each flat.
0.2 0.4 0.6 0.8 1st 2nd 3rd 4th (nat) 5th 6th 7th FLATS A C H [ h-1] a) ACH: bathrooms. 0.2 0.4 0.6 0.8 1st 2nd 3rd 4th (nat) 5th 6th 7th FLATS A C H [ h-1] b) ACH: kitchens. 0.2 0.4 0.6 0.8 1st 2nd 3rd 4th (nat) 5th 6th 7th FLATS A C H [ h-1]
c) ACH: each flat. Fig. 11. ACHs.
Regarding the ACH obtained, the main conclusions are:
- A static ventilator and the use of low head-loss
grids ( Ptotal-45m3/h = 2 Pa) are significant for
obtaining meaningful increases in ACH
comparing to the bathroom of flat 4, which does not have these devices;
- The use of a Φ125 mm diameter in the bathroom duct in flats 6 and 7 does not increase the extracted flow;
- Despite the mechanical exhaust with low flows
in the kitchen ( 60 m3/h for 19h of the day) the
extraction flows there due to natural ventilation (flat 4) are still lower;
- The action of the wind, increasing ACH, is essentially felt in the flats below the roof; - The overall global ACH for the flats with a
hybrid ventilation system shows a slight variation between 0.57 and 0.72 ACH, with the naturally-ventilated flat (flat 4) registering a value of 0.51 h-1.
3.3 Determination of the temperature and flow in the duct of the bathroom
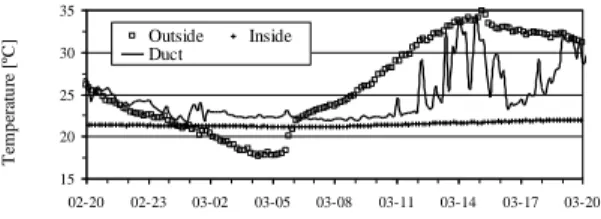
Fig. 12 gives the wind, speed and direction, flow and the temperature in the bathroom of flat 3, recorded on 2 and 3 August.
If we look at Fig. 12a), we may conclude that the increase in flow in the bathroom of flat 3 is directly related to the bearing of the wind approximately perpendicular to the main façade, that is, in the SE octant, ( 7-12h). Outside that period there could be a reversal of the circulation, as shown in Fig. 12b), particularly by the peaks of the temperature inside the duct between 12 noon and 4.00 pm.
In accordance with the Portuguese standards for natural ventilation [1], the average extraction flow
from the bathroom would have to be 45m3/h, whereas
it can be seen in Fig. 12a) that this flow is only achieved occasionally. 0 10 20 30 40 50 60 70 02-20 02-23 03-02 03-05 03-08 03-11 03-14 03-17 03-20
Hour of 2 and 3 August 2005 [dd-hh]
F lo w r a te [ m 3 /h ] 0 2 4 6 W in d s p e e d [ m /s ]] Flow Wind speed
a) Wind speed and flow in the duct of the bathroom of flat 3.
15 20 25 30 35 02-20 02-23 03-02 03-05 03-08 03-11 03-14 03-17 03-20
Hour of 2 and 3 August 2005 [dd-hh]
T em p er at u re [ ºC ] Outside Inside Duct
b) Temperature inside bathroom, outside bathroom and in the duct of flat 3.
Fig. 12. Inside and outside conditions in the bathroom of flat 3.
3.4 Thermal comfort surveys
The ambient thermal conditions of the residential building were assessed in bedroom 1 and the living
room (see Fig. 2) of three flats (2nd, 3rd and 5th), on 10
and 11 August.
All the external sun shading devices (roller shutters) of the three flats analysed were kept in the same position, partially closed (2/3 of the window), to guarantee the same test conditions.
The ambient thermal conditions were analysed by measuring the following objective parameters:
- Air temperature (TA);
- Mean radiant temperature (TMR) or operative
temperature (TOP);
- Relative air humidity (RH); - Air velocity (v).
Two Brüel & Kjær Indoor Climatic Analysers – Type 1213 were used to perform the measurements.
The parameters were measured continuously,
specifically in the centre of the analysed rooms (bedroom 1 and living room), at a height of 0.6 m above the floor (abdomen level), according to the Standard EN ISO 7726: 2001, for seated persons. The measurement period was 1 h in each survey.
The recorded data were processed to evaluate Fanger’s thermal comfort indices, PMV and PPD and the operative temperature, according to International Standards EN ISO 7730: 2005 and ANSI/ASHRAE 55: 2004. In the evaluation of PMV and PPD the metabolic rate was fixed at 1.0 met (seated, relaxed)
and people’s clothing at 0.65 clo1.
Table 1. Results of thermal comfort surveys. Survey Flat Room TOP
(ºC) PMV PPD (%) 1 3rd Liv. 23,7 - 0,4 8 2 5th 24,9 0,0 5 3 3rd Bed1 23,3 - 0,5 10 4 5th 24,7 - 0,1 5 5 2nd Bed1 24,6 - 0,1 5 6 5th 24,1 - 0,3 7 7 2nd Liv. 25,3 + 0,1 5 8 5th 25,0 0,0 5
1
- Typical summer’s value (0.5 clo) plus the contribution of a chair (0.15 clo), EN ISO 7730: 2005.
Four series of two thermal comfort surveys were carried out simultaneously in bedroom 1 and the living room of two of the three apartments studied. The results for the thermal indices are presented in Table 1.
According to EN ISO 7730 and ANSI/ASHRAE, the PMV and PPD indices and operative temperature (Top) presented in Table 1 satisfy the thermal requirements for environments specified for category
B - moderate level of acceptance
(-0.5<PMV< 0.5 and PPD<10 %).
Considering the optional method for determining acceptable thermal conditions in naturally conditioned spaces, presented in ANSI/ASHRAE 55: 2004, the survey’s results given in Table 1 are perfectly acceptable.
It must be noted that if the studied flats were inhabited, then the thermal environmental conditions would certainly be different. Another observation is that, as mentioned above (see §3.1) the indoor thermal conditions are strongly dependent on the external conditions. So if these thermal surveys were carried out, for example, on 5 August (see Fig. 5) the results would have been less acceptable.
The comparison of the results obtained in the 3rd and
5th flats (surveys 1 to 4), respectively situated on the
1st and the 4th floors of the building, showed that the
flat located directly under the roof (5th flat) was
perceptibly hotter.
Relatively to the thermal performance of the 2nd and
5th flats on the 4th floor of the building, with different
orientation, the thermal surveys (surveys 5 to 8) demonstrate that the flats who receive more solar radiation (obviously) achieved higher values.
4 Field experiments in the winter
In the six flats equipped with a hybrid ventilation system, two parallel ducts were installed to ventilate the bathroom. They both had a diameter of Φ110 mm
(or Φ125 mm in the 6th and 7th flat), but one was
modified as follows: exterior polyurethane insulation of approximately 3 cm, reduced head-loss grid and a static ventilator in the roof.
The aim of the tests was thus to compare the performance of the two ducts, i.e. determine the influence of the reduced head-loss grid and the static ventilator. The tests were conducted in December 2005 and the parameters obtained for the vacant flats were as follows:
- Outdoor climatic conditions (wind direction and speed, temperature and relative humidity) obtained on the roof of the building;
- Air speed in the bathroom ducts in the 3rd flat over more or less one day.
Fig. 13 gives the comparison showing the influence of the low head-loss grid and the static ventilator on the extraction flow.
0 10 20 30 40 50 15-14 15-17 15-20 15-23 16-02 16-05 16-08 16-11 16-14 16-17 16-20 16-23
Hour on 15 and 16 December 2005 [dd-hh]
Fl ow r at e [m 3/ h] 0 2 4 6 Wi nd spe ed [m /s] Modified duct Normal duct Wind speed
Wind direction approximately SE
a) Flow in the ducts of flat 3: current situation.
0 10 20 30 40 23-13 23-16 23-19 23-22 24-01 24-04 24-07 24-10 24-13 24-16 24-19 Hour on 23 and 24 December 2005 [dd-hh]
Fl ow r at e [m 3/ h] 0 1 2 3 4 Wi nd spee d [m /s ] Modified duct Normal duct Wind speed
Wind direction approximately N
b) Flow in the ducts of flat 3: no grids and with static ventilator. 4 8 12 16 27-16 27-19 27-22 28-01 28-04 28-07 28-10 28-13 28-16 28-19 28-22
Hour on 27 and 28 December 2005 [dd-hh]
Fl ow r at e [m 3/ h] 0 2 4 Wi nd spee d [m /s ] Modified duct Normal duct Wind speed
Wind direction instable
c) Flow in the ducts of flat 3: with grids and without static ventilator.
Fig. 13. Flow in the ducts of flat 3.
Comparing Figs 13a) and 13b) it can be said that the head loss from the grid could be a crucial obstacle to the extraction flow. Comparing Figs 13a) and 13c) it can be said that the static ventilator can significantly help the extraction flow, especially when the wind speed is above 4 m/s.
5 Main conclusions
The following experimental characterizations about permeability were performed:
- Window (class 2) and inlet air permeability
(30m3/h at 20 Pa) – in laboratory;
- Whole building air permeability of the flats (ACH50 = 5.6h-1).
Under the test, the ambient and surface temperatures follow the outside temperature (vacant flats). PMV and PPD indices and operative temperature (Top) satisfy the thermal requirements - category B.
The average ACH for the flats with a hybrid system can be regarded as reasonable (0.6 to 0.7 ACH), this varies slightly with location in terms of height and the orientation of the flats. But it is always greater than the average ACH for the flat with the natural ventilation system.
The results show the advantage of including a static ventilator and a low head-loss grid in the bathroom duct.
We may conclude that the increase in flow in the bathroom of flat 3 is directly related to the bearing of the wind approximately perpendicular to the main
façade (SE octant). In accordance with the Portuguese standards for natural ventilation, the average extraction flow from the bathroom would have to be
45m3/h, this flow is only achieved occasionally.
Another series of experiments is currently underway to repeat these tests in the winter period, so as to compare the ACH in quite different ambient conditions [11].
Acknowledgements
This research project was carried out with the support of Fundação para a Ciência e Tecnologia (Project POCTI/ECM/45555/2002).
References
[1] IPQ (Portuguese Institute of Quality), NP 1037-1: Ventilation and evacuation of combustion products from places with gas appliances. Part 1: Dwellings. Natural ventilation (in Portuguese), Lisbon, Portugal, 2002.
[2] Pinto, M. and Freitas, V. Characterization of natural ventilation systems in residential buildings in Portugal. The importance of standardization. XXX IAHS Congress, Coimbra, Portugal, 2002.
[3] Viegas, João et al. Ventilation of dwellings: requirements and experiments. XXX IAHS Congress, Coimbra, Portugal, 2002.
[4] Viegas, J.; Matias, L. and Pinto, A. Natural ventilation of an apartment: a case study. 9th Roomvent Conference, Coimbra, Portugal, 2004. [5] CEN, Windows and doors. Air permeability. Test method, EN 1026, European Committee for Standardization, Brussels, Belgium, 2000.
[6] CEN, Windows and doors. Air permeability. Classification, EN 12 207, European Committee for Standardization, Brussels, Belgium, 2000.
[7] Pinto, A. Criteria do define limits for building
airtightness. Airtightness of some Portuguese
dwellings. 26th AIVC Conference, Brussels, Belgium,
2005.
[8] Stymne, H. and Boman, C. Measurement of
ventilation and air distribution using the
homogeneous emission technique. A validation. 4th
Healthy Buildings Conference, Budapest, Hungary, 1994.
[9] NORDTEST, Ventilation. Local mean age of air. Homogeneous emission techniques, NT VVS 118, Organization for Testing in the Nordic Countries, Espoo, Finland, 1997.
[10] Stymne, H.; Emenius, G., and Boman, C., Comparison of natural and mechanical ventilation
performance in similar houses, 6th Roomvent
Conference, Stockholm, Sweden, 1998.
[11] Pinto; M.; Freitas, V. and Viegas, J. Experimental characterization of hybrid ventilation
systems in residential buildings, 26th AIVC