Open Agriculture. 2019; 4: 475-486
Research Article
Raquel P. F. Guiné*, Luísa Fontes, Maria João Lima
Evaluation of texture in Serra da Estrela cheese
manufactured in different dairies
https://doi.org/10.1515/opag-2019-0048 received March 17, 2019; accepted June 11, 2019
Abstract: Serra da Estrela cheese is a traditional product
from artisanal manufacture using raw ewe’s milk coag-ulated with dried, wild thistle flower. The present study aimed to investigate the variation of textural properties in Serra da Estrela cheeses manufactured in different dairies through time, namely from April to June, following the end of the cheese making season. Three types of tests were conducted: compression, puncture and spreadability. These were carried out on samples coming from six differ-ent dairies situated in the PDO (Protected Designation of Origin) region of this type of cheese.
The results obtained showed some non-negligible differ-ences for some textural properties between the top and bottom sides of the cheeses evaluated, as well as between cheeses from different dairies. Nevertheless, the proper-ties of springiness, resilience, cohesiveness and adhesive-ness (all from the compression test), were not significantly different in the samples analysed. In what concerns the variations along the milking season, it was possible to conclude that three of the considered dairies produced cheeses with a more constant textural profile in the period comprised between April and June. Furthermore, statis-tical analysis revealed that the correlations between the textural properties were strong for some interactions between properties form the same test and/or from similar nature.
Keywords: Cheese quality; Compression test; Puncture
test; Spreadability.
1 Introduction
Cheese is a dairy product obtained from milk fermenta-tion, and is one of the ancient foods still important in the Mediterranean diet. Cheese is usually well tolerated and easily digested and can also constitute a good alternative to milk for people who are intolerant to lactose. Cheese is a nutritive food that contains a high concentration of essen-tial nutrients, such as proteins, bioactive peptides, fat, fatty acids (FA), vitamins and minerals (Ferrão and Guiné 2019). Among the constituents in cheese, it is highlighted the content in dietary calcium, with approximately 35 g of hard cheese providing 250 mg of Ca. Furthermore, in normal dietary conditions, the bioavailability of calcium is higher in milk and dairy products, such as cheese, when compared to other foods, such as vegetables or cereals (Caroli et al. 2011; Chen et al. 2016; Hinrichs 2004; Keller et al. 2002; Rozenberg et al. 2016; Weaver et al. 1999). Nevertheless, some cheeses have a high content of satu-rated fatty acids, and in that case the consumption, must be moderated owing to their contribution for increasing low-density lipoprotein (LDL) cholesterol, which has been associated with cardiovascular diseases (Guiné and Flo-rença 2019; Mihaylova et al. 2012).
Serra da Estrela cheese is a traditional product from artisanal manufacture using raw ewe’s milk coagulated by an aqueous extract obtained from dried thistle flower (Cynara cardunculus). The milk to manufacture Serra da Estrela Cheese is obtained from sheep of Bordaleira da Serra da Estrela or Churra Mondegueira breeds. It is a cured cheese, which can have semi-soft buttery paste and yel-lowish-white colour in case of the Serra da Estrela Cheese, or semi-hard to extra-hard paste of brown-orange colour in the case of Serra da Estrela Old Cheese. The manufac-ture processing depends on the availability of ovine milk, which is seasonal coinciding with the months when sheep
*Corresponding author: Raquel P. F. Guiné, CI&DET and CERNAS
Research Centres, Polytechnic Institute of Viseu, 3504-510 Viseu, Portugal.
Department of Food Industry, Agrarian School of Viseu, IPV, 3500/606 Viseu, Portugal.
Escola Superior Agrária de Viseu, Quinta da Alagoa, Estrada de Nelas, Ranhados, 3500-606 Viseu, Portugal. Tel: + 351 232 446 600; Fax: +351 232 426 536, E-mail: [email protected]
Luísa Fontes, Maria João Lima, Department of Food Industry,
Agrari-an School of Viseu, IPV, 3500/606 Viseu, Portugal
Maria João Lima, CI&DET and CERNAS Research Centres, Polytechnic
give birth and feed their offspring. This is usually com-prised between autumn and spring, more precisely from December to May, and therefore it is believed that many factors influence milk composition, such as: climatic con-ditions and soil composition that influence the pastures, the nutritional and physiological status of the flock, or lactation stage. In this way, it is expected some variation in the physicochemical and microbiological composition of milk than in turn will reflect on the final characteristics of the cheese (Guiné et al. 2019; Tavaria et al. 2003).
Traditional cheeses are characterised by strong links to their territory of origin and constitute a tribute to the history and the culture of the community that manufac-tures them. Due to the importance of this product for the Portuguese food market, some studies have been devel-oped to better understand the effects of manufacturing operations and ripening conditions of the final quality of the cheese; however focus mainly the chemical, biological or biochemical changes, and less on the physical proper-ties (Guiné and Florença 2019). For example, Tavaria et al. (2003) studied the changes occurring in the amino acids and soluble nitrogen throughout ripening and Reis and Malcata (2011) evaluated the microstructure of Serra da Estrela Cheeses along the ripening process. Also the study by Tavaria et al. (2006) focused on the microbiological and microstructural characteristics of Serra da Estrela cheese, but only for fully ripe cheese evaluating the influence of factors like dairy and milk refrigeration. Cunha et al. (2016) undertook a different kind of study, investigating markers to detect the adulteration of this traditional food, owing the PDO (Protected Designation of Origin), with a high commercial value.
Although some studies have been previously con-ducted to investigate the many aspects related to the quality of this traditional product, the textural properties have not yet been fully addressed. The aim of the present work was to investigate the variation of textural proper-ties in Serra da Estrela cheeses manufactured in different dairies from April to June, following the end of the cheese making season. For this, different texture measurements were performed for a more complete evaluation of the tex-tural characteristics.
2 Materials and methods
2.1 Samples
The samples used for the study were triplicates obtained from six dairies situated in PDO region for Serra da Estrela
cheese: Sabores & Ambientes in Oliveira do Hospital (D1), Casa Agrícola dos Arais in Celorico da Beira (D2), Casa da Ínsua in Penalva do Castelo (D3), Queijaria de Germil again in Penalva do Castelo (D4), Quinta de São Cosme in Gouveia (D5) and Quinta da Lagoa in Nelas (D6).
The milk used for the Serra da Estrela cheese came from manual milking and was filtered through a white cloth. To the milk heated at about 30°C was added salt and vegetable rennet (dried wild thistle flower). After 45 to 60 min, the curd was manually cut and filtered to remove the remaining whey. Then, followed the steps of moulding, pressing and salting of the surface, and finally the cheese was ready for maturation, being turned and washed every day for the first 15 days and then more sporadically until the end of the ripening process, which lasted about 45 days.
2.2 Analysis of texture
To analyse the textural characteristics, three types of tests were carried out using a Texture Analyser (model TA.XT. Plus, Stable Micro Systems): (a) compression test, (b) puncture test and (c) spreadability test.
2.2.1 Compression test
The texture profile analysis (TPA) for all samples was made using a texturometer (TA.XT. Plus from Stable Micro Systems). The test consisted in two consecutive compres-sion cycles between parallel plates, with a 5 s interval, using a flat 75 mm diameter probe (P/75) and a 50 kg force load cell. The pre-test, test and post-test speed was 1.0 mm/s, in all cases, and the compression distance was 4 mm. The textural properties: hardness, adhesiveness, springiness, cohesiveness, resilience and chewiness were calculated using equations (1) to (6) (Figure 1):
Hardness (N) = F1 (1) Adhesiveness (N.s) = A3 (2) Springiness (%) = T2/T1*100 (3) Cohesiveness = A2/A1 (4) Resilience (%) = A5/A4*100 (5)
Texture of Serra da Estrela cheese 477
Chewiness (N) = F1*T2/T1*A2/A1 (6) For this test the evaluations were made in three different samples in both sides of the cheese (top and bottom), allowing to calculate the mean value and standard devi-ation.
2.2.2 Puncture test
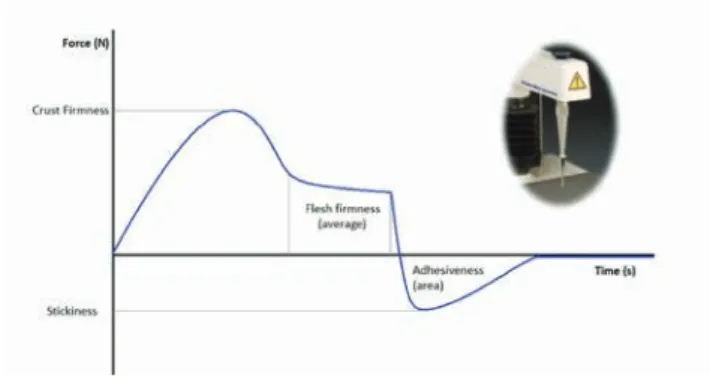
In this case the test performed was measure force in com-pression and the probe used was P/2 (2mm diameter cyl-inder). The operational parameters were: pre-test speed = 2.00 mm/s, test speed = 1.00 mm/s and post-test speed = 1.00 mm/s, distance = 10.0 mm and load cell = 50 kg. The curve force (N) versus time (s) (Figure 2) allowed calculat-ing the crust firmness, the inner firmness, adhesiveness and stickiness, according to equations (7) to (10):
Crust firmness (N) = Fe (maximum force) (7) Inner firmness (N) = Fi
(average force between lines 1 and 2) (8) Adhesiveness (N.s) = A (negative area – marked green)
(9) Stickiness (N) = Fn (minimum force – negative) (10) For this test the evaluations were made in 3 different samples in both sides of the cheese (top and bottom), with five perforations on each side.
Spreadability test
In this case the test also involved measure force in com-pression, but using a spherical probe P/1S (stainless ball). The operational parameters were: pre-test speed = 1.50 mm/s, test speed = 2.00 mm/s and post-test speed = 10.00
mm/s, distance = 10.0 mm and load cell = 50 kg. The curve force (N) versus time (s) (Figure 3) allowed calculating hardness and stickiness, according to equations (11) and (12):
Hardness (N) = Fe (maximum force) (11) Stickiness (N) = Fn (minimum force – negative) (12)
For this test the evaluations were made in three different samples in both sides of the cheese (top and bottom).
2.3 Statistical analysis
To verify if the results obtained in terms of mean value were statistically different between samples, a statistical analysis was applied. The Post-Hoc Tukey HSD (Honestly Significant Difference) test was used, coupled to an anal-ysis of variance (ANOVA) for comparison between the samples from different dairies. Tukey’s test is a statistical tool to identify the differences between groups of data and consists of a single multi-step process for comparison,
Figure 1: Example of a graph obtained with the compression test
using the P/75 probe Figure 2: Example of a graph obtained with the puncture test using the P/2 probe
Figure 3: Example of a graph obtained with the spreadability test
carried out in conjunction with ANOVA. The test identifies where the difference between two mean values is higher than the standard error which could be expected.
Also, the Pearson correlation coefficients were used to analyse the possible associations and interdependence between properties. For absolute value of r = 0 there is no correlation, for r ∈ ]0.0, 0.2[ the correlation is very weak,
for r ∈ [0.2, 0.4[ the correlation is weak, for r ∈ [0.4, 0.6[ the
correlation is moderate, for r ∈ [0.6, 0.8[ the correlation is
strong, for r ∈ [0.8, 1.0[ the correlation is very strong, for
r = 1 the correlation is perfect (Maroco 2012; Pestana and Gageiro 2014).
Complementary, a factor analysis (FA) was under-taken. The correlation matrix between the variables was analysed to identify some correlations. The Kaiser-Mey-er-Olkin measure of adequacy of the sample (KMO) and the Bartlett’s test were used to verify the intercorrelation between variables (Broen et al. 2015). After confirming that the data were suitable for application of factor anal-ysis, this was applied considering extraction by principal component analysis (PCA) and Varimax rotation with Kaiser Normalization. The number of components was established by the Kaiser criterion (eigenvalues ≥ 1). In all cases, the communalities were calculated to show the percentage of variance explained by the factors extracted (Broen et al. 2015). Factor loadings with an absolute value exceeding 0.4 were used, because this lower limit accounts for about 16% of the variance in the variable (Rohm and Swaminathan 2004; Stevens 2009).
For all statistical analyses was used the software SPSS version 25 (IBM, Inc.) and the level of significance consid-ered was 5% (P < 0.05).
Ethical approval: The conducted research is not related to either human or animal use.
3 Results and discussion
3.1 Textural properties
Table 1 shows the textural properties on both sides of the cheeses (top and bottom) in the first moment of evaluation (month of April), obtained by the three different tests per-formed. For these cheeses the milk used would have been collected at around February, having in mind the 45 days of maturation. The compression tests allowed to measure six different textural properties: hardness, chewiness, springiness, resilience, adhesiveness and cohesion. Hard-ness corresponds to the force required to compress a food between the teeth or between the tongue and mouth, i.e.,
the force required to produce deformation. Adhesiveness comprises the force required to remove the material that adheres to a surface, for example the lips, palate or teeth. Springiness is linked to the ability to recover shape after deformation by compression, corresponding to the rate at which the product returns to the initial point after removal of the force. Resilience is the energy involved when a force is applied to a material without occurring rupture, with or without any residual strain, and is like an instant springi-ness. Cohesiveness, or cohesion, represents the internal forces on the food that impede the sample disintegration. Finally, chewiness measures the energy required to disin-tegrate the food to a state appropriate for swallowing.
The results in Table 1 (compression test) show that there are some differences between both faces of the cheeses, most especially for some dairies. Although during the ripening process it is supposed to turn the cheeses very frequently to provide the development of uniform characteristics, in reality that may not be so effective for some cases, maybe because the turns were not so fre-quent as expected or even due to other fortuitous causes. For example, hardness was very uniform for samples D1 and D5 but not for samples D4 or D6. Chewiness, which is directly linked with hardness (see Equation (6)), presents for that reason a very similar trend to that observed for hardness. Adhesiveness was found practically non-ex-istent, which is an indicator of the dryness of the cheese crust, since these measurements by the compression test were made in the outer part of the cheese. Also in a study by Guiné et al. (2015) made with goat and sheep cheeses, the values of adhesiveness measured in the crust were very close to zero. The other properties, springiness, resil-ience and cohesiveness, were very similar on both sides of the cheeses analysed, and the values were also similar between different dairies.
The puncture tests allowed calculating four additional textural properties, the crust and inner firmness, adhe-siveness and stickiness. However, unlike in the compres-sion tests that were made to the outer part of the cheese, the crust, the puncture tests actually penetrated inside the inner paste and allowed measuring additional prop-erties, important because they are more directly linked with the sensory perception of texture for this smooth cheese. The firmness of the outer layer and of the inner paste have a similar meaning to that of the hardness, previously described when discussing the results of the compression test. Adhesiveness has also been explained before, but stickiness is a new concept, that corresponds to the minimal force of the probe when receding from the sample.
Texture of Serra da Estrela cheese 479
The results in Table 1 (puncture test) reveal that the firmness of the crust was considerably harder when com-pared with that of the inner paste, and in this case the var-iability between sides was more evident for all samples, when it comes to the hardness of the crust. Regarding the inner paste, the differences between sides were consid-erably lower, which means that inside there is a higher uniformity of texture. The adhesiveness was higher when compared with that measured with the compression test, because the puncture test penetrates inside the cheese contacting with the paste that is smoother and creamier.
Because this product is expected to have a soft texture with a creamy feeling in the mouth, higher intensity of adhe-siveness (i.e. lower negative values) are preferable, like in the case of samples D6 and D3. The stickiness is much linked also with adhesiveness and therefore also higher stickiness is appreciated, like in the cases of samples D6 and D3.
In the work by Correia et al. (2014), texture was meas-ured for Serra da Estrela Cheese also through puncture test, but varying the thistle flower ecotypes. In their work they also found intensive adhesiveness (values around -5
Table 1: Textural properties on top and bottom faces of the cheeses in April (the first moment of evaluation), obtained by the different tests
Property1 Side D1 D2 D33 D4 D5 D6
Compression test
Hardness (N) Top 21.06±4.07a 17.79±4.16a 64.52±n.a. 35.10±14.32ab 12.39±7.13a 71.63±27.81b Bottom 20.34±3.92a 24.46±3.83a 80.61±n.a. 58.96±30.03a 12.47±4.92ab 101.46±16.80c Chewiness (N) Top 14.10±1.25a 12.15±3.36a 44.15±n.a. 25.07±12.33ab 8.29±4.43a 56.68±22.61b
Bottom 13.99±2.80a 15.51±2.34a 58.09±n.a. 40.11±24.20ab 8.08±3.36a 80.66±14.00b Adhesiveness (N.s) Top -0.07±0.08a -0.02±0.00a -0.02±n.a. 0.00±0.00a 0.00±0.00a 0.00±0.01a
Bottom -0.85±1.12a -1.01±0.52a -0.60±n.a. -0.01±0.01a -0.45±0.03a -0.03±0.01a Springiness (%) Top 84.38±3.71a 83.88±1.77a 85.88±n.a. 84.13±3.81a 84.00±2.21a 89.69±1.33a
Bottom 85.38±0.71a 84.06±0.62a 87.50±n.a. 82.58±4.82a 83.46±1.28a 89.88±0.35a Resilience (%) Top 38.35±5.55a 39.95±1.92a 43.71±n.a. 41.12±5.36a 41.13±2.38a 55.70±0.79b Bottom 39.19±4.27a 36.73±1.00a 45.24±n.a. 43.57±2.80a 45.14±6.24a 59.10±0.61b Cohesiveness Top 0.80±0.05a 0.81±0.02a 0.80±n.a. 0.83±0.04a 0.80±0.03a 0.88±0.00a
Bottom 0.81±0.00a 0.76±0.00a 0.82±n.a. 0.80±0.04a 0.77±0.02a 0.88±0.00b Puncture test
Crust Firmness (N) Top 2.38±1.23a 2.90±0.54a 6.15±0.73b 6.54±2.34b 3.78±0.71a 10.67±2.87c Bottom 1.23±0.37a 1.30±0.42a 3.28±0.55b 3.81±0.85b 2.76±0.85b 7.15±1.34c Paste Firmness (N) Top 0.87±0.34a 1.11±0.09a 1.88±0.24b 2.37±0.82b 0.96±0.20a 3.21±0.60c Bottom 0.74±0.25a 0.85±0.16ab 1.22±0.06bc 1.37±0.23c 1.03±0.39abc 2.36±0.51d Stickiness (N) Top -0.67±0.31d -0.76±0.16d -2.20±0.23b -1.78±0.57bc -0.94±0.16cd -3.44±1.25a Bottom -0.47±0.13d -0.51±0.08d -0.97±0.09bc -1.10±0.33b -0.67±0.18cd -2.11±0.59a Adhesiveness (N.s) Top -4.30±2.15c -4.82±1.05c -14.49±2.43b -12.43±4.38b -6.13±1.11c -25.85±11.08a Bottom -2.89±0.80c -2.74±0.57c -5.43±0.81bc -7.35±2.67b -4.22±1.31bc -16.05±4.76a Spreadability test
Hardness (N) Top 10.54±6.11a 11.09±3.39a 22.69±n.a. 17.71±2.66a 11.06±1.73a 36.76±2.68b Bottom 6.76±2.09a 9.45±3.17a 27.89±n.a. 16.29±4.88a 10.36±0.97a 33.82±8.49b Stickiness N) Top -0.13±0.07a -0.11±0.01a -0.49±n.a. -0.09±0.06a -0.04±0.01a -0.14±0.15a
Bottom -0.15±0.07a -0.20±0.00a -1.03±n.a. -0.15±0.10a -0.09±0.09a -0.17±0.07a 1Values given as mean ± standard deviation. Values in the same line with the same superscript are not significantly different (ANOVA with Tukey Post Hoc, P < 0.05).
2For this evaluation only one cheese was successfully analysed, and therefore for some measurements it was not possible to compute stand-ard deviation (n.a.) and Tukey’s test was also not possible to perform for those cases.
to -7 N.s) and stickiness (approximately -1 N) and a crust firmness higher when compared to the inner firmness (approximately 3 and 1 N, respectively). Also Correia et al. (2016) reported similar trends for Serra da Estrela Cheese along maturation time, with values of the textural proper-ties being at 90 days of maturation 2.4 – 5.6 and 0.8 – 1.8 N for crust and inner firmness, respectively, while being -1.6 – -0.5 N for stickiness and -11.3 – -3.0 N.s for adhesiveness. The spreadability tests allowed calculating also hard-ness and stickihard-ness, although in a different way than pre-vious tests, being these differences associated with the usage of a spherical probe. The results presented in Table 1 for the spreadability show once more that the hardness of the crust can be quite different when evaluated in differ-ent sides of the cheeses, like for example sample D1. Stick-iness as measured in the outer crust was low, presenting a similar trend to that observed for the adhesiveness also measured on the outer part of the cheeses.
In Table 2 shows the results obtained for the same properties of Table 1, but evaluated in the last month
(June) of the evaluation interval considered. In general, the trends are similar, either when comparing both sides of the samples or when comparing the different dairies. Also, in this case springiness, resilience and cohesive-ness were very similar in all measurements, while hard-ness and chewihard-ness varied a little between sides (for example D2 and D5) and between dairies (from D1 to D2, for example). Regarding the properties of the puncture test, crust firmness was more variable between sides for samples D3 and D6, while inner firmness was very similar in both evaluations made for sample D3, thus evidenc-ing that while beevidenc-ing uniform in the inner paste, the crust presented important changes in texture for both sides. Adhesiveness, on the other hand, was highly variable for sample D3, with the value in the bottom (-14.25 N.s) almost doubling that of the top (-7.22 N.s). Regarding the results for stickiness, a higher constancy was observed for differ-ent samples and differdiffer-ent sides.
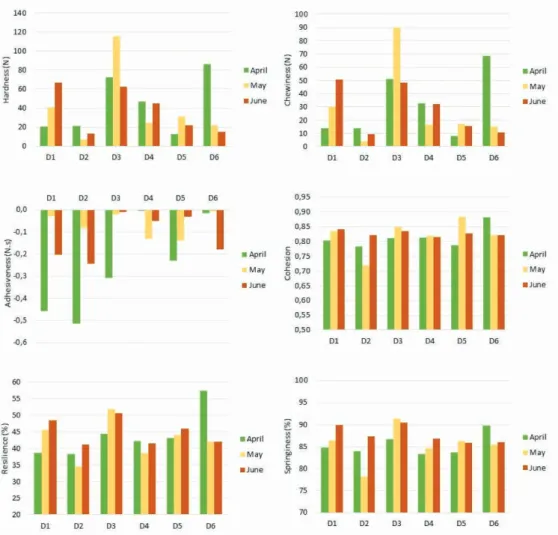
Figures 4 to 6 show the evolution of the textural prop-erties of the cheeses produced in the 6 dairies along the
Texture of Serra da Estrela cheese 481
period considered in the milking season, but calculated as means values from the measurements made on both sides of the cheeses. The results of the compression test (Figure 4) indicate that, while for some dairies the properties kept more constant along the evaluation period considered, for others a high variability was observed. Regarding commer-cialization, it is important that dairies are able to provide products that minimize the variability in the organoleptic characteristics and in overall quality, to please and satisfy the consumers’ expectations. While for dairies D2, D4 and D5 the soft characteristics (evaluated trough hardness and chewiness) remained just slightly unchanged over time, for dairies D1, D3 and D6 these properties were highly var-iable. The cheeses from dairy D1 showed a tendency to get
harder along time, while for dairy D6 an opposite trend was observed, and for D3 the values obtained in May were completely out of the trend observed for April and June, when the values were very similar. Regarding adhesive-ness, the values were all very small, with a maximum of about 0.5 N.s (absolute value), and therefore any varia-tions seen in the graph do not have any true expression in the definition of the cheeses textural characteristics. For the textural properties resilience, springiness and cohe-sion, the most visible changes along time occur for dairies D2 and D6.
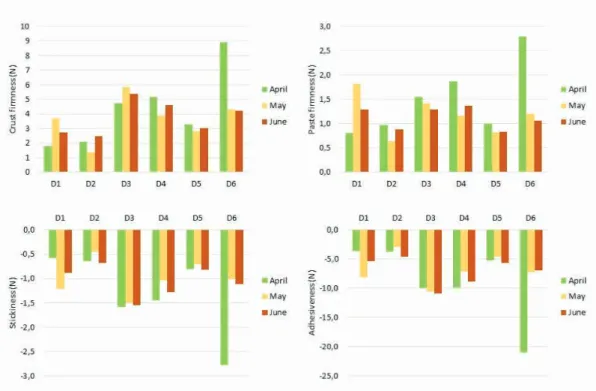
The results in Figure 5 (puncture test) indicate that the dairies who produced cheeses with a more uniform firmness were those who also had uniform hardness in
Table 2: Textural properties on top and bottom faces of the cheeses in June (the last moment of evaluation), obtained by the different tests
Property1 Side D1 D2 D3 D4 D5 D6 Compression test Hardness (N) Top 66.95±12.87b 9.97±3.85a 65.43±30.79b 43.78±12.88ab 16.14±7.09a 12.19±1.69a Bottom 66.92±12.05b 15.80±5.80a 59.28±28.62ab 46.71±24.81ab 27.72±0.83ab 18.02±9.01a Chewiness (N) Top 49.74±9.55b 7.32±3.10a 52.19±26.74b 31.78±9.78ab 11.64±5.21a 8.70±0.84a Bottom 51.81±10.64b 11.28±4.26a 44.27±22.49ab 32.53±18.9ab 19.52±1.67ab 12.70±6.53a Adhesiveness (N.s) Top -0.16±0.22a -0.01±0.01a -0.01±0.01a -0.05±0.06a -0.01±0.00a -0.03±0.03a Bottom -0.24±0.35a -0.47±0.40a -0.01±0.00a -0.05±0.04a -0.06±0.05a -0.33±0.31a Springiness (%) Top 89.50±0.82a 87.46±2.91a 92.03±3.47a 88.04±1.83a 86.13±3.43a 86.54±2.10a Bottom 90.46±1.68a 87.21±1.05a 88.94±2.24a 85.06±1.68a 85.58±3.76a 85.58±3.59a Resilience (%) Top 47.72±2.63a 41.93±1.34a 51.30±5.25a 43.24±7.19a 45.10±5.24a 42.43±1.95a Bottom 49.27±4.63a 40.39±1.64a 49.86±4.73a 38.94±4.53a 46.99±3.83a 41.91±5.49a Cohesiveness Top 0.83±0.01a 0.83±0.03a 0.85±0.04a 0.82±0.04a 0.83±0.04a 0.83±0.03a Bottom 0.85±0.01a 0.82±0.02a 0.83±0.03a 0.81±0.03a 0.82±0.04a 0.81±0.02a Puncture test
Crust Firmness (N) Top 2.83±0.61a 3.68±0.44a 4.55±0.70abc 4.94±2.52b 3.60±0.38a 5.77±3.04a Bottom 2.63±0.54a 1.27±0.64a 6.14±1.95c 4.24±1.82b 2.46±1.34a 2.64±0.30a Paste Firmness (N) Top 1.31±0.25ab 1.10±0.17ab 1.39±0.22ab 1.47±0.64b 1.00±0.20a 1.31±0.71ab
Bottom 1.28±0.33c 0.67±0.25a 1.20±0.44bc 1.25±0.72bc 0.67±0.35a 0.82±0.29ab Adhesiveness (N.s) Top -5.24±1.18b -6.36±1.46ab -7.22±2.71ab -10.20±6.69a -7.08±2.15ab -9.69±5.59a Bottom -5.36±1.54bc -2.73±1.10c -14.25±7.77a -7.42±4.77b -4.15±3.52bc -4.08±1.10bc Stickiness N) Top -0.88±0.16b -0.91±0.18b -1.19±0.27ab -1.53±0.92a -1.01±0.25ab -1.56±0.91a Bottom -0.88±0.21bc -0.45±0.16c -1.87±0.95a -1.03±0.62b -0.62±0.47bc -0.66±0.11bc Spreadability test Hardness (N) Top 26.67±4.81c 6.39±1.96a 17.58±2.47bc 14.50±7.07ab 10.91±1.83ab 7.15±2.51a Bottom 27.43±6.25b 4.56±2.14a 17.06±4.95ab 17.44±9.03ab 11.55±4.2a 6.55±2.00a Stickiness N) Top -0.17±0.05a -0.23±0.14a -0.05±0.03a -0.12±0.08a -0.17±0.13a -0.11±0.05a Bottom -0.20±0.08a -0.19±0.06a -0.04±0.04b -0.05±0.02b -0.14±0.02ab -0.16±0.05ab 1Values given as mean ± standard deviation. Values in the same line with the same superscript are not significantly different (ANOVA with Tukey Post Hoc, P < 0.05).
the compression test, D2, D4 and D5, but in this case the samples D3 showed a uniformity of the textural properties evaluated by the puncture test, contrarily to the variabil-ity observed in the textural properties of the compression test. This indicates that samples D3 might present higher differences along time when it comes to the outer crust but inside the characteristics remain quite unchangeable along time, being these the most relevant for consumers, who primarily consume the inner paste. Nevertheless, the outer crust is also edible, and some people consume both the inner and outer parts of the Serra da Estrela Cheese, although valuing more the soft paste inside. Regarding stickiness and adhesiveness, samples from dairies D2, D3, D4 and D5 showed a residual variability along time, with
D1 and D6 presenting the highest variations, most particu-larly in April for the cheese from dairy D6.
The results of the spreadability test (Figure 6) showed important differences along time for dairies D1, D3 and D6 when it comes to hardness but only for dairy D6 in terms of stickiness. These results obtained for hardness are is accordance with those of the compression test previously discussed.
4 Correlations
Pearson correlations between all the variables studied are presented in Table 3, corresponding to the textural
proper-Figure 5: Variation of textural properties in the cheeses as a whole from April to June, obtained by the puncture test
Texture of Serra da Estrela cheese 483
ties obtained with the different tests. Generally, the prop-erties from the puncture test did not correlate much with those from the compression or spreadability tests, which is expected given the highly different natures of each test: some corresponding to measurements on the surface (compression and spreadability) and the other comprising penetration inside the sample. Conversely, for the com-pression test alone, there are important correlations, as for example between chewiness and hardness (r = 0.997) which is a very strong correlation or between hardness and resilience (r = 0.733), hardness and springiness (r = 0.605), resilience and springiness (r = 0.721), chewiness and resil-ience (r = 0.759), springiness and cohesiveness (r = 0.716) and finally chewiness and springiness (r = 0.631), being all these considered strong correlations (values between 0.6 and 0.8). In the first case the very strong correlation found was expected, given that chewiness is directly related to hardness as demonstrated by Equation (6).
Analysing the correlations for the puncture test (Table 3), three correlations were found very strong: stickiness versus crust firmness (r = -0.916), adhesiveness versus crust firmness (r = -0.903) and adhesiveness versus stick-iness (r = 0.987), being some of them with negative sign indicating that crust firmness is higher for lower values of stickiness and adhesiveness. This is expected, since softer cheeses tend to have a smoother paste. Besides these, all the other correlations for the puncture textural
prop-erties between themselves were strong: inner firmness versus crust firmness (r = 0.790), inner firmness versus stickiness (r = -0.790) and inner firmness versus adhesive-ness (-0.744). Again, in some of these cases the correla-tions were negative, which means that the variables are inversely correlated, i.e., by increasing one variable the other decreases accordingly.
Finally, the values of r found for the properties of the spreadability test (Table 3), revealed only two very strong correlations and these were between hardness of the spread and compression tests (r = 0.814) and between hardness of the spread test and chewiness (r = 0.817). Again, these results were not surprising, having in consid-eration that these two tests measure hardness by compres-sion on the surface and that chewiness is so much related to hardness as previously stated. Another two correlations were strong: hardness (spread) versus resilience (r = 0.692) and versus internal firmness (r = 0.621).
5 Factor analysis
The analysis of the correlation matrix revealed some cor-relations between the variables, with 26 values higher than 0.4, being the highest value very close to 1 (0.997), which reflects some important correlations between the variables, thus allowing the application of FA. The value
Table 3: Pearson correlations between the textural properties
Property1 Compression Puncture Spread
HAR ADH RES COH SPR CHE CRFIR INFIR STI ADHP HARS STIS
Compr es sion HAR 1 ADH 0.085 1 RES 0.733** 0.204 1 COH 0.497** 0.144 0.586** 1 SPR 0.605** 0.001 0.721** 0.716** 1 CHE 0.997** 0.083 0.759** 0.425** 0.631** 1 Pun ctur e CRFIR 0.329** 0.335** 0.383** 0.362** 0.303** 0.346** 1 INFIR 0.392** 0.252* 0.376** 0.319** 0.288** 0.406** 0.790** 1 STI -0.380** -0.290** -0.424** -0.366** -0.337** -0.399** -0.916** -0.790** 1 ADHP -0.343** -0.286** -0.399** -0.369** -0.299** -0.363** -0.903** -0.744** 0.987** 1 Spr ead HARS 0.814** 0.151 0.692** 0.355** 0.502** 0.817** 0.545** 0.621** -0.573** -0.543** 1 STIS -0.103 0.328** 0.047 0.026 -0.012 -0.095 0.153 -0.005 -0.058 -0.062 -0.121 1
1HAR = Hardness, ADH = Adhesiveness, RES = Resilience, COH = Cohesiveness, SPR = Springiness, CHE = Chewiness, CRFIR = Crust firm-ness, INFIR = Inner Firmfirm-ness, STI = Stickifirm-ness, ADHP = Adhesiveness (puncture), HARS = Hardness (spreadability), STIS = adhesiveness (Spreadability).
of KMO was good (0.80) according to the classification of Kaiser and Rice (Kaiser and Rice 1974), and furthermore the results of the Bartlett’s test indicated adequacy for applying FA (P-value was significant; P < 0.0005), thus leading to the rejection of the null hypothesis that the correlation matrix was equal to the identity matrix. By analysing the anti-image matrix, it was found that prac-tically all values of MSA (Measure of Sampling Adequacy) were over 0.5, denoting that, in general, the variables were proper for inclusion in the analysis (Values of MSA for the variables: HAR = 0.734, ADH = 0.705, RES = 0.906, SPR = 0.7536, CHE = 0.743, COH = 0.732, CRFIR = 0.920, INFIR = 0.812, ADHP = 0.724, STI = 0.717, HARS = 0.911), just with exception of stickiness from the spreadability test, whose value was lower than 0.5 (STIS = 0.323). For this reason, the mentioned variable was not included in the following analysis which consisted in the rotation of FA with PCA, thus giving two components, based on the Keiser crite-rion to consider eigenvalues greater than 1. This solution explained 97.2% of total variance, distributed by the two factors like this: F1 – 92.4%, F2 – 4.8%.
The communalities for the extracted variables were: HAR = 0.999, ADH = 0.101, RES = 0.627, SPR = 0.413, CHE = 0.998, COH = 0.355, CRFIR = 0.658, INFIR = 0.583, ADHES = 0.720, STI = 0.722, HARS = 0.886). The analysis of the com-munalities revealed that the variables hardness and chew-iness (compression test) had the largest fraction of vari-ance explained by the solution, corresponding to 99.9% and 99.8%, respectively, followed by hardness from the spreadability test (88.6%). Nevertheless, there were some variables with communalities lower than 0.4, adhesive-ness and cohesiveadhesive-ness, both from the compression test.
The rotation converged in three iterations and extracted two factors, as previously mentioned, which grouped the variables as shown in Table 4. The second factor was clearly linked to textural properties that were determined by the puncture test, differentiating from the properties determined by the other two tests, and that were grouped into factor 1. This is in accordance with the nature of the tests, since puncture involved the penetra-tion inside the sample, while the other two tests are per-formed on the external surface.
The loading of the variables in factor 2 were very high (absolute values), being the lowest equal to 0.702, which reveals that all variables contributed importantly for the definition of this factor. On the other hand, for the prop-erties of the compression test different degrees of impor-tance were found, with variables hardness, chewiness and resilience contributing more strongly for the factor when compared with springiness or cohesiveness. Finally, hard-ness from the spreadability test also loaded into factor 1,
with a high value (0.764), following what happened with hardness from compression test. The variable adhesive-ness-compression did not show a representative loading in any of the factors considered (load under 0.4).
6 Conclusion
This investigation confirmed the interest in performing more than one type of test for texture analysis, because the results obtained allow a complementing evaluation of different aspects related to the texture of cheese. Regard-ing the textural properties of the Serra da Estrela cheeses evaluated, some differences were observed between the top and bottom sides of the cheeses, as well as between cheeses from different dairies, except for the properties springiness, resilience, cohesiveness and adhesiveness (all from compression test), for which no significant dif-ferences were found. In what concerns the variations along the milking season, it was possible to conclude that dairies D2, D5 and D4 were those that produced cheeses with a more constant textural profile along the time con-sidered, which for this study was between April and June. The correlations between the textural properties were strong for some interactions between properties from the
Table 4: Component matrix obtained by factor analysis with Varimax
rotation Factor 1 (external pressure textural properties) Factor 2 (perforation textural properties) Compr es sion HAR 0.990 (*) ADH (*) (*) RES 0.717 (*) COH 0.450 (*) SPR 0.597 (*) CHE 0.988 (*) Pun ctur e CRFIR (*) 0.781 INFIR (*) 0.702 STI (*) -0.797 ADHP (*) -0.810 Spr ead HARS 0.764 (*)
1HAR = Hardness, ADH = hesiveness, RES = Resilience, COH = Cohesiveness, SPR = Springiness, CHE = Chewiness, CRFIR = Crust firmness, INFIR = Inner Firmness, STI = Stickiness, ADHP = Adhe-siveness (puncture), HARS = Hardness (spreadability)
Texture of Serra da Estrela cheese 485
same test and/or from similar nature, like the evalua-tions made by compression or spreadability of the exter-nal surface. Fiexter-nally, factor aexter-nalysis clearly identified two factors, one strongly associated with the external pressure textural properties and the other with the perforation tex-tural properties.
Acknowledgments: The authors thank the FCT
(Por-tuguese Foundation for Science and Technology), the Polytechnic Institute of Viseu and CI&DETS for their support under project UID/Multi/04016/2016.
This work was prepared in the ambit of the project approved and financed by FCT with reference 02/ SAICT/2016/23290, titled “QClasse: Caracterização e Val-orização da autenticidade do QSE DOP e sua vocação para a promoção da Saúde”.
Conflict of interest: Authors declare no conflict of
inter-est.
References
[1] Broen M.P.G., Moonen A.J.H., Kuijf M.L., Dujardin K., Marsh L., Richard I.H., Starkstein S.E., Martinez–Martin P., Leentjens A.F.G., Factor analysis of the Hamilton Depression Rating Scale in Parkinson’s disease. Parkinsonism & Related Disorders, 2015, 21, 142–146, https://doi.org/10.1016/j. parkreldis.2014.11.016
[2] Caroli A., Poli A., Ricotta D., Banfi G., Cocchi D., Invited review: Dairy intake and bone health: a viewpoint from the state of the art. J. Dairy Sci., 2011, 94, 5249–5262, https:// doi.org/10.3168/jds.2011-4578
[3] Chen G.-C., Wang Y., Tong X., Szeto I.M.Y., Smit G., Li Z.-N., Qin L.-Q., Cheese consumption and risk of cardiovascular disease: a meta-analysis of prospective studies. Eur J Nutr, 2016, 1–11, https://doi.org/10.1007/s00394-016-1292-z [4] Correia P., Vítor A., Tenreiro M., Correia A.C., Madanelo
J., Guiné R., Effect of different thistle flower ecotypes as milk-clotting in Serra da Estrela cheese. Nutrition & Food Science, 2016, 46, 458-475, https://doi.org/10.1108/NFS-12-2015-0157
[5] CorreiaP.M.R., Vítor A., Tenreiro M., Correia A.C., Pinto A., Correia P., Madanelo J., Vacas M., Guiné R.P.F., Influence of different processing parameters in physical and sensorial properties of Serra de Estrela cheese. Journal of Hygienic Engineering and Design, 2014, 8, 135-140
[6] Cunha J.T., Ribeiro T.I.B., Rocha J.B., Nunes J., Teixeira J.A., Domingues L., RAPD and SCAR markers as potential tools for detection of milk origin in dairy products: Adulterant sheep breeds in Serra da Estrela cheese production. Food Chemistry, 2016, 211, 631-636, https://doi.org/10.1016/j. foodchem.2016.05.109
[7] Ferrão A., Guiné R., Cheese: Nutritional Aspects and Health Effects, in: Cheeses around the World: Types, Production,
Properties and Cultural and Nutritional Relevance. Nova Science Publishers, New York, USA, 2019, pp. 17-46 [8] Guiné R., Correia P., Correia A., Comparative Evaluation
of Portuguese Goat and Sheep Cheeses. Millenium, 2015, 111-130
[9] Guiné R., Florença S., The Economic and Social Importance of Cheese, in: Cheeses around the World: Types, Production, Properties and Cultural and Nutritional Relevance. Nova Science Publishers, New York, USA, 2019, pp. 1-15 [10] Guiné R., Florença S., Correia P.M.R, Portuguese Traditional
Cheeses: Production and Characterization, in: Cheeses around the World: Types, Production, Properties and Cultural and Nutritional Relevance. Nova Science Publishers, New york, USA, 2019, pp. 115-161
[11] Hinrichs J., Mediterranean milk and milk products. Eur J Nutr 43, 2004, i12–i17, https://doi.org/10.1007/s00394-004-1104-8
[12] Kaiser H.F., Rice J., Little Jiffy, Mark Iv. Educational and Psychological Measurement, 2974, 34, 111-117, https://doi. org/10.1177/001316447403400115
[13] Keller J.L., Lanou A., Barnard N.D., The consumer cost of calcium from food and supplements. J Am Diet Assoc, 2002, 102, 1669-1671
[14] Maroco J., Análise Estatística com o SPSS Statistics, 5a Ed. ed. Report number, Brazil, 2012
[15] Mihaylova B., Emberson J., Blackwell L., Keech A., Simes J., Barnes E., Voysey M., Gray A., Collins R., Baigent C., The effects of lowering LDL cholesterol with statin therapy in people at low risk of vascular disease: meta-analysis of individual data from 27 randomised trials. The Lancet, 2012, 380, 581-590, https://doi.org/10.1016/ S0140-6736(12)60367-5
[16] Pestana M.H., Gageiro J.N., Análise de Dados para Ciências Sociais – A complementaridade do SPSS, 6a ed. ed. Edições Sílabo, Brasil, 2014
[17] Reis P.J.M., Malcata F.X., Ripening-related changes in Serra da Estrela cheese: A stereological study. Journal of Dairy Science, 2011, 94, 1223-1238, https://doi.org/10.3168/ jds.2010-3416
[18] Rohm A.J., Swaminathan V., A typology of online shoppers based on shopping motivations. Journal of Business Research, Marketing on the web - behavioral, strategy and practices and public policy, 2004, 57, 748-757, https://doi. org/10.1016/S0148-2963(02)00351-X
[19] Rozenberg S., Body J.-J., Bruyère O., Bergmann P., Brandi M.L., Cooper C., Devogelaer J.-P., Gielen E., Goemaere S., Kaufman J.-M., Rizzoli R., Reginster J.-Y., Effects of Dairy Products Consumption on Health: Benefits and Beliefs—A Commentary from the Belgian Bone Club and the European Society for Clinical and Economic Aspects of Osteoporosis, Osteoarthritis and Musculoskeletal Diseases. Calcif Tissue Int, 2016, 98, 1-17, https://doi.org/10.1007/s00223-015-0062-x
[20] Stevens J.P., Applied Multivariate Statistics for the Social Sciences, Fifth Edition, 5 edition. ed. Routledge, New York, 2009
[21] Tavaria F.K., Franco I., Javier Carballo F., Xavier Malcata F., Amino acid and soluble nitrogen evolution throughout ripening of Serra da Estrela cheese. International Dairy
Journal, 203, 13, 537-545, https://doi.org/10.1016/ S0958-6946(03)00060-8
[22] Tavaria F.K., Reis P.J.M., Malcata F.X., Effect of dairy farm and milk refrigeration on microbiological and microstructural characteristics of matured Serra da Estrela cheese. International Dairy Journal, 2006, 16, 895-902, https://doi. org/10.1016/j.idairyj.2005.08.010
[23] Weaver C.M., Proulx W.R., Heaney, R., Choices for achieving adequate dietary calcium with a vegetarian diet. Am J Clin Nutr, 1999, 70, 543s-548s