Universidade de Trás-os-Montes e Alto Douro
Towards a sustainable control of arthropod pests in Douro
Demarcated Region vineyards with emphasis on the grape berry moth,
Lobesia botrana (Denis & Schifermüller
)
Tese de Doutoramento em Ciências Agronómicas e Florestais
Cristina da Conceição Ribeiro Carlos
OrientadoresProfessora Doutora Laura Monteiro Torres Professor Doutor Antonio Maria Luís Crespí
Trabalho realizado com financiamento da ADVID e financiamento do Ministério da Agricultura, Mar, Ambiente e Ordenamento do Território, cofinanciado pelo FEADER «Fundo Europeu Agrícola de Desenvolvimento Rural: A Europa investe nas zonas rurais», no âmbito do PRODER (Med. 4.1; PA 24042 - projecto 020393024042 e PA 24043). Financiado pelo QREN, no âmbito do Programa Operacional Factores de Competitividade
À Prof. Laura Torres, por ter aceite orientar esta tese, pelos preciosos ensinamentos prestados e pela sua amizade. A sua motivação foi determinante, quer no lançamento deste projecto, quer na sua recta final, acreditando que era possível concluí-lo, em tempo record.
Ao Prof. António Crespí, pelo seu apoio na co-orientação da tese, ajuda prestada nos levantamentos florísticos efectuados nas encostas declivosas das quintas do Douro, conhecimentos transmitidos e apoio no tratamento dos dados da flora.
À ADVID, pelo financiamento do trabalho, à Rosa Amador e ao José Manso, por apoiarem incondicionalmente o trabalho desenvolvido pela equipa na área da biodiversidade funcional e aos colegas, que colaboraram na recolha de dados, em especial à Maria do Carmo Val.
Ao Fernando Alves, pelos preciosos ensinamentos técnicos transmitidos, fundamentais para o desenvolvimento da minha actividade profissional na ADVID.
Aos Associados da ADVID, que disponibilizaram as suas vinhas e meios para a recolha de dados (em especial à Sogevinus, Sogrape, Real Companhia Velha, Symington, Quinta de Ventozelo, Quinta do Vallado e Quinta de D. Matilde). Aos técnicos das empresas envolvidas, em especial, ao Márcio Nóbrega (Sogevinus), ao Rui Soares (Real Companhia Velha) e ao Eduardo Gomes (Sogrape), pela disponibilização de informações variadas, e por abraçarem este projecto de forma exemplar, demonstrando um especial interesse pelo conhecimento da biodiversidade do ecossistema vitícola Duriense.
Aos viticultores do Douro, que representam uma verdadeira lição de vida e de perseverança, pois apesar das “pedras encontradas no caminho”, conseguiram moldar a Natureza de forma sábia, construindo e mantendo uma região vitícola ímpar no mundo. Ao “Douro”, pela paixão, encanto e entusiasmo que imprime diariamente na minha actividade profissional.
Aos taxonomistas que colaboraram na identificação dos artrópodes capturados, designadamente à Claire Villemant (Museu História Natural de Paris), pela identificação dos himenópteros parasitóides, ao Luís Crespo (Universidade de Lisboa), pela identificação dos Araneae, à Vera Zina (Universidade de Lisboa), pela identificação dos formicídeos, ao Roberto Canovai (University of Pisa) pela identificação dos coccinelídeos, à Marta Goula (Universidade de Barcelona) pela identificação dos heterópteros e à Valeria Trivellone (Swiss Federal Research Institute WSL), pela identificação dos Cicadomorpha e Fulgoromorpha.
Ao Projecto Ecovitis - “Maximização dos Serviços do Ecossistema Vinha na Região Demarcada do Douro”, que financiou parte da identificação de material recolhido, a participação em eventos de disseminação dos resultados e a obtenção de dados de caracterização geográfica das parcelas em estudo.
nas suas vindas ao Douro, a curiosidade por saber mais sobre a traça da uva, e pela disponibilização de bibliografia preciosa como ponto de partida para a tese.
À Susana Sousa e à Sara Meireles, pelo apoio na recolha de dados.
Ao Prof. José Aranha e à Juliana Salvação, pelo apoio na caracterização geográfica das parcelas de estudo.
Aos Prof. José Carlos Franco, pelos conhecimentos transmitidos sobre infraestruturas ecológicas e pela disponibilização de bibliografia.
À Prof. Ana Maria Nazaré Pereira, pelas preciosas indicações e sugestões de melhoria dadas nas apresentações, pelas suas qualidades e competências pessoais e profissionais. À Prof. Irene Oliveira (UTAD) e ao Daniel Paredes (Environmental Protection, EEZ-CSIC), pelo apoio no tratamento estatístico dos dados (em tempo record!) e pelo apoio na interpretação dos resultados obtidos.
À Anabela Nave, pelos excelentes momentos de partilha pessoal e profissional no “nosso” laboratório de entomologia, apoio na recta final da tese e, em especial, pela sua amizade. À Conceição Rodrigues e à Ilda Gonçalves, pelos momentos de amizade, passados ao longo deste percurso.
À Fátima Gonçalves, por todo o apoio prestado na tese (mesmo em horas impróprias), pelo apoio no tratamento estatístico de dados e revisão final dos textos (em tempo record!). Um especial agradecimento pela sua amizade, momentos de partilha, caminhadas relaxantes e por ser uma verdadeira irmã para mim. À família Gonçalves, um especial agradecimento, por me considerarem como parte da sua família.
Aos meus “ninos” que me acompanham no dia-a-dia.
Ao meu irmão, cunhada e sobrinho, por me darem ânimo e apoio e pelos momentos únicos de convívio em família, que me preenchem o coração.
Finalmente, aos meus pais, que me transmitiram preciosos ensinamentos, valores essenciais, pelo apoio incondicional e pelo exemplo que são diariamente para mim. A todos os que contribuíram, de uma maneira ou de outra, para que este trabalho chegasse a bom termo,
ix Abstract
The aim of the present thesis was to contribute to the development of an environmentally sustainable pest management strategy for controlling the main arthropod pests in Douro Demarcated Region (DDR) vineyards, with emphasis on the grape berry moth, Lobesia botrana, a key-pest of the crop in this region. Due to the impact of L.botrana in the quality of the wines produced in DDR, the increasing regulation of pesticides in Europe and the increasing interest for sustainable production approaches, we intend to contribute for the development of an effective control strategy against this pest, based on conservation biological control and mating disruption technique with the support of degree-day models to better timing sampling or control operations and ultimately to improve Integrated Pest Management tactics.
With the overall goal mentioned, the following aspects were studied: a) evaluation of the impact of non-crop habitats (NCH) adjacent to vineyards as well as ground cover vegetation of terraced vineyards, on the overall biodiversity of arthropods, including natural enemies (predators and parasitoids) and main vineyard pests; b) survey of L. botrana parasitoids carried over a nine-year period; c) development of a degree-day (DDº) models to predict the occurrence of the main phases of the flight curve of L. botrana; two starting points for degree-day accumulation were tested, a biological event (the first male catch) and a calendar date (January 1st) and d) evaluation of the effectiveness of using mating disruption technique (MD) against L. botrana in DDR, as well as identification of main constraints to its use in the region.
The results obtained showed the importance of maintaining both NCH on the neighborhood of vineyards and vegetation of slopes and horizontal alleys to enhance functional biodiversity of this agroecosystem. It was found that they could act as potential ecological infrastructures in the increase of populations of natural enemies of vineyard´s pests, namely predators (spiders and coccinelids) and parasitoids.
Although closely related groups displayed different responses to land use and habitat preferences, the abundance of omnivores and predators was, in general, higher in NCH than in vineyards. Preserving NCH near the vineyards, as well as promoting local vegetation, enhances the presence of ground-dwelling arthropods.
It was found that the complex of L. botrana parasitoids, as well as the potential role played by each species to control the pest, are greatly variable in space and time, with the rates
x
of parasitism being substantially higher in the pest 1st generation compared to that of the other two generations. The most promising candidate to enhance conservation biological control of L. botrana in DDR vineyards is Elachertussp. (Hym: Eulophidae). This is because, on one hand, this larval ectoparasitoid has a wide geographical distribution in the studied region and on the other hand, in most favorable conditions, the percentage of parasitism can reach 60%, mainly in the 1st generation of the pest. Campoplex capitator and Brachymeria tibialis appears to have a complementary role on the parasitism of the first and second generations of L. botrana, respectively. Moreover, it was found that the parasitism rate was related with ground cover management and chemical treatments. Results suggest that, for enhancing conservation biological control of L. botrana in DDR, a high abundance and diversity of vegetation (ground covers) inside or at the edge of vineyards plots should be enhanced and a selection of pesticide with minimal risks to parasitoid´s activity should be performed.
Nonlinear models based on Boltzmann regression equations were developed and predicted with reasonable accuracy the flight phenology of L. botrana, although the one that use first catches as starting point for accumulation was more accurate on predicting the second and third flights of the insect. Even though the use of a biofix, here considered to be a biological event, seems to improve the model accuracy, the use of a fixed calendar date (January 1st) should be preferred, from the practical point of view and considering large scale application of an IPM strategy.
In general MD was more effective in years of low pest population density, when applied in large areas, with more points of release per hectare, and after consecutive seasons. Some major constraints to the use of this technique in DDR could be identified, namely: the high biotic potential of L. botrana; the climate conditions, particularly the high summer temperatures; the effect of the winds on the distribution of the pheromone on the hill; the impact of slope; the fragmentation of many vineyards and the size of the treated area.
Keywords: biodiversity, conservation biological control, ecological infrastructures, integrated pest management, mating disruption
xi
Dissemination
Scientific publicationsInternational peer-reviewed papers
Carlos C, Gonçalves F, Torres L. The use of a degree-day model to forecast flight activity of the grape berry moth, Lobesia botrana, in Douro Demarcated Region (Northeast of Portugal). Crop Protection (accepted after revision)
Carlos C, Gonçalves F, Sousa S, Salvação J, Sharma L, Soares R, Manso J, Nóbrega M, Lopes A, Soares S, Aranha J, Villemant C, Marques G, Torres L (2013) Environmentally safe strategies to control the European Grapevine Moth, Lobesia botrana (Den. & Schiff.) in the Douro Demarcated Region. Ciência e Técnica Vitivinícola: 28: 1006-1011
Internacional reviewed papers
Carlos C, Gonçalves F, Sousa S, Nóbrega M, Manso J, Costa J, Gaspar C, Domingos J, Silva L, Fernandes D, Val MC, Franco JC, Thistlewood H, Torres L (2014) Success of mating disruption against the European grapevine moth, Lobesia botrana (Den. & Schiff): a whole farm case-study in the Douro Wine Region. IOBC/WPRS Bull, 105: 93-102
Carlos C, Afonso S, Crespí A, Aranha J, Thistlewood H, Torres L (2012) Biodiversity of plants and arthropods in key ecological structures of vineyards of the Alto Douro region. IOBC/WPRS Bull, 75: 51-55
Carlos C, Val MC, Marques G, Torres L (2011) New approaches for management of European Grapevine Moth, Lobesia botrana, in the Douro Wine Region, Portugal. Am J Enol Vitic, 62 (3): 389A-389A Carlos C, Alves F, Torres L (2010) Eight years of practical experience with mating disruption to control
grape berry moth, Lobesia botrana, in Porto Wine Region. IOBC/WPRS Bull: 54: 405-409 Carlos C, Costa JR, Tão CB, Alves F, Torres LM (2006) Parasitismo associado à traça da uva, Lobesia
botrana (Den. & Schiff.) na Região Demarcada do Douro. Bol San Veg Plagas, 32: 355-362 Carlos C, Costa J, Gaspar C, Domingos J, Alves F, Torres L (2004) Mating disruption to control the grape
vine moth, Lobesia botrana (Den. & Schiff.) in a Porto Wine Region vineyard: a three-year study. IOBC/WPRS Bull: 28 (7): 283-287
Poster presentations in international conferences
Carlos C, Gonçalves F, Val MC., Sousa S. Nóbrega M, Manso J, Soares R, Martinho, A, Soares S, Torres L (2015) Mating disruption against Lobesia botrana Den. & Shiff) using Isonet Ltt dispensers in the Douro Wine Region (Portugal). Proceedings Conference IPM innovation in Europe, 14th-16th Jan 2015, Poznan, Poland: 52
Carlos C, Meireles S, Val MC, Alves F, Crespí A, Torres L (2011) Enhancing functional Biodiversity in Douro Wine Region vineyards. 34th OIV - World Congress of Vine and Wine. 20th -27th June 2011, Porto. Abstract ID: 468
Oral presentations in international conferences
Goula M., Gonçalves F, Carlos C, Torres L (2016) Heteroptera from vineyards and adjacent vegetation. Proceedings 17th Congresso Ibérico de Entomologia. Sociedade Portuguesa de Entomologia (SPEN), Laboratório Nacional de Engenharia Civil (LNEC), Asociación española de Entomología (AeE). 5th-8th Sept. 2016. Centro de Congressos do Laboratório de Engenharia Civil, Lisboa Carlos C, Gonçalves F, Sousa S, Salvação J, Sharma L, Soares R, Manso J, Nóbrega M, Lopes A, Soares
S, Aranha J, Villemant C, Marques G, Torres L (2013) Environmentally safe strategies to control the European Grapevine Moth, Lobesia botrana (Den. & Schiff.) in the Douro Demarcated
xii
Region. 18th International Symposium GiESCO, Faculty of Sciences of the University of Porto. July 7th - 11th 2013
Carlos C, Gonçalves F, Sousa S, Nóbrega M, Manso J, Costa J, Gaspar C, Domingos J, Silva L, Fernandes D, Val MC, Franco JC, Thistlewood H, Torres L (2013) Success of mating disruption against the European grapevine moth, Lobesia botrana (Den. & Schiff): a whole farm case-study in the Douro Wine Region. IOBC-WPRS Meeting Group "Integrated Protection and Production in Viticulture". Ascona, Switzerland, 13th -17th October. 2013
Carlos C, Val MC, Marques G, Torres L (2011) New approaches for management of European Grapevine Moth, Lobesia botrana, in the Douro Wine Region, Portugal. 62th ASEV National Conference. June 20–24, 2011. Monterey, California USA, 62
Carlos C, Val C, Rataux A, Aranha J, Crespí A, Marques G, Torres L (2011) Does the landscape of Douro Wine Region affect the complex of antagonists of the grape berry moth? Proceedings 18th IaleUK Conference “Landscape ecology and ecosystem services”, Wolverhampton University, Telford Campus, England. 6th-8th Sept. 2011. 71
Carlos, C., Alves, F. & Torres, L. (2008) Eight years of practical experience with mating disruption to control grape berry moth, Lobesia botrana, in Porto Wine Region. VII International Conference on Integrated Fruit Production, Avignon, France, 27-30 October: 118-119
Carlos C, Alves F, Torres L (2010) Constrains to the application of mating disruption against Lobesia botrana in Douro Wine Region. In 3rd International Congress of mountain and Steep slope viticulture, Castiglione di Sicilia. Sicily, Italy. 12th – 14th May 2010. 103-110
Carlos CR, Costa JR, Tão CB, Alves F, Torres LM (2005) Parasitismo associado à traça-da-uva, Lobesia botrana (Den. & Schiff.) na Região Demarcada do Douro. Proceedings IV Congreso Nacional de Entomología Aplicada. X Jornadas Científicas de la SEEA. I Jornadas Portuguesas de Entomologia Aplicada, Escola Superior Agrária de Bragança, 17th-21th October. 2005, Bragança
Poster presentations in national conferences
Carlos C, Sousa S, Nave A, Gonçalves F, Fernandes R, Crespí A, Torres L (2012) Artrópodes associados à flora da Região Demarcada do Douro. Semana da Biodiversidade – ADVID. Quinta do Tedo, Tabuaço, 28 May 2012
Fernandes R, Carlos C, Crespí A, Torres L (2011) Artrópodes associados à vegetação espontânea das vinhas da região demarcada do Douro. 9º Encontro Nacional de Protecção Integrada, Escola Superior Agrária de Viseu, 17-18 Nov. 2011
Carlos C, Crespí A, Torres L (2011) A gestão da flora da vinha da Região Demarcada do Douro no incremento dos serviços facultados pelo ecossistema. Conference “Gestão e Conservação de Habitats e Flora Associada”. Sociedade Portuguesa de Botânica, ALFA - Associação Lusitana de Fitossociologia. Escola Superior Agrária de Coimbra, 25 March 2011
Oral presentations in national conferences
Carlos C, Gonçalves F, Val MC, Sousa S, Nóbrega M, Manso J, Soares R, Martinho A, Soares S, Torres L (2014) A confusão sexual da traça-da-uva na Região Demarcada do Douro com recurso a difusores Isonet-LTT. Proceedings 1st Simposium SCAP Novos Desafios na protecção das plantas / 7th Congress Sociedade Portuguesa de fitopatologia. 20th-21th November. 2014, Auditório INIAV, Quinta do Marquês, Oeiras: 36
Carlos C, Gonçalves F, Sousa S, Salvação J, Nóbrega M, Manso J, Soares R, Lopes A, Franco JC, Thistlewood H, Aranha J, Torres (2013) Resultados da aplicação do novo difusor de feromona ISONET-LTT em duas explorações com historial de ataque de traça-da-uva na RDD. Workshop “Maximização dos serviços do ecossistema vinha”, Ecovitis project. Vila Real, 13th-14th November
Carlos C (2012) Biodiversidade de plantas e artrópodes associados à vinha da RDD. Forum INFOWINE “Thinking "out of the Bottle". VINIDEAS. 31 May 2012, Vila Real
xiii
Carlos C (2012) Biodiversidade funcional em viticultura no Douro. Workshop “Vitivinicultura e Biodiversidade, Boas práticas agrícolas e Valor acrescentado”. QUERCUS. Sec. Estado Agricultura, Lisboa, 20th November 2012
Carlos C (2012) Biodiversidade de plantas e artrópodes associados à vinha da RDD. Semana da Biodiversidade – ADVID. Quinta do Tedo, Tabuaço, 28 de May 2012
Carlos C (2011) Biodiversidade funcional em viticultura. Conference “Biodiversidade em viticultura – Um potencial de diferenciação no mercado?”. Auditório do INRB IP / INIA, Dois Portos, 15 December 2010
Carlos C, Val M C, Meireles S, Crespi A, Torres L (2010) Biodiversidade e protecção biológica de conservação contra pragas da vinha, na Região Demarcada do Douro. 12th Encontro Nacional da Sociedade Portuguesa de Ecologia “Serviços dos Ecossistemas. Desafios e ameaças num mundo em mudança”. Porto, 18th-20th October
Technical documents
Gonçalves F, Carlos C, Crespo L, Torres L (2014) O campo no seu bolso nº 2. Amigos desconhecidos do agricultor - aracnídeos, insectos e centopeias. In Torres, L (coord.). Edibio Edições, Lda, 118pp. ISBN 978-972-99697-4-4
Gonçalves F, Carlos C, Torres L (2013) Inimigos naturais das pragas da vinha: insectos e aracnídeos. Quem são e onde estão? Associação para o Desenvolvimento da Viticultura Duriense, 81pp. ISBN 978-989-98368-2-2
Gonçalves F, Carlos C, Torres L (coord) (2013)Fauna associada à vinha da Região Demarcada do Douro. Associação para o Desenvolvimento da Viticultura Duriense, 57. ISBN 978-989-98368 -3-9 Carlos C (2012) Technical Notes 4 - Mating Disruption of the grapevine moth in the Douro Region.
ADVID Technical notes. 12 pp. ISBN: 978-989-95481-5-2
Carlos C (2012) Technical Notes 1 - The grapevine moth. ADVID Technical notes. 12 pp. ISBN: 978-989-95481-4-5
xiv
International cooperation
During this thesis, international contacts were made and the help and cooperation of the following individuals/institutions were obtained:
- Andrea Lucchi (University of Pisa, DAFE)
- Bruno Bagnoli (Tuscia University, Viterbo DIBAF)
- Claire Villemant (Curator of Hymenoptera, Natural History Museum, Paris)
- Howard Thistlewood (Pacific Agri-Food Research Centre, Agriculture and Agri-Food Canada) - Lucia Varela (University of California, Cooperative Extension of Sonoma county)
- Marta Goula (University of Barcelona) - Roberto Canovai (University of Pisa, DAFE)
- Stephen Wratten (Lincoln University / Bio-Protection Research Centre) - Valeria Trivellone (Swiss Federal Research Institute WSL)
xv
Table of contents
Abstract ix
Dissemination xi
International cooperation xiv
Table of contents xv
List of figures xix
List of tables xxi
List of supplements xxiii
CHAPTER 1
General Introduction
1.1 General Introduction 3
1.2 References 5
CHAPTER 2
Can woodlands, scrublands and terraces vegetation in Douro Demarcated Region vineyards enhance functional biodiversity of arthropods?
Abstract 9
2.1 Introduction 11
2.2 Material and methods 12
2.2.1 Study sites 12
2.2.2 Flora and arthropods assessments 14
2.2.3 Data analysis 15
2.3 Results 17
2.3.1 Flora 17
2.3.2 Arthropods 18
2.3.3 Effect of sampling period, site and habitat on arthropods assemblage 20 2.3.4 Effect of the distance from the NCH and the vegetation, on
arthropod’s abundance and richness 22
2.4 Discussion 27
2.4.1 Flora 27
xvi
2.4.3 Effects of distance from NCH and vegetation on arthropod’s
abundance and richness 28
2.5 Conclusions 31
2.6 References 32
CHAPTER 3
Functional biodiversity of soil arthropods associated with terraced vineyards in Douro Demarcated Region
Abstract 49
3.1 Introduction 51
3.2 Material and methods 52
3.2.1 Study sites 52 3.2.2 Data collection 54 3.2.3 Statistical analysis 55 3.3 Results 56 3.3.1 Arthropods 56 3.3.2 Flora 59
3.3.3 Effect of sampling date, site and habitat on arthropods 60
3.3.4 Effect of habitat and vegetation on arthropods 62
3.4 Discussion 66
3.4.1 Effect of sampling date 67
3.4.2 Effect of habitat and vegetation 67
3.5 References 71
CHAPTER 4
Towards the development of a conservation biological control strategy against Lobesia botrana in Douro Demarcated Region
Abstract 87
4.1 Introduction 89
4.2 Material and methods 91
4.2.1 Management practices 91
4.2.2 Parasitim of Lobesia botrana 92
4.2.3 Landscape analysis 92
4.2.4 Data analyses 93
4.3 Results 94
4.3.1 Parasitism of Lobesia botrana 94
xvii 4.4 Discussion 101 4.4.1 Parasitoids diversity in DDR 101 4.4.2 Determinants of parasitism 102 4.5 Conclusions 104 4.6 References 106 CHAPTER 5
The use of a degree-day model to forecast flight activity of the grape berry moth, Lobesia botrana, in Douro Demarcated Region (Northeast of Portugal)
Abstract 125
5.1 Introduction 127
5.2 Material and methods 129
5.2.1 Study area 129
5.2.2 Data collection 131
5.2.3 Models development 132
5.2.4 Models validation/ accuracy 133
5.3 Results 134
5.3.1 Lobesia botrana flight phenology 134
5.3.2 Nonlinear models developed 135
5.3.3 Models validation / accuracy 137
5.4 Discussion and conclusions 139
5.5 References 143
CHAPTER 6
Does mating disruption of Lobesia botrana (Den. & Schiff) works under Douro Demarcated Region conditions?
Abstract 151
6.1 Introduction 153
6.2 Material and methods 154
6.2.1 Study sites 154
6.2.2 Type and number of dispensers 155
6.2.3 Evolution of pheromone in dispensers 156
6.2.4 Evaluation of mating disruption efficacy 156
6.3 Results and discussion 157
6.3.1 Evolution of pheromone in dispensers 157
6.3.2 Mating disruption efficacy 159
xviii
CHAPTER 7
General discussion and conclusions
7.1 General discussion and conclusions 167
xix
List of figures
Figure 2.1 General characteristics of site A agroecosystem 13 Figure 2.2 Mean (±S.E.) of abundance (grey bars) and richness (white bars) of
arthropods collected by suction sampling, in each sampling period (A), site (B) and habitat (C). Statistical significance was based on marginal estimated means for p<0.05. Legend: NCH – woodland and/or scrubland lots; SV – slope vegetation; GC 5, 25 and 50 – ground cover vegetation at, respectively, 5, 25 and 50 m from NCH; V5, 25 and 50 – vine canopy at respectively, 5,
25 and 50 m from NCH 21
Figure 2.3 Multidimensional scaling ordination based on Chao-Jaccard similarity
index between spider comunities collected by suction in the different farms and habitats (STRESS-I = 0.168 (fair); D.A.F = 0.972 (very good)) (NCH – woodland and/or scrubland lots; SV – slope vegetation; GC 5, 25 and 50 – ground cover vegetation at, respectively, 5, 25 and 50 m from NCH; V5, 25
and 50 – vine canopy at, respectively, 5, 25 and 50 m from NCH) 25
Figure 2.4 Mean abundance of each functional guild of Araneae in each habitat and
site. (NCH – woodland and/or scrubland lots; SV – slope vegetation; GC 5, 25 and 50 – ground cover vegetation at, respectively, 5, 25 and 50 m from NCH; V5, 25 and 50 – vine canopy at, respectively, 5, 25 and 50 m from
NCH) 26
Figure 3.1 Experimental design followed at site A 53 Figure 3.2 Specimens of Pheidole pallidula (A) and Plagiolepis pygmaea (B) 57 Figure 3.3 Specimens of Aphaenogaster iberica (A) and Cataglyphis hispanica (B) 57 Figure 3.4 Specimen of Palaeostigus palpalis 58 Figure 3.5 Specimens of Eratigena bucculenta(A), Eratigena feminea (B), Oecobius
machadoi (C) 59
Figure 3.6 Abundance (A) and richness (B) (mean ± S.E) of arthropods found in each
sampling date; values with the same letter aren’t significantly different from
each other (p<0.05). 61
Figure 3.7 Abundance (A) and richness (B) (mean ± S.E) of arthropods found in each
site. Values with the same letter aren’t significantly different from each other
(p<0.05). 61
Figure 3.8 Abundance (A) and richness (B) (mean ± S.E) of arthropods found in each
habitat. NCH - Non-crop habitat; 5 m, 25 m and 50 m – distances from NCH, inside the vineyards; Values with the same letter aren’t significantly different
from each other (p<0.05). 61
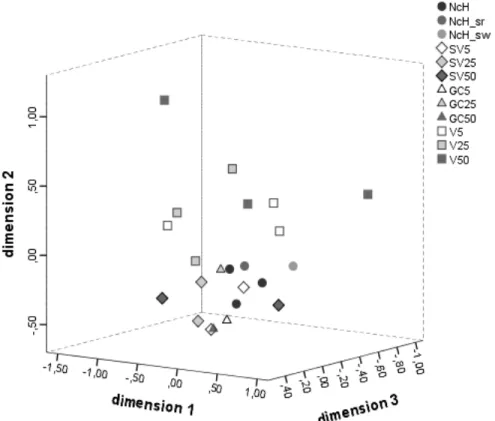
Figure 3.9 Non-metric Multidimensional scaling ordination showing distinct ant community composition between habitats including relationships with vegetation parameters (% total cover; % fresh cover and Richness (S) of cover). The two NMDS axis were significantly correlated with total percentage of cover (r2=0.293, p=0.001), percentage of fresh cover (r2=0.167, p=0.028) and richness of flora (r2=0.228, p=0.004), meaning that these variables explained 29.3%, 16.7% and 22.8% of the variation on Formicidae given by the two axes. GO: generalists and/or opportunists; C - cryptic; SpW - hot climate specialists and/or open habitats; SpC -
cold-climate specialists and/or shade habitats 65
xx
Figure 4.2 Campoplex capitator 96 Figure 4.3 Brachymeria tibialis 96
Figure 4.4 Dibrachys cavus 96
Figure 4.5 Ascogaster quadridentata 96
Figure 4.6 Elasmus cf steffani 96 Figure 4.7 Evolution of parasitism rates, according to the proportion of ecological
infrastructures at 100 m. The three lines in black, located above,
represents the relation obtained in vineyards with ground cover (solid line - predictions of the model with 0% of the chemical impact (score=0); dotted line- predictions of the model with 5% of the chemical impact measured on the experiment; dashed line- predictions of the model with 95% of the chemical impact measured on the experiment). The three lines in grey located below represents the same relations, but in vineyards with
bare soil 100
Figure 5.1 A) Detailed location of the trapping system at the DDR (BC-Baixo Corgo,
CC- Cima Corgo, DS- Douro Superior, sub-regions). B) Location of the DDR in Portugal (made by C. Carlos through Quantum GIS Development Team, 2014). Quantum GIS Geographic Information System. Open Source
Geospatial Foundation Project. http://qgis.osgeo.org . 129
Figure 5.2 Cumulative male trap catches of L. botrana for the first, second and third
flights vs. DDº, using first male catches as biofix. DDR (1989-1991,
2000-2013) 136
Figure 5.3 Cumulative male trap catches of L. botrana for the first, second and third
flights vs. DDº, using January 1st as starting point for DDº accumulation.
DDR (1989-1991, 2000-2013) 137
Figure 6.1 S. Luíz farm (Source: ESRI Arcgis online). The colored polygons represent
area under MD; each division of the scale represent 0.1 km 154
Figure 6.2 Evolution of the % of active ingredient on dispensers and monthly mean
temperatures in 2002 (A) and 2013 (B). Arrows indicate the usual period for
the beginning of the 3rd generation in DDR 158
Figure 6.3 Flight curve of L. botrana based on the number (mean ± standard error) of
male moths captured per week on control plots, during the period 2001-2013 159
Figure 6.4 Infested clusters (expressed as % of grapes with at least one berry infested)
at different locations of S. Luíz at harvest on the period 2001-2009
(ISONET-L). * Sprayed with insecticide in 2nd or 3rd generations 160
Figure 6.5 Infested clusters (expressed as % of grapes with at least one berry infested)
at different locations of S. Luiz at harvest on the period 2010-2013
(ISONET-Ltt). * Sprayed with insecticide in 2nd or 3rd generations 160
xxi
List of tables
Table 2.1 Plant species most frequently found in each studied site and habitat (average
percentage of frequency at each sampling station, n = 3) 18
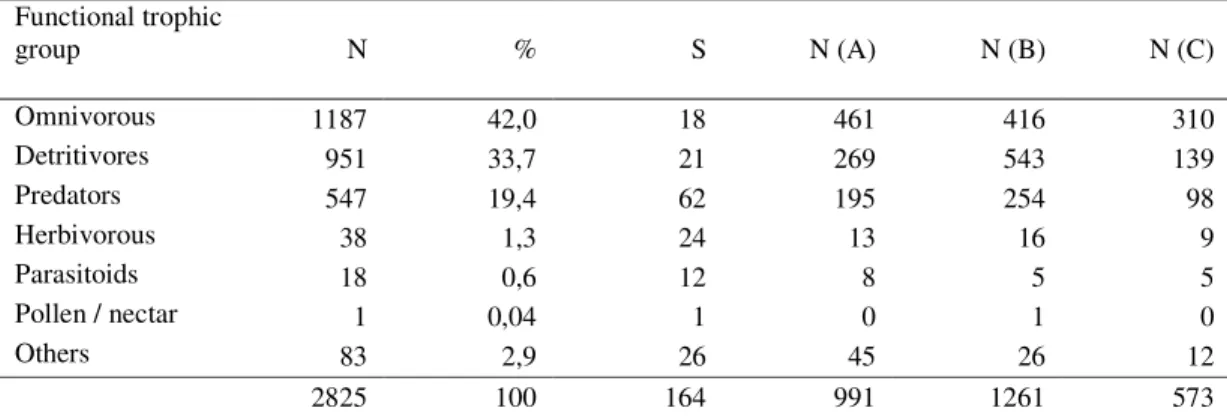
Table 3.1 Abundance (N), relative percentage (%) and richness (S) of arthropod
morpho-species found in each functional trophic group and abundance (N)
of each group in the studied sites (A, B and C) 58
Table 3.2 Abundance (mean ± SE) of arthropods caught, according to sampling date 60 Table 3.3 Abundance (mean ± S.E) of total arthropods, predators, detritivores and
omnivores among sites and in all sites, together 62
Table 3.4 Significant Pearson’s correlations found between groups of arthropods and
richness and/or percentage of cover (fresh and or fresh + dry) 63
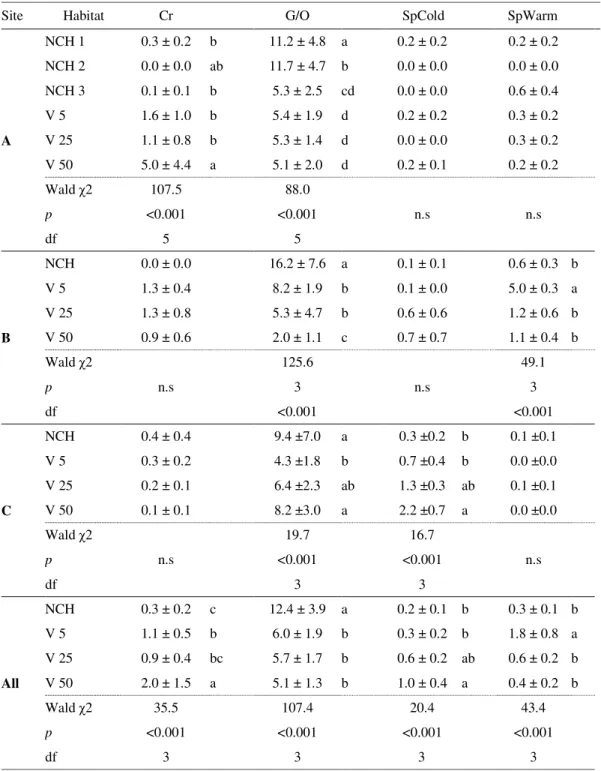
Table 3.5 Abundance (mean ± S.E) of each functional group of Formicidae among
sites and in all sites, together 64
Table 4.1 Abundance (N) and relative percentage (%) of Lobesia botrana parasitoids identified in Douro Demarcated Region, during the studied period
(2002-2015), and parasitized generation 95
Table 4.2 Parasitism rates (mean ± SE) found per generation of Lobesia botrana, in
Douro Demarcated Region during the studied period (2002-2015) 97
Table 4.3 Variation of the parasitism rates (%) caused in Lobesia botrana by each of the five-main species of parasitoids identified in Douro Demarcated Region
during the studied period (2002-2015) 97
Table 4.4 Relative abundance (N) and percentage (%) of the main parasitoid species of each generation of Lobesia botrana in Douro Demarcated Region, during the studied period (2002-2015). Only samples with more than 10
larvae/pupae of L. botrana were included in the analysis 98
Table 4.5 Analysis of level of infestation by L. botrana per generation found in
vineyards, during the study period (2002-2015). 98
Table 4.6 Comparison of alternative models (using AIC) for Lobesia botrana parasitism rates tested in the study. The best model (lowest AIC) is indicated in bold type. For brevity, only the most parsimonious (lowest AIC) of all
possible models are reported. R2 refer to the best model. 99
Table 5.1 General description of the study sites as well as wine varieties 131 Table 5.2 Observed values (means ± SE) for the occurrence of first catches of L.
botrana males of each flight (in Julian-days (JD) and degree-days (ºDD)) and peak of catches (in ºDD) by using first male catches (1st catch) and January 1st (1 jan) as a starting point for DDº accumulation. DDR (1989-1991,
2000-2013) 135
Table 5.3 Boltzmann regression equations showing the relation between DDº
accumulation ( ) and cumulative percentage of L. botrana adult male catches
(Y) across all sites and years, using first male catches as biofix. DDR
(1989-1991, 2000-2013) 135
Table 5.4 Boltzmann regression equations showing the relation between DDº
accumulation ( ) and cumulative percentage of L. botrana adult male catches (Y) across all sites and years, using January 1st as starting point for DDº
xxii
Table 5.5 Parameters obtained on linear regression between observed values of
cumulative catches of L. botrana males in the pheromone traps obtained in the period 2014- 2016 and predictive values obtained by the models, using 1st catches and January 1st, as starting points for ºDD accumulation (SP-DDº) 138
Table 6.1 General information about the surfaces and the type and number of
dispensers applied in S. Luiz farm during the present study 155
Table 6.2 Number of L. botrana on control plots and % of reduction of catches on MD
xxiii
List of supplements
S2 - Table 2.1 Richness (mean ± S.E) of species and percentage of different type of soil
cover (mean ± S.E) found in each habitat 37
S2 - Table 2.2 Average (± SE) abundance and richness of arthropods, per sampling
period (SP), site and common habitats assessed 38
S 2 - Table 2.3 Significant Spearman correlation (Rho) between abundance and richness of arthropods captured by suction and yellow sticky traps and vegetation parameters (% of cover, richness and % of herbaceous cover)
39
S2 - Table 2.4 Abundance and richness (mean ± SE) of arthropods collected by suction
sampling in each habitat in site A and results of generalized linear model (GzLM) analysis
40
S2 - Table 2.5 Abundance and richness (mean ± SE) of arthropods collected by suction
sampling in each habitat in site B and results of generalized linear model (GzLM) analysis
41
S2 - Table 2.6 Abundance and richness (mean ± SE) of arthropods collected by suction
sampling in each habitat in site C and results of generalized linear model (GzLM) analysis
42
S2 - Table 2.7 Abundance and richness (mean ± SE) of arthropods collected in yellow
sticky traps at each habitat in site A and results of generalized linear model (GzLM) analysis
43
S2 - Table 2.8 Abundance and richness (mean ± SE) of arthropods collected in yellow
sticky traps at each habitat modalities in site B and results of generalized linear model (GzLM) analysis
44
S2 - Table 2.9 Abundance and richness (mean ± SE) of arthropods collected in yellow
sticky traps at each habitat modalities in site C and results of generalized linear model (GzLM) analysis
45
S3- Fig. 3.1 Percentage of fresh cover (median ± interquartiles) found in each site (A-
site A; B- Site B; C- site C; D-all sites together) and habitat; values with the same letter are not significantly different from each other (p<0.05). 76
S3 - Fig 3.2 Percentage of total cover (median ± interquartiles) found in each site (A- site A; B- Site B; C- site C; D-all sites together) and habitat; values with the same letter are not significantly different from each other (p<0.05). 77
S3- Fig 3.3 Richness (median ± interquartiles) of plants found in each site (A- site A; B-
Site B; C- site C; D-all sites together) and habitat; values with the same letter
are not significantly different from each other (p<0.05). 77
S3 -Table 3.1 Taxonomic (specie and sub-family), functional group, abundance (N) and
relative percentage (%) of Formicidae caught during the study period 78
S3- Table 3.2 Abundance (N), richness (S) and relative percentage (%) of functional
group of Formicidae found in each site and in all sites 79
S3-Table 3.3 Taxonomic (specie and sub-family), abundance (N) and relative percentage (%) of predators belonging to Coleoptera caught during the study
xxiv
S3-Table 3.4 Species of Araneae identified in all sites, during the study period 81 S3-Table 3.5 Abundance (N), richness (S) and relative percentage (%) of functional
groups of Araneae found in sites A, B and C and in all sites together (Total) 82
S3-Table 3.6 Species of plants most frequently observed with average frequency under
brackets (n= sampling stations), total number (N) of species and families identified and families with higher number of species identified in each habitat and site (in bold, the most frequent species in each habitat)
83
S3-Table 3.7 Total frequency of observations (F), relative percentage of frequencies (%)
and richness (S) of plant species found, per family, in all sites. 84
S4 - Table 4.1- Characteristics of vineyards assessed 115
S4 - Table 4.2 Landscape analysis of the sampling points 117
S4 - Table 4.3 Number of treatments performed in each vineyard, score calculated
according to Thompson and Hoffmann (2006), and reference to the active ingredients applied with medium or high toxicity reported on bibliography (risk 2-medium; risk 3- high)
118
S4 - Table 4.4 Parasitism rates and parasitoid taxa identified in each sampling point, by
1
Chapter 1
General Introduction
3 1.1 General introduction
The grapevine moth, Lobesia botrana (Denis & Schiffermüller, 1775) (Lepidoptera: Tortricidae) is among the most economically important insect pests in Europe and has recently been found in vineyards in Chile, California and Argentina (Varela et al. 2010). It is a multivoltine species with two to five annual generations (Ioriatti et al. 2011). The larvae of the first-generation feed on flower bunches while the next generations feed on ripening and ripe berries. Fungi, especially grey mold Botrytis cinerea, develop rapidly on the damaged grapes, causing entire clusters to rot (Tasin et al. 2005).
At the Douro Demarcated Region (DDR), an important winegrowing area (43,670 hectares) located in the Northeast of Portugal, where “Port” D.O.C. wine and other remarkably high-quality table wines are produced, this pest is feared by growers mostly for its impact on quality, while damages are highly variable amongst years, ranging from 0 to 90% of infested clusters at harvest (Carlos et al. 2014). As a result, it has received considerable attention by researchers attempting to develop effective control strategies against it.
Prediction of L. botrana flight activity during the growing season has been considered critical, to improve IPM tactics through better timing of sampling or control operations. The need to ensure effective and sound strategies to control this important pest requires the development of tools that can help to predict its development for initiating sampling programs or timing insecticide sprays, to increase their efficacy, and so reducing their number, as well as its environmental impact. Traditionally, the control of L. botrana relies primarily on the use of insect growth regulators (IGRs) or pyrethroid insecticides, once or twice a year, against the second and/or the third generation. This latest is particularly difficult to control, since larvae quickly penetrate ripening fruit. Because economic injury to grapes occurs when neonates feed on grape clusters, control measures applied, in particular, against the third generation, primarily target L. botrana eggs. Therefore, precise timing for spraying with ovicides (e.g. IGR’s), before hatching eggs, is particularly important to maximize their efficacy and avoid damages.
The increased regulation of pesticides in Europe, the concerns of the public about the environmental impacts of viticulture and the consumers demand of residue-free products has leaded to an increase, in the last decade, of environmentally safe pest management strategies, with emphasis on conservation biological control and mating disruption (MD) technique.
4
According to the Centre for the Research, Study, Protection, Co-ordination and Advancement of Mountain Viticulture (CERVIM), the DDR is the largest and most heterogeneous viticulture region of the world. Despite the intensification of the last thirty years, given the need to reduce operating costs and mitigate the harshness of the labor, the most representative and well-preserved part (about 10% of the total area), the 'Alto Douro Wine Region' (ADV), was classified in 2001 as UNESCO World Heritage Site, for its unique character as an 'evolved continuing cultural landscape'. A significant part of this area is still occupied by non-crop habitats (NCH) such as scrublands (20.4%) and woodlands (13.2%). In the area covered by vineyards (42.9%), a significant part is occupied by grassy/shrubby slopes and/or by dry stone walls (Andresen and Rebelo 2013).While most vineyards in the world are nowadays typically extreme monocultures, with little remaining native vegetation and a suite of introduced weeds, whose provision of ecosystem services is, as a result, at a low level, the DDR offer strong potential from this standpoint, due to the occurrence of a significant area of non-crop habitats.
The occurrence of non-crop habitats has several advantages from the biodiversity point of view, in particular, in conservation biological control, by providing important resources for natural enemies, such as refugia, overwintering habitat, nectar, pollen and alternate hosts or prey, supporting natural enemy populations in nearby crop fields, which can lead to increased levels of biological control of pests. These habitats have been reported to act as biodiversity reservoirs for plants, insects, birds and mammals (Bianchi et al. 2006).
According to Böller et al. (2004), a high potential for a species rich and natural green cover has been found in sloping vineyards, with small-scale terraces. The plant community found in terraced vineyards contains several perennial plant species of value in fostering beneficial predators and parasitoids and therefore these banks serve as an internal ecological infrastructure of the vineyard and face the grapevine at very short distance.
The characteristic landscape of DDR represents however some constraint for the successful application of pheromone based mating disruption (MD) technique, an innovative method of protection used against L. botrana, registered in Portugal since 2002 and applied in DDR since 2000. Nowadays, area in DDR under MD is estimated to be only 350 ha (0.8% of DDR vineyard area), due the difficulties on the adaptation of this method of protection to DDR
5
The proposed PhD thesis aims at contributing to the development of an environmentally sustainable pest management strategy to control main arthropod pests in Douro Demarcated Region vineyards, with emphasis on the grape berry moth, L. botrana.
The thesis is structured into six chapters, and each of them correspond to papers that have been submitted to international scientific journals with referees. These chapters focus on specific issues that are considered important to achieve the final goal of the thesis, which is to support the DDR wine production sector with useful tools for increasing its sustainability at both economic and environmental levels.
In addition to the introduction and conclusion, the chapters and the corresponding objectives are:
● Second chapter, to evaluate the diversity of arthropods, as well as the impact, on their communities, of neighboring non-crop habitat and vegetation of terraced vineyards;
● Third chapter, to identify the diversity of soil arthropods and evaluate the impact of neighborhood non-crop habitats as well as soil ground cover, on their community;
● Fourth chapter, to survey L. botrana parasitoids and evaluate their relative importance, according to the generation, and landscape / vineyard management determinants;
● Fifth chapter, to investigate the flight activity of L. botrana, by analyzing data on male catches in sex pheromone traps recorded over a 20-year period, and develop degree-day models for predicting flights occurrence;
● Sixth chapter, to investigate the effectiveness of the use of mating disruption against L. botrana, using wired pheromone dispensers and identify the main constraints to its successful application.
1.2 References
Andresen T, Rebelo J (2013) Assessment of the State of Conservation of the Property Alto Douro Wine Region - Evolutive and Living Cultural Landscape - Assessment Report. Porto: CIBIO UP/UTAD
Bianchi FJJA, Booij CJH, Tscharntke T (2006) Sustainable pest regulation in agricultural landscapes: a review on landscape composition, biodiversity and natural pest control. Proc R Soc Lond B Biol. Sci, 273, 1715–1727
6
Böller EF, Häni F, Poehling HM (eds.) (2004) Ecological infrastructures: Ideabook on functional biodiversity at the farm level. Temperate zones of Europe. Swiss Centre for Agricultural Extension and Rural Development, Switzerland, 212 pp
Carlos C, Gonçalves F, Sousa S, Nóbrega M, Manso J, Salvação J, Costa J, Gaspar C, Domingos J, Silva L, Fernandes D, Val M, Franco JC, Aranha J, Thistlewood H, Torres L (2014) Success of mating disruption against the European grapevine moth, Lobesia botrana (Den. & Schiff): a whole farm case-study in the Douro Wine Region. IOBC-WPRS Bull 105: 93-102
Ioriatti C, Anfora G, Tasin M, De Cristofaro A, Witzgall P, Lucchi A (2011) Chemical ecology and management of Lobesia botrana (Lepidoptera: Tortricidae). J Econ Entomol 104(4): 1125-1137
Tasin M, Anfora G, Ioriatti C, Carlin S, de Cristofaro A, Schmidt S, Bengtsson M, Versini G, Witzgall P (2005) Antennal and behavioral responses of grapevine moth Lobesia botrana females to volatiles from grapevine. J Chem Ecol 31(1): 77-87
Varela LG, Smith RJ, Cooper ML, Hoenisch RW (2010) European grapevine moth, Lobesia botrana, in Napa Valley vineyards. Practical Winery & Vineyard. March/April:1–5
7
Chapter 2
Can woodlands, scrublands and vegetation of terraced
vineyards in Douro Demarcated Region enhance
functional biodiversity of arthropods?
Part of the content of this chapter was presented/ published in:
Carlos C, Afonso S, Crespí A, Aranha J, Thistlewood H, Torres L (2012) Biodiversity of plants and arthropods in key ecological structures of vineyards of the Alto Douro region. IOBC-WPRS Bulletin, 75: 51-55. ISBN: 978-92-9067-252-4
Carlos C, Val C, Rataux A, Aranha J, Crespí A, Marques G, Torres L (2011) Does the landscape of Douro Wine Region affect the complex of antagonists of the grape berry moth? Proceedings 18th IaleUK Conference “Landscape ecology and ecosystem services”, Wolverhampton University, Telford Campus, England. 6th-8th Sept. 2011. 71
9 Abstract
A study was held in Douro Demarcated Region (Northeast of Portugal) vineyards with the aim of evaluating the diversity of arthropods, as well as the impact, on their communities, of neighboring non-crop habitats (NHC) and vegetation of terraced vineyards. Arthropods were sampled three times during 2010 in three wine farms using a D-Vacuum machine (D-VAc) and yellow sticky traps, both in NCH, and inside vineyards (vine canopies, slopes or horizontal alleys), at three distances from the edge (5, 25 and 50 m). A total of 6,923 arthropods was caught with the D-Vac, mainly from Hemiptera (39.7%), Hymenoptera (21.7%), Araneae (12.9%) and Coleoptera (9.0%). Concerning to yellow sticky traps, 29.255 individuals were caught, mainly from Hemiptera (68.3%), Hymenoptera (24.2%) and Coleoptera (5.8%). Although a higher abundance and richness of several beneficial groups was found in NCH (i.e. Coccinellidae, Araneae and parasitoids), the positive impact of NHC on vineyards located on their proximity was only found for the Coccinellidae. On the other hand, vegetation present in slopes or on horizontal alleys have benefited particularly Araneae and parasitoids, although in the case of Mymaridae it was found that their abundance was also related with the abundance of Cicadellidae, their main host.
Our results highlight the importance of maintaining NCH on the neighborhood of vineyards, to enhance functional biodiversity of this agroecosystem. Also, important from this point of view, seems to be the slopes, that despite being a cultivated habitat, are subjected to a low intensity management. These findings emphasize the importance of maintaining both areas, NCH and slopes with vegetation, in such vineyards, for supporting functional diversity and assist in conservation biological control strategies.
Keywords: Predators, Parasitoids, ecosystem services, non-crop habitats, functional agrobiodiversity
11 2.1 Introduction
The 'Douro Demarcated Region' (DDR), where “Port” D.O.C. wine and others remarkably high-quality table wines are produced, covers an area of approximately 250,000 ha, of which 43,600 ha are planted with vines. It is characterized by many deep valleys and steep slopes along the Douro River and its tributaries, with schists soils, cold winters, hot summers and low rainfall. Despite the intensification practiced during the last thirty years, given the need to reduce operating costs and mitigate the harshness of the labor, the most representative and well-preserved part (about 10% of the total area), the “Alto Douro Vinhateiro” (ADV), was classified in 2001 as UNESCO World Heritage Site, for its unique character as an 'evolved continuing cultural landscape'. A significant part of this area is still occupied by non-crop habitats, specially by scrublands (20.4%) and woodlands (13.2%). Moreover, in the area covered by terraced vineyards (42.9%), a significant part is occupied by grassy/shrubby slopes and/or dry-stone walls (Andresen and Rebelo 2013).
The simplification of cultivated landscapes is particularly acute in wine grape regions as the geographic branding wine further encourages regional land use conversion from natural habitats to high-value grape production. The loss of both agrobiodiversity and natural habitats that surround agroecosystems can lead to the loss of multiple ecosystem services, including biological control (Miles et al. 2012), that was estimated worldwide, in 1997, in approximately US$410 billion per year (Costanza et al. 1997). Thus, populations of arthropod pests may proliferate in vineyards, due to lack of habitat and/or food resources required for enhancing the impact of their natural enemies.
Because of the increased regulation of pesticides in Europe and the concerns about the environmental impacts of viticulture, research about ecological-based pest management strategies, has attracted increasing interest in recent decades in particular about those aimed at promoting conservation biological control of pests (e.g. Thomson and Hoffmann, 2009 and references therein). However, and while it is known that the improvement of wild plant diversity in vineyards may sustain higher landscape biodiversity, providing refuge and food source for several vertebrates and arthropods, including those that are beneficial for pest control (Sanguankeo and León, 2011), to our knowledge little research has been done on how vineyard management, as well as adjacent semi-natural habitats, affects different arthropod´s
12
communities. In particular, few studies have been conducted about the significance, from this point of view, of terraced vineyard.
Considering the need of preserving non-crop habitats existing in DDR, and the increasing interest of local farmers for conservation biological control strategies, this study aimed at evaluating the impact of NCH adjacent to vineyards, as well as of the vegetation of terraced vineyards on the overall biodiversity of arthropods, particularly on natural enemies (predators and parasitoids) and on main pest of DDR vineyards ecosystem. Therefore, we hypothesize that the presence of NCH and vegetation of terraced vineyards have a positive impact on arthropods diversity, including on natural enemies of pests in the context of increasing functional biodiversity of the agroecosystem.
2.2Material and methods
2.2.1 Study sites
The study was carried out in 2010 in three terraced vineyard agroecosystems, located in the DDR. They were chosen because they had, in their neighborhood, woodland and/or scrubland lots, thereafter designated non-crop habitats (NCH). The corresponding agroecosystem (vineyard of c.v. Touriga Nacional plus neighborhood non-crop habitats) will be thereafter referred as sites A, B and C, located respectively at quinta das Carvalhas (S. João Pesqueira county), quinta de S. Luiz (Tabuaço county) and Quinta do Seixo (Tabuaço county). At site A (41º10’47’’N, 7º32’09’’W) the vineyard was 8-years old, was set on one row terraces and North East faced. It was bordered by a Mediterranean woodland of the type Rusco aculeati Querceto suberis viburnetosum tini (NCH1); moreover, there were also a slope (NCH2) mainly covered with shrubs and herbaceous species and a second slope (NCH3) mainly covered by shrubs, herbaceous vegetation and some dispersed trees (Fig. 2.1).
13
Figure 2.1 General characteristics of site A agroecosystem (NCH- Non-crop habitats; SV-Slope vegetation; V- Vineyard).
At site B (41º09’08’’N, 7º37’04’’W) the vineyard was 11-years old, was set on one row terraces and West faced. It was bordered by NCH characterized by the combination of a Mediterranean scrubland of the type Erico arboreae arbutetum unedonis viburnetosum tini and by an herbaceous border just located near the vineyard edge. Inside vineyard, some dispersed shrubs were left on slopes.
At site C (41º10’15’’N, 7º33’05’’W) the vineyard was 10-years old, was set on two row terraces and East faced. It was bordered by NCH which formerly was a cropped area (vineyard and olive production until 1980), being occupied mainly by scrubland dominated by Rubus ulmifolius, combined with an herbaceous cover.
All vineyards were conducted under Integrated Production Guidelines. Weeds under vines were controlled through one application of herbicide at the end of winter (glyphosate plus oxyfluorfen). The vegetation of slopes and ground cover between vines was mowed twice mechanically, first in March and later in June/July.
Landscape composition around each site was calculated within a GIS framework, with a 200-m radius, resulting in different proportions of land use categories. The elements woodland / forest, scrubland / shrubby slopes, riparian gallery, water elements and orchards and vegetable gardens, when conducted extensively, were considered as part of ecological infrastructures (EI).
14 2.2.2 Flora and arthropods assessments
Plant and arthropod communities were assessed in both non-cropped and vineyards habitats in three replicate sampling stations, each separated by a minimum of 50 m. In vineyards, assessments of arthropods were done in vine canopies, as well as in the ground cover of the slopes (sites A and B) or in the horizontal alleys (site C), at 5, 25 and 50 m from NCH. Vineyards flora was assessed in the ground cover of the slopes (sites A and B) or in the horizontal alleys (site C), at the same distances.
The number of sampling stations assessed by site varied between 21, at sites B and C (3 in NCH plus 18 in vineyards habitats) and 27, at site A (9 in NCH plus 18 in vineyards habitats). This means that, in total, 69 sampling points were assessed on the three sites. Each habitat assessed will be designated: non-crop habitat (NCH), slope vegetation (SV), ground cover vegetation (GC) and vines (V).
Vegetation was assessed twice, in late May and in early September, using the phytostructural method (Crespí et al. 2005). However, as assessments of arthropods were done during summer period, only the later was considered for further analysis. In each sampling station and site, all vascular plant species were inventoried in a surface of 4 m2. Moreover, the percentage of herbaceous cover, fresh cover, and total cover (fresh plus dry) was recorded.
Arthropods were accessed through two sampling methods: by suction and with yellow sticky traps. According to Yi et al. (2012), the combination of different methods is highly recommended for comprehensively sampling of larger taxa, where different species often vary strongly in their behavior and ecological niche.
For suction sampling, a Dietrick Vacuum insect net (D-Vac) machine (Rincon-Vitova Insectaries, Inc., Ventura, CA, US, model 122) was used during one minute along a transect of 20 m; the procedure was repeated at each sampling station. At sites A and B, as the access to slopes was easier, suction sampling was performed on slopes; at site C, since vineyards were installed in two rows, suction was performed only on vegetation present in the horizontal alley. Arthropods caught were conserved in identified recipients containing diethyl ether and conducted to laboratory for identification. Samplings were repeated three times from July to September (July 28th, August 26th and September 28th).
Yellow sticky traps consisted in a 20.0 cm x 24.5 cm plastic rectangle with sticky surface, which were vertically hanged in trees, shrubs or vineyards, according the sampling point, 1.30
15
m above the ground, during a week period. This procedure was performed three times, between June and August (June 24th, July 21st and August 26th).
Under a stereoscopic microscope, all collected arthropods were sorted to the morphospecies level and identified at the taxonomic level of order or family level, based on literature (Triplehorn and Johnson 2005). Main morphospecies caught were later identified by taxonomists. Each taxon was further classified into functional trophic groups (predators, parasitoids, herbivores, omnivores, detritivores, or pollen/nectar feeders). Because spiders are one of the most abundant predators in vineyards (Costello and Daane 1999) and due to their close relationship to their habitats, those collected by suction sampling were studied in great depth since individuals caught in yellow sticky traps were too damaged to allow their identification. Thus, Araneae was classified in eight guilds, following Cardoso et al. (2011) based on their foraging strategy (type of web and hunting method), prey range (stenophagous or euryphagous), vertical stratification (ground or foliage) and circadian activity (diurnal or nocturnal) in: (1) sensing web weavers, (2) sheet web weavers, (3) space web weavers, (4) orb web weavers; (5) specialists; (6) ambush, (7) ground hunters, and (8) other hunters.
2.2.3 Data analysis
To compare differences in vegetation cover among habitats within each site, the richness of plants and the percentage of herbaceous cover, fresh cover and total cover (fresh plus dry), was analyzed by a nonparametric Kruskal–Wallis test, followed by the multiple comparison mean ranks by Fisher’s LSD, as described by Marôco (2011).
Abundance (N) and richness (S) of arthropods found in each habitat were calculated. In a first step, Generalized Linear Models (GzLM) were used to test for differences in abundance and richness of arthropods between farms, sampling dates and habitats. To uniform data, for this analysis, woodland slope (NCH2) and road slope (NCH3) habitats from site A were not included. Due to the geographical differences and different habitats accessed in each site, the analysis of the impact of non-crop habitats on the abundance and richness of arthropods was performed individually in each farm.
Separated models were applied to each sampling methods (suction and yellow sticky traps) for total arthropods, main functional groups (predators, parasitoids and herbivores), for each functional group, main orders, families or species. Dependent variables were analyzed
16
fitting a Normal, Poisson or Negative Binomial error, according with their distribution. In some cases, data was log-transformed to achieve normality. Pairwise comparison of estimated marginal means was used to estimate significant differences between modalities and a least significant difference test was used to separate them. Data of arthropods found in vineyard canopy at the harvest time was also analyzed through GzLM.
Spearman rank correlations were used to determine the significance of relationship between abundance and richness of arthropods (both trophic groups and taxonomic taxa) and the vegetation parameters (percentage of herbaceous cover, total cover and richness). As vegetation data was related to one sampling performed in September, for this analysis, total data of arthropods collected were pooled for each sampling point. All correlations were carried out as pairwise two-side tests.
To investigate to which extent Araneae move from NCH to the interior of vineyards, similarity between modalities in that assemblages collected by suction was analyzed. For each habitat, data collected by sampling point and sampling date were pooled to form one unique sample per habitat and farm. Similarity was calculated in Estimate S (version 9.1.0) (Colwell 2013) and using Chao Jaccard abundance-based estimator, an index that reduce bias, due to sample size and include the effect of unseen shared species (Chao et al. 2005). Then, a Multidimensional scaling (MDS)was performed using Proxscal algorithm. To perform MDS, a preliminary 22-dimensional analysis was run and then repeated using three dimensions, as suggested by the analysis of the scree plot and the plots transformed proximities vs distances from preliminary analysis (Marôco 2011). The goodness of fit was evaluated through STRESS-I and DAF (Dispersion Accounted For) using the reference values defined by Marôco (2011). DAF is equivalent to R2 and is the amount of variance which is explained by the three dimensions. The models, correlations and MDS were fitted using IBM SPSS version 20.0 (Armonk, NY: IBM Corp.). Significance was reported at the level of p < 0.05. Means and standard errors are shown in text, tables and/or figures.
17 2.3Results
2.3.1 Flora
At site A, 59 species were identified belonging to 29 families. The most frequent families were: Asteraceae (32.3%), Rosaceae (6.5%), Ericaceae (5.9%) and Poaceae (5.9%). At site B, 36 plant species were identified, belonging to 24 families. The more frequent families were: Asteraceae (39.5%), Apiaceae (13.2%) and Fabaceae (9.3%). At site C, 24 species were identified, belonging to 14 families. The most frequent families were Asteraceae (45.1%), Poaceae (17.6%) and Apiaceae (14.7%) (Table 2.1).
The only site in which significant differences were found between vegetation parameters was site A, where vegetation richness was significantly higher in NCH than in vineyard slopes (χ2KW = 20.32, p=0.009 for richness of plants). The same trend was found, generally, for the percentage of herbaceous cover (χ2KW = 16.91, p=0.031), for the percentage of fresh cover (χ2KW = 18.96; p=0.015 and for the percentage of total cover (χ2KW = 20.75; p=0.008) (S 2 – Table 2.1).
18
Table 2.1 Plant species most frequently found in each studied site and habitat (average percentage of
frequency at each sampling station, n = 3).
Site Habitat Species most frequently observed
A
NCH1 Arbutus unedo, Ruscus aculeatus (1.0); Asplenium onopteris, Crataegus monogyna, Erica arborea, Quercus x
coutinhoi, Hedera hibernica, Rubus ulmifolius, Teucrium scorodonia (0.7)
NCH2 Cistus salvifolius, Erica arborea (1.0); Andryala integrifolia, Arbutus unedo, Cytisus striatus, Rubus ulmifolius (0.7)
NCH3 Cytisus striatus, Eschscholzia californica (1.0); Cistus salvifolius, Holcus lanatus (0.7) SV 5 Hedera hibernica, Pistacia terebinthus, Sedum album, Umbilicus rupestris (0.5)
V 5 Hypochoeris radicata, Polygonum aviculare (1.0); Dittrichia viscosa (0.7) SV 25 Galium mollugo, Ortegia hispanica (0.7)
V 25 Chondrilla juncea, Conyza sumatrensis, Hypochoeris radicata (0.7)
SV 50 Dittrichia graveolens (1.0); Conyza arvensis, Conyza sp., Hypochoeris radicata, Polygonum aviculare (0.7) V 50 Andryala integrifolia, Conyza arvensis, Hypochoeris radicata, Dittrichia graveolens (1.0)
B
NCH Rubus ulmifoliusaculeatus (0.7) (1.0); Arbutus unedo, B. dioica, M. ciliata, Phillyrea angustifolia, Quercus rotundifolia, Ruscus
V 5 Chondrilla juncea, Conyza sumatrensis,Cynodon dactylon, Daucus carota (0.7) SV 5 Daucus carota (1.0); Andryala integrifolia, Lactuca virosa (0.7)
V 25 Daucus carota (1.0); Conyza sumatrensis, Hypochoeris radicata, Lactuca virosa (0.7)
SV 25 Andryala integrifolia, Bituminaria bituminosa (1.0); Daucus carota (0.7) V 50 Conyza sumatrensis (1.0); Lactuca virosa (0.7)
SV 50 Andryala integrifolia, Bituminaria bituminosa (1.0); Chondrilla juncea, Daucus carota (0.7)
C
NCH Ailanthus altissima, Rubus ulmifolius, Conyza sumatrensis, Daucus carota, Salix atrocinerea, Vitis vinifera (0.7) V 5 Conyza sumatrensis (1.0); Conyza bonariensis, Digitaria sanguinalis, Hypochoeris radicata, Lactuca virosa
(0.7)
GC 5 Daucus carota (1.0); Andryala integrifolia, Conyza sumatrensis, Digitaria sanguinalis, Lactuca virosa (0.7)
V 25 Conyza sumatrensis, Daucus carota (1.0); Conyza bonariensis, Lactuca virosa (0.7)
GC 25 Daucus carota (1.0); Andryala integrifolia, Bituminaria bituminosa, Conyza sp., Digitaria sanguinalis,
Hypochoeris radicata (0.7)
V 5 Conyza bonariensis, Conyza sumatrensis, Daucus carota, Digitaria sanguinalis (0.7)
GC 50 Bituminaria bituminosa, Daucus carota (0.7)
Habitats: NCH- Non-crop habitat; V- vineyard; SV- slope vegetation; GC-Ground cover in the horizontal alley. 5, 25 and 50 indicates the distances (m) from the NCH
2.3.2 Arthropods
Suction sampling
Across all sites, 6,923 arthropods were collected. These were represented by Insecta (83.7%), Arachnida (16.3%) and Malacostraca (0.01%). The main taxon caught were, by decreasing order of abundance: Hemiptera (39.7%), Hymenoptera (21.7%), Araneae (12.9%), Coleoptera (9.0%), Diptera (8.3%), Acari (3.4%) and Thysanoptera (3.0%). Hemiptera were