2015
UNIVERSIDADE DE LISBOA
FACULDADE DE CIÊNCIAS
DEPARTAMENTO DE BIOLOGIA ANIMAL
Trace Elements Quantification in Beers Consumed in
Portugal: arsenic, lead, cobalt, copper, iron and zinc
Mestrado em Biologia Humana e Ambiente
Tiago José Monteiro
Dissertação orientada por:
Professora Doutora Maria Luísa Mateus
i
Resumo
As bebidas alcoólicas incluindo a cerveja começaram a ser produzidas praticamente desde o início da agricultura há mais de 10 000 anos na região do Crescente Fértil. Egipto, Mesopetânia e Babilónia foram as populações que mais impulsionaram o fabrico e consumo de cerveja tendo passado o conhecimento para os Gregos que por sua vez o transmitiram aos Romanos. Estes últimos através das suas conquistas ao longo da expansão do seu Império acabaram por levar a cerveja por quase toda a Europa. Desde a Idade Média, passando pela Idade Moderna até aos dias de hoje foram desenvolvidos mais processos no fabrico de cerveja, novos ingredientes foram sendo adicionados e novas tecnologias revolucionaram o mundo da cerveja. Actualmente a cerveja é uma das bebidas mais consumidas em todo o mundo.
No fabrico da cerveja são utilizadas várias matérias-primas como água, sementes, leveduras e lúpulo. A composição final da cerveja depende em grande parte do produto pretendido e como tal das matérias-primas envolvidas. Há dois tipos de cerveja, lager e ale, em que a principal diferença ocorre no passo da fermentação em que leveduras da estirpe Saccharomyces pastorianus são usadas para obter as cervejas do tipo lager e leveduras da estirpe Saccharomyces cerevisiae para as cervejas do tipo ale. As cervejas do tipo lager são as mais produzidas correspondendo a uma produção de 90% da cerveja mundial.
Tendo em conta o seu grande consumo a nível mundial não é de admirar que a cerveja tenha um impacto determinante ao nível da economia, especialmente ao nível da indústria e da restauração devido aos postos de trabalho que directa ou indirectamente daí advêm.
Contudo com o aumento do consumo de cerveja vem também a preocupação com o impacto que esse elevado consumo possa ter no consumidor devido à exposição a contaminantes que podem ser prejudiciais à sua saúde. Em termos de contaminantes os metais são os que mais se destacam pois acima de determinadas concentrações podem provocar efeitos tóxicos para o ser humano. Os metais são constituintes naturais da crosta terrestre e encontram-se amplamente distribuídos na natureza e, como tal, podem entrar na constituição da cerveja em qualquer etada do seu fabrico. De facto os metais podem estar presentes nas próprias matérias-primas necessárias à produção da cerveja, seja por ocorrência natural ou pela actividade antropogénica (uso de pesticidas e fertilizantes, emissões provenientes do tráfico automóvel e indústrias). O próprio equipamento utilizado na produção de cerveja também pode
ii ser uma fonte de contaminação bem como os recipientes em que a cerveja é armazenada e transportada.
Tal como se verifica com vários alimentos, também há legislação própria para as cervejas, que em Portugal é estabelecida pela Portaria nº 1/96 de 3 de Janeiro. Esta Portaria regula vários parâmetros que influenciam a qualidade da cerveja como cor, cheiro, sabor, pH, acidez total, conteúdo alcoólico, entre outros. Para além disso também regula a presença de metais nesta bebida estabelecendo concentrações maximas para arsénio (0.1 mg/L), chumbo (0.2 mg/L), cobalto (0.05 mg/L) cobre (0.2 mg/L), ferro (0.3 mg/L) e zinco (1 mg/L).
Assim este estudo tem como objectivo determinar se esses limites são respeitados em diferentes marcas de cerveja comercializadas em Portugal. As amostras foram seleccionadas e recolhidas pela Autoridade de Segurança Alimentar e Económica (ASAE) de entre as marcas nacionais mais consumidas no mercado português.
Para a determinação dos metais seleccionados para o estudo recorreu-se a duas metodologias que foram desenvolvidas e optimizadas num estudo previamente realizado no Laboratório de Métodos Instrumentais de Análise da Faculdade de Farmácia da Universidade de Lisboa, onde também este estudo foi realizado. Assim, para analisar a presença de metais como chumbo, cobalto, cobre, e o ferro utilizou-se a Espectrofotometria de Absorção Atómica com Câmara de Grafite (GFAAS) e para o arsénio a Espectrofotometria de Absorção Atómica com Geração de Hidretos (HGAAS). Antes da análise as amostras de cerveja foram sujeitas a uma digestão pressurizada por microondas.
No presente estudo foi possível concluir que as amostras de cervejas seleccionadas pela ASAE apresentavam quantidades inferiores aos limites estabelecidos pela legislação Portuguesa no que respeita aos metais analisados. Assim, a presença dos referidos metais nas cervejas analisadas não constitui perigo para o consumidor.
iii
Abstract
Alcoholic beverages including beer began to be produced shortly after the onset of agriculture. Since then beer consumption has increased over the centuries and nowadays beer is one of the most consumed beverages in the world. Due to its high consumption, all studies conducted in order to assess and control the quality of this drink are of great importance not only to brewers but also to consumers. Since beer is obtained through the use of various raw materials and because of their dependence on variables introduced in the several steps involved in the brewing process, a wide variety of analysis can be performed for testing the quality of the different commercialized types of beers. Metals contained in both types of beers, lager and
ale, may come from different sources such as natural ones like water, soil, cereal,
and yeast, as well as environmental contamination with the use of fertilizers and pesticides. Brewing equipment itself and the different substances added during the brewing process to control fermentation and maturation processes are also sources of metal contamination in beers.
This study aims to evaluate the presence of metals referenced by the Portuguese legislation (Portaria nº 1/96 from 3rd January) in order to verify if their contents are according with established reference values. The elements specified in the aforementioned law are arsenic, cobalt, copper, iron, lead, and zinc, and their quantification is the focus of this study. A preliminary study was conducted in Laboratory of Instrumental Methods of Analysis, where under optimized conditions validation parameters were obtained for all target elements.
Analyzed samples were selected and collected in the Portuguese market by the Portuguese Food and Economic Safety Authority (ASAE), Department of Food Risks and Laboratories. Quantification of elements specified in the aforementioned law in beers was performed by Atomic Absorption Spectrometry (AAS) techniques after Microwave Pressure Digestion. Hydride Generation Atomic Absorption Spectrometry (HGAAS) was selected for arsenic analysis while Graphite Furnace Atomic Absorption Spectrometry (GFAAS) was selected for cobalt, copper, iron, and lead.
Analyzed samples previously selected by ASAE, using Portuguese consumers’ most preferred beer brands, presented metal content below the maximum threshold allowed by the Portuguese legislation for all analyzed metals. Therefore, the presence of the analyzed metals in selected beers presents no danger to the consumers.
iv
Acknowledgements
First of all I want to show my gratitude for Doctor Professor Maria Luísa Mateus for allowing to work at her Laboratory and collaborate in this project and for helping me in every step of the way. Thank you for always defending my best interests and for giving me a lot of freedom in my work.
I also want to thank Doctor Professor Deodália Dias for all her support in this thesis and for her friendly advices.
I would like to express my gratitude to all people who helped in this study because without them it would have been more difficult. To Doctors Eduarda Mendes and Vandra Andrade for the GFAAS and HGAAS protocols. To Engineers Barata and Ramalho from I.L.C. (Instrumentos de Laboratório e Científicos, Lda) for their teachings in how to operate microwave pressure digestion device and about GFAAS and HGAAS troubleshooting, respectively.
To my friends I refer my gratitude for supporting me during this important phase of my life. I would like to leave a special thanks to Ana, Cátia, Laura, and Rita for their friendship and for being there when I most needed them.
Finally to my parents for their help and support and for always believing in me and for the encouragement.
v
List of Abbreviations
ASAE – Autoridade de Segurança Alimentar e Económica ASS – Atomic Absorption Spectrometry
ANOVA – Analysis of Variance CRM – Certified Reference Material D.L. – Detection Limit
DMT-1 – Divalent Metal Transporter Protein EDLs – Electrodeless Discharge Lamps EU – European Union
FAAS – Flame Atomic Absorption Spectrometry
GFAAS – Graphite Furnace Atomic Absorption Spectrometry HCLs – Hollow Cathode Lamps
HCP1 – Heme Carrier Protein-1
HGAAS – Hydride Generation Atomic Absorption Spectrometry ICP-AES – Inductively Couple Plasma Atomic Emission Spectrometry ICP-MS – Inductively Couple Plasma Mass Spectrometry
NaBH4 – Sodium tetrahydroborate Q.L. – Quantification Limit
vi
Table of Contents
Resumo ... i Abstract ... iii Acknowledgements ... iv List of Abbreviations ... v Table of Contents ... vi List of Tables ... ix List of Figures ... xiList of Graphics ... xii
1. Introduction ... 1 1.1. Beer ... 1 1.1.1. History ... 1 1.1.2. Raw materials ... 2 1.1.3. Beer types ... 3 1.1.4. Brewing process ... 4 1.1.5. Beer composition ... 8
1.1.6. Beer consumption, production and its impact ... 9
1.1.7. Metal contaminants ... 12
1.1.8. Legislation ... 12
1.2. Metals referred in legislation ... 13
1.2.1. Arsenic ... 13 1.2.2. Cobalt ... 15 1.2.3. Copper ... 16 1.2.4. Iron ... 18 1.2.5. Lead ... 20 1.2.6. Zinc ... 21 1.3. Digestion methods ... 22 1.3.1. Dry-ash digestion ... 23 1.3.2. Wet digestion ... 23
1.3.3. Microwave pressure digestion ... 24
1.4. Trace elements quantification ... 25
1.4.1. Radiation sources for Atomic Absorption... 28
1.4.2. Graphite Furnace Atomic Absorption Spectrometry (GFAAS) ... 29
1.4.2.1. Interferences ... 30
1.4.2.2. Advantages and disadvantages ... 31
1.4.3. Hydride Generation Atomic Absorption Spectrometry (HGAAS) ... 31
1.4.3.1. Interferences ... 32
vii
2. Objectives ... 34
3. Materials and Methodologies ... 35
3.1. Samples ... 35
3.2. Reagents and standard solutions ... 35
3.3. Materials and equipment ... 36
3.4. Sample preparation ... 36
3.5. Digestion method ... 37
3.6. Trace elements quantification ... 39
3.6.1. Graphite furnace Atomic Absorption Spectrometry (GFAAS) ... 39
3.6.2. Hydride Generation Atomic Absorption Spectrometry (HGAAS) ... 40
3.7. Method validation ... 41 3.7.1. Indirect evaluation ... 42 3.7.1.1. Selectivity/specificity ... 42 3.7.1.2. Linearity ... 43 3.7.1.3. Analytical thresholds ... 43 3.7.1.4. Precision ... 44 3.7.2. Direct evaluation ... 45 3.8. Statistical analysis ... 45
4. Results and Discussion ... 46
4.1. Validation ... 46 4.1.1. Linearity ... 47 4.1.2. Analytical thresholds ... 52 4.1.3. Intermediate precision ... 52 4.1.4. Pool ... 53 4.1.5. Accuracy ... 54
4.1.6. Microwave pressure digestion validation ... 55
4.2. Trace element quantification ... 56
4.2.1. Copper and iron content comparison ... 60
4.2.2. Packaging influence on metal content in beer ... 60
4.3. Questionnaire ... 62
5. Conclusions ... 65
6. References ... 68
7. Appendices ... 74
7.1. Appendix A ... 74
7.1.1. Safety of Microwave digestion system Speedwave Two ... 74
7.1.2. TFMTM-PTFE (digestion vessels material) characteristics ... 74
7.1.3. Speedwave Two – Technical specifications ... 75
viii
7.2.1. Working range ... 76
7.2.2. GFAAS and HGAAS intermediate precision ... 77
7.2.3. GFAAS and HGAAS repeatability ... 78
7.3. Appendix C ... 79
7.3.1. Snedecor/Fisher distribution F with 95% confidence ... 79
7.4. Appendix D ... 80
7.4.1. Quantification results (μg/L) ... 80
7.5. Appendix E ... 81
ix
List of Tables
Table 1 – Total beer consumption per capita between 2008 and 2013 (in 1000 hl) in
EU (adapted from The Brewers of Europe, 2014). ... 9
Table 2 - Basic characteristics of beer market in Portugal between 2008 and 2012 (adapted from The Brewers of Europe, 2013). ... 12
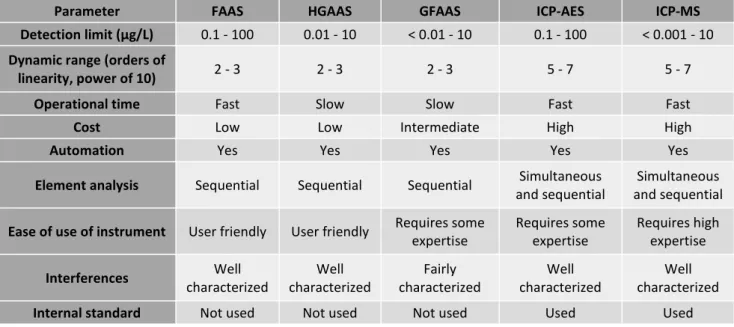
Table 3 - Technical parameters of Atomic Spectrometry techniques commonly used in trace elements quantification (adapted from Bolann et al., 2007). ... 27
Table 4 - Methods used in the analysis of the elements targeted in this study. + - technique used in some biological material; ++ - technique used; +++ - technique most commonly used (adapted from Bolann et al., 2007). ... 27
Table 5 - Description of the analyzed samples. ... 35
Table 6 - Reagents used in sample analysis. ... 35
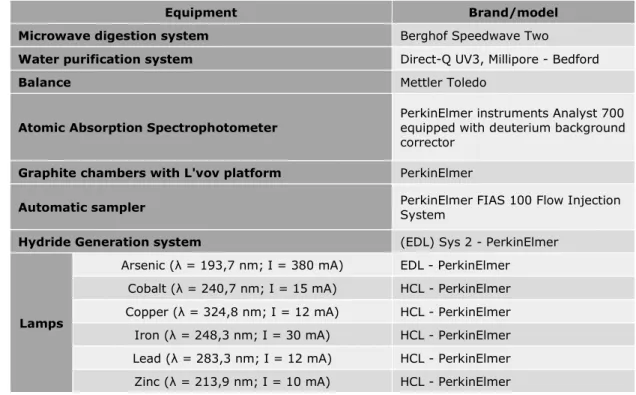
Table 7 - Used equipment. ... 36
Table 8 - Beer digestion program. ... 38
Table 9 - Analysis parameters of metals by GFAAS. ... 39
Table 10 - Matrix modifiers utilized in metals analysis by GFAAS. ... 40
Table 11 - Equations of arsenic linear and nonlinear calibration curves and statistical data for linearity assessment. ... 47
Table 12 - Equations of cobalt linear and nonlinear calibration curves and statistical data for linearity assessment. ... 48
Table 13 - Equations of copper linear and nonlinear calibration curves and statistical data for linearity assessment. ... 49
Table 14 - Equations of iron linear and nonlinear calibration curves and statistical data for linearity assessment. ... 50
Table 15 - Equations of lead linear and nonlinear calibration curves and statistical data for linearity assessment. ... 51
Table 16 - Analytical thresholds regarding analyzed metals. ... 52
Table 17 - Mean values (n=10) of intermediate precision for three different days and respective relative standard deviation percentage (RSD (%))... 53
Table 18 - Metal content comparison between different recipients from the same sample and respective pool (n=3). ... 54
Table 19 - CRM values, data obtained and Z-score. ... 55
Table 20 - Recovery rate (%) from the addition of cobalt, copper, iron, and lead standards. ... 55
Table 21 - Trace element quantification in beer samples contained in can package (n=3). ... 56
x
Table 22 - Trace element quantification in beer samples contained in glass package
(n=3). ... 56
Table 23 - Concentration of trace metals in beers of different country of origin. .. 59 Table 24 - Ten replica data from the standard of lower and higher concentration of
the calibration curve for each analyzed metal. ... 76
Table 25 - Mean values (n=10) of intermediate precision for three different days
and respective relative standard deviation percentage (RSD (%))... 77
Table 26 - Mean values (n=10) and respective relative standard deviation
xi
List of Figures
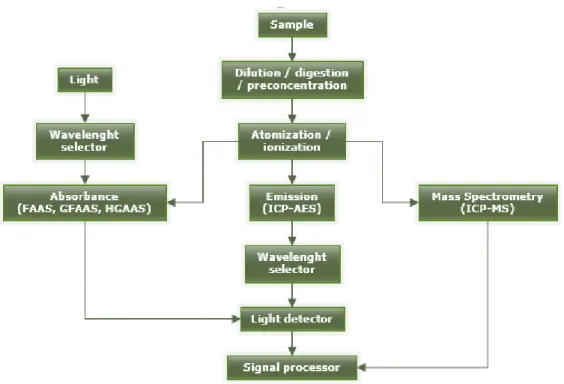
Figure 1 - General brewing process (adapted from Harrison, 2009). ... 5 Figure 2 - General diagram of Atomic Spectrometry techniques (adapted from
Bolann et al., 2007). ... 26
Figure 3 - Berghof Microwave Digestion System Speedwave Two (adapted from
Berghof, 2014b). ... 39
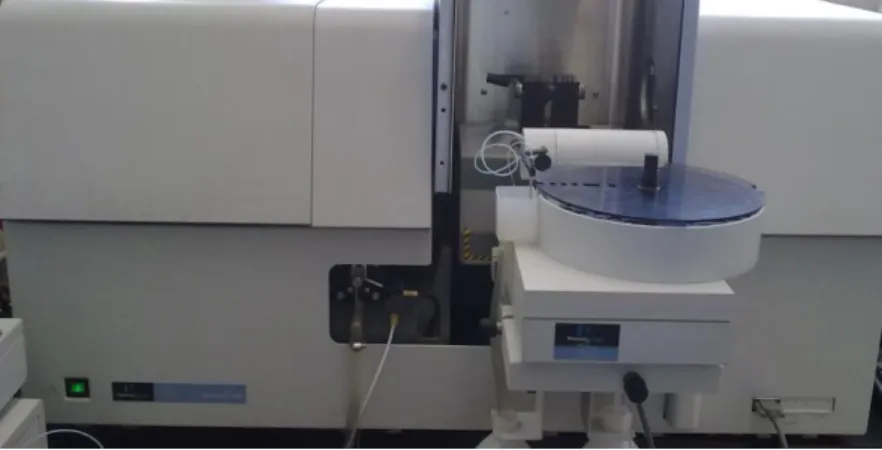
Figure 4 - Atomic Absorption Spectrometer, PerkinElmer Instruments AAnalyst 700.
... 40
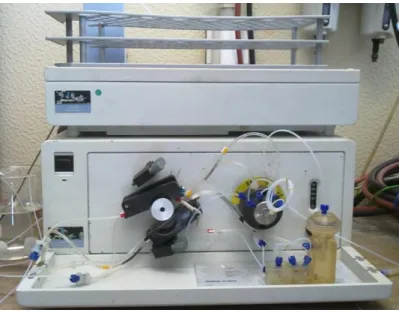
Figure 5 - Hydride Generation System, PerkinElmer FIAS 100 Flow Injection System.
xii
List of Graphics
Graphic 1 - EU purchases of goods and services by brewing sector in 2012 (adapted
from Brewers of Europe, 2013). ... 10
Graphic 2 - Indirect employment related to beer in the EU in 2012 (adapted from The Brewers of Europe, 2013). ... 10
Graphic 3 - Beer consumption in the hospitality sector, as a percentage of total beer consumption per EU Member State in 2012 (adapted from The Brewers of Europe, 2013). ... 11
Graphic 4 - Representative arsenic calibration curve. Data refers to average, n=2. ... 47
Graphic 5 - Representative cobalt calibration curve. Data refers to average, n=4. ... 48
Graphic 6 - Representative copper calibration curve. Data refers to average, n=7. ... 49
Graphic 7 - Representative iron calibration curve. Data refers to average, n=7. .. 50
Graphic 8 - Representative lead calibration curve. Data refers to average, n=4. . 51
Graphic 9 - Copper quantification in beer samples (n=3). ... 57
Graphic 10 - Iron quantification in beer samples (n=3). ... 58
Graphic 11 - Arsenic, cobalt, and lead quantification in beers (n=3). ... 58
Graphic 12 - Comparison between copper and iron content in beers. ... 60
Graphic 13 - Comparison between copper and iron content in beer samples from different recipient types within the same brands. ... 61
Graphic 14 - Beer consumption habits. ... 62
Graphic 15 - Frequency of beer consumption per month. ... 63
Graphic 16 - Higher quantity (in liters) of beer consumed in one day. ... 63
1
1. Introduction
1.1. Beer
1.1.1. History
Beer is the product of a yeast alcoholic fermentation of extracts of grains such as einkorn, wheat and barley, to which hops are added (Pohl, 2008). However its origin, temporally speaking, is not so easy to determine. Alcohol as a beverage is mentioned to have originated in prehistory, maybe in Paleolithic (Hornsey, 2003). Beer per se appears to have been first described by the Sumerians more than 5 000 years ago (Pavsler and Buiatti, 2009a). The practice of brewing may have happened for the first time by chance through the discovery of a spontaneous fermentation of a cereal (APCV, 2015a). Nevertheless it is most likely beer was first produced in the early beginnings of agriculture in the Fertile Crescent mainly because due to the availability and diversity of grain, fire control and suitable brewing vessels (Meussdoerffer, 2009).
The Egyptian civilization was one of the first to produce beer. Egyptians believed beer was a gift from one of their Gods, Osiris. Barley was the most used grain to produce this alcoholic beverage but each tribe had its mode of preparation (Hornsey, 2003). Generally to produce beer, grains were firstly germinated and milled and then transformed into dough which would be molded into breads. In turn this bread was slightly cooked and then crumbled into a container with water and left in there for a few days in order to ferment. After fermentation, the product was filtered and stored in appropriated containers (e.g. amphora) (APCV, 2015a). The barley beer of Egypt was called Zythos and was consumed by all strata of society without exception (Meussdoerffer, 2009).
Alongside with the Egyptians the Babylonians (descendants of the Sumerian civilization) also produced and consumed beer. Unlike the Egyptian civilization, however, Babylonians had several different types of beers resultant from diverse combinations of aromatic plants combined with honey, barley or wheat (APCV, 2015a).
Greece under Alexander the Great conquered Egypt in 331 BC and introduced wine to the Egyptian civilization. Soon wine was preferred by the upper classes and beer was the drink of the lower strata (Meussdoerffer, 2009).
The Romans learned the brewing process from the Greeks. However it was considered a despicable drink and typical of barbarians (APCV, 2015a). Due to a grain crisis viticulture was prohibited in land where cereals could be sown and consequently
2 the Roman legions acquired provisions of beer. This allowed for the practice of brewing to spread throughout Europe, with beer becoming a strong competitor to wine (Meussdoerffer, 2009).
During the Middle Ages the brewing process evolved, thus leading to the introduction of a mixture of herbs which acted as beer preservatives. This mixture was called gruyt (APCV, 2015a). In the late Middle Ages, in Britain, Flanders workers introduced hops, a plant with aromatic properties, in the brewing process (Pavsler and Buiatti, 2009a). Hops give beer its characteristic aroma and flavor in addition to protecting it against microbiological contaminations (UNICER, 2015a). Actually in this period ale and beer had two different meanings - ale was described as a non-hopped malt beverage and was the main type of beer in Europe until the sixteenth century while beer was the hopper malt beverage (Pavsler and Buiatti, 2009a).
Despite the development of brewing process during the Middle Ages there was still room for improvement. In the Modern Age the discovery of the existence of bottom-fermenting yeasts by Emil Christian Hansen allowed greater consistency of taste and beer quality (APCV, 2015a; UNICER, 2015b). Another significant addition to the brewing process was the maintenance of fermentation tanks and the ability to keep storage cellars at low temperatures throughout the year (UNICER, 2015b).
Beer has a long history in Portugal but it was only since the seventeenth century that beer consumption started rising. In the eighteenth century brewing factories started appearing and in the nineteenth century those factories began to be grouped into major companies. Today two major groups are responsible for beer commercialization in Portugal – UNICER and Sociedade Central Cervejas e Bebidas (APCV, 2015a).
1.1.2. Raw materials
Beer is one of the most consumed alcoholic beverages worldwide. There is a wide variety of beers resulting from different brewing process but in all cases four main ingredients are required – water, malted cereals, hops, and yeasts (Harrison, 2009; Wunderlich and Back, 2009).
Water is the main ingredient in beer as it comprises 90-95% of the content of the finished product, which means the purity of water plays an important role in the brewing process (APCV, 2015b; Harrison, 2009). Its chemical characteristics such as pH and metal content (which may vary geographically) can dramatically affect beer color, flavor and aroma (Harrison, 2009; Wunderlich and Back, 2009).
Malted cereal originates from the germination of cereals under predetermined and controlled environmental conditions. After water, this is the second most important
3 ingredient in the brewing process. Malted cereals are an important source of enzymes that degrade several components of grain which are essential to yeast growth. This ingredient has a significant impact on the process because several grain components end up in final product influencing (both positively and negatively) various attributes of the mentioned beverage. Albumins, globulins, minerals, lipids and polyphenols are some of those components which will be mentioned later in 1.1.5. (Wunderlich and Back, 2009). Non-malted cereals or adjuncts (corn, rice, and wheat) are frequently used as ingredients as well in order to add fermentable carbohydrates necessary to yeast growth (Harrison, 2009).
Hop (Humulus lupulus) is an aromatic plant used in the brewing process since the late Middle Ages (APCV, 2015b). Generally hops are added in wort processing (explained further 1.1.4.) to alter beer flavor and aroma. In addition this ingredient prevents microbial contamination. Just like malted cereals, hops contents (resins, flavoring agents and polyphenols) also affect final beer characteristics and even provide antioxidant properties (Harrison, 2009; UNICER, 2015a; Wunderlich and Back, 2009).
Fermentation is the essential step in the brewing process. There are two fermentation organisms that can be used in this stage – bacteria and yeast. Yeast is more commonly used (Harrison, 2009). This organism in anaerobic conditions promotes alcoholic fermentation, a metabolic pathway which convert sugar from wort into ethanol and carbon dioxide (APCV, 2015b; Wunderlich and Back, 2009). Final beer characteristics are also influenced by yeast especially because there is a large variability of yeast strains (Harrison, 2009).
1.1.3. Beer types
Regardless of the enormous diversity of beer products, generally only two main categories are considered – ale and lager. Brewing processes are identical for both types except for the yeast species used in the fermentation step, since ale beers are produced with Saccharomyces cerevisiae, while lager beers are produced with
Saccharomyces pastorianus (APCV, 2015c; Harrison, 2009; Pavsler and Buiatti,
2009a; Pavsler and Buiatti, 2009b). Despite their variety, yeast species are divided into two major groups as well – bottom-fermenting yeasts and top-fermenting yeasts. This yeast classification can be related to beer categories – bottom-fermenting yeasts are used to produce lager beers, while top-bottom-fermenting yeasts are used to produce ale beers (APCV, 2015c; Harrison, 2009; UNICER, 2015b).
As mentioned above ale beers’ fermentation is carried out by Saccharomyces
4 range of 18–27ºC for a period of time no longer than one week (Harrison, 2009). Cell migration to the surface also confers a wider range of aromas and flavors to ale beer (APCV, 2015c). Top-fermented beers usually have higher alcohol content when compared to bottom-fermented beers. Several sub-groups can be considered in ale beers such as Porter, Stout, India Pale Ale, Sour Ale, and so many others. Consumed widely until late Middle Ages, today it only represents about 10% of all beer produced worldwide (Pavsler and Buiatti, 2009a).
On the other hand lager beers’ fermentation is carried out by Saccharomyces
pastorianus, a bottom-fermenting yeast. While ale beers only have one fermentation
step, lagers have two steps – primary and secondary. For primary fermentation, incubation temperature is in the range of 8-15ºC. During this step yeast tend to flocculate and migrate to the bottom. Primary fermentation is followed by a long secondary fermentation step at lower temperatures (between -1ºC and +4ºC) which can take up to a month or even more (Pavsler and Buiatti, 2009b). In olden days producing lager beers was too difficult because it was too hard to maintain such low temperatures for long periods of time (APCV, 2015a). However, with the development of refrigeration after the nineteenth century producing lager beer became possible and today it represents more than 90% of all beer produced worldwide (APCV, 2015c; Pavsler and Buiatti, 2009a). Several sub-groups can be considered in lager beers such as Pilsner, Dark Lager, Bock, Munchener, Dortmunder, and many others (Pavsler and Buiatti, 2009b).
1.1.4. Brewing process
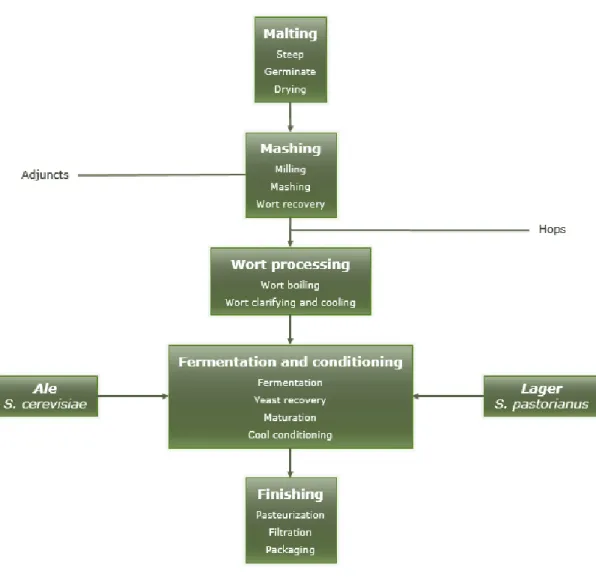
Brewing process evolved throughout history, undergoing several changes, which still happens nowadays. There are several different beer products, many of those with only slight differences between them. However, in all cases the brewing process has the same main steps, although conditions in each step may vary depending on the produced beer. Malting, mashing, wort processing, fermentation and conditioning, and finishing are the main steps. Each procedure has its stages which may be different from beer to beer (Harrison, 2009). A brief explanation of each step will be presented in this section. A diagram related to the overall brewing process can be found in figure 1.
5
Figure 1 - General brewing process (adapted from Harrison, 2009).
The first step in the brewing process is malting, a process of controlled germination in order to induce biochemical changes (Wunderlich and Back, 2009). Those changes produce an ample supply of enzymes capable of degrading components of grain. This degradation will provide the necessary nutrients for yeast growth. Malting can be divided into three stages – steeping, germinating and drying (Harrison, 2009). Barley is the most common cereal used in brewing especially because it prospers even in adverse growing conditions. However, it still needs some basic conditions to germinate such as sufficient oxygen, heat, and humidity (Wunderlich and Back, 2009). To promote such conditions barley grains are steeped in 10-15ºC water until water content in grain reaches more than 40% and then germinated at 15-20ºC for almost one week. With germination the embryos’ activity rises and several enzymes (amylase, protease and other hydrolases) are produced to degrade starch, proteins and other components of grain into substances (sugars, amino acids, fatty acids) needed to yeast growth. After germination, grains are
6 subjected to a drying process to drastically reduce water content which will stop the embryos’ growth without inactivating the produced enzymes (Harrison, 2009; Wunderlich and Back, 2009). Water content may be reduced to 3.5-4% to produce pale malts or to 1.5-2% for dark malts (Wunderlich and Back, 2009).
Mashing is important for wort production and it can be split into three steps – milling, mashing and wort recovery (Harrison, 2009). Malt produced in the previous step must be milled first to remove dust and stones and thus prevent damage to the brewing equipment (Wunderlich and Back, 2009). Adjuncts can be added at this step to add fermentable carbohydrates necessary to yeast growth (Harrison, 2009). At the end flour (malted and non-malted cereals) is obtained (UNICER, 2015a). Water is added to flour which in turn is submitted to different variables such as time, pH and temperature. These conditions may vary depending on the type of beer to be produced. During mashing, enzymes present in malt promote the hydrolysis of more complex molecules into simpler ones (Harrison, 2009; UNICER, 2015a; Wunderlich and Back, 2009). Hydrolysis of all grain content occurs within a few hours and after that temperature is increased up to 75ºC leading to enzyme denaturation. However, pH of malt is not acidic enough for optimal enzyme activity, which means some adjustments have to be made. Lactic acid addition or bacterial fermentation allows for a reduction of pH to approximately 5.2 (suitable for lager production) or even lower (ale production) (Harrison, 2009). After the enzymes are inactivated a soluble phase and an insoluble one remain. The insoluble phase corresponds to the solid that settles out and the soluble phase is the wort which has the necessary compounds for yeast growth (Harrison, 2009; Wunderlich and Back, 2009). Nevertheless, wort must be separated from the insoluble phase through filtration at almost 80ºC for about 2 or 3 hours (Wunderlich and Back, 2009; UNICER, 2015a). Then wort is transferred into a brew kettle followed by the addition of hop in order to provide aroma and flavor to beer (Harrison, 2009).
Before fermentation, wort must be processed through boiling. This step kills all microorganisms, including lactic acid bacteria added to lower pH during mashing, denatures remaining enzymes, extracts essential oils and resins from hops, promotes precipitation of substances responsible for cloudiness, enhances color development, removes undesirable volatiles and concentrates wort (Harrison, 2009; UNICER, 2015a; Wunderlich and Back, 2009).
After being boiled wort is inoculated with yeasts through a process called pitching or seeding. Yeasts used for inoculation depend on the type of beer to be produced -
Saccharomyces cerevisiae for ale beers and Saccharomyces pastorianus for lager
7 as mentioned in 1.1.3. (Harrison, 2009; Wunderlich and Back, 2009). A constant temperature and humidity must be achieve to maintain the desired growth rate for the yeast. To growth yeasts need to consume essential nutrients (sugars, amino acids, fatty acids) present in malt and available after mashing process. For instance, sugars are converted into alcohol and carbon dioxide (Harrison, 2009; UNICER, 2015a; Wunderlich and Back, 2009). There is a decrease of pH during fermentation which increases fermentation stability and decreases the possibility of contamination. During fermentation, bottom-fermenting yeasts tend to flocculate and settle to the bottom of the brew kettle. Top-fermenting yeasts tend to form small clumps of cells that are carried to the top. Either way, yeasts may be collected from the bottom or from the surface, respectively, and reused in the next fermentation (Harrison, 2009). At the end of the fermentation there is a residual extract composed by non-fermentable sugars, sugars which were not converted into another compound and should be left in final beer. This residual extract will allow carbon dioxide formation during maturation (Wunderlich and Back, 2009). Some volatile compounds like aldehydes and sulphur are produced during fermentation and generally have a negative impact on aroma and flavor of final beer (UNICER, 2015a; Wunderlich and Back, 2009). Maturation step aims to remove those compounds by trapping them into carbon dioxide bubbles formed by residual extract fermentation (Wunderlich and Back, 2009). Maturation occurs at lower temperatures (0-2ºC) for several weeks allowing the beer clarification and stabilization (Harrison, 2009; UNICER, 2015a; Wunderlich and Back, 2009).
After maturation beer is cloudy and presents suspended particles (yeasts, bacteria, colloids). Pumping beer through a suitable filter or centrifuge it will remove suspended particles and beer will appear clear (UNICER, 2015a; Wunderlich and Back, 2009). After filtration or centrifugation some bacteria and yeast residues may remain in beer. Those residues are removed through pasteurization, a thermal treatment. Pasteurization can be carried out by heat or cold (Harrison, 2009; UNICER, 2015a). In heat pasteurization beers are subjected to almost 75ºC for a period ranging between 15 and 30 seconds. Nevertheless, such temperatures may have a negative impact on flavor. On the other hand cold pasteurization involves the use of chemical agents for preservation or filtration through membrane filters avoiding flavor loss. Finally, in aseptic conditions beer is packed into appropriate containers (cans, bottles, barrels, kegs) which are generally pasteurized as well (Harrison, 2009).
8
1.1.5. Beer composition
Beers have several compounds in its final composition. Such compounds may be derived from raw materials or be a result of the brewing process (Harrison, 2009).
Quantitatively water is the most important ingredient in the brewing process since it represents more than 90% of the beer composition. Thus, water quality plays an important role and must be potable, pure, and free of pathogens. However, water mineral content may affect beer properties and flavor. Depending on the concentration in which metals are found, they may have negative or positive effects on beer quality. Some of those are extremely toxic even at lower concentrations but trace amounts can be crucial for yeast growth during the brewing process (Buiatti, 2009). Metals may be provided by malts but water is the main source (Wunderlich and Back, 2009).
Starch, cellulose and hemicellulose are the most important grain components. These polysaccharides are hydrolyzed into smaller carbohydrates which will be converted into carbon dioxide and alcohol (mainly ethanol) (Wunderlich and Back, 2009). Both carbon dioxide and ethanol are flavor enhancers. Ethanol may counteract with the bitterness effect introduced by hop’s resins. However, some carbohydrates such as glucose, fructose, and maltose, are present in final because they are unfermented carbohydrates and consequently were not converted into carbon dioxide and ethanol. Despite its lower concentrations, unfermented carbohydrates may have a significant influence on beer taste (Buiatti, 2009).
Proteins are hydrolyzed into its fundamental units, amino acids, during malting. Amino acids are essential for yeast growth but not all of them are required. Unutilized amino acids such as proline are not converted into another compounds and corresponds to nitrogenous compounds present in beer. About 80-85% of those amino acids came from malts and 10-15% from yeasts (Buiatti, 2009). Beyond amino acids a tiny fraction of proteins such as albumins and globulins may also be found in final beer. Those proteins are important for foam and colloidal characteristics (Wunderlich and Back, 2009).
During fermentation many amino acids are subjected to deamination and transamination reactions carried out by yeasts converting those monomeric units into organic acids, aldehydes, alcohols and esters.
Hops contain a range of chemical species which may influence beer properties – essential oils and resins. Essential oils from hops are a complex mixture which can be divided into two major fractions – the group of hydrocarbons without oxygen and the group of hydrocarbons with oxygen including esters, aldehydes, ketones, acids,
9 and alcohols. The latter group is responsible for modifying beer aroma. Resins are hops’ derived compounds which grant bitterness to beer (Buiatti, 2009). Besides bitterness resins also enhance beer physiological digestibility, foam stability, and bacteriostatic nature (Wunderlich and Back, 2009).
Both grains and hops are important sources of polyphenols, a substance with a high impact in brewing in many ways. It generally has a positive on influence color, foam, taste, and haze formation. Polyphenols also have some properties such as antioxidant ones which enhances beer quality (Wunderlich and Back, 2009).
Generally lipids are not present in beer because they are eliminated during the brewing process. Nevertheless, when present lipids affect negatively beer giving it a cardboard taste (Buiatti, 2009).
Another group of compounds present in beer are vitamins. These substances are usually present in the embryos’ and aleurone layer (Wunderlich and Back, 2009). Although they do not have any effect on beer characteristics, vitamins (mainly B-group) are crucial as growth factor for yeast (Buiatti, 2009).
1.1.6. Beer consumption, production and its impact
Despite the world economic crisis that in recent years beer consumption has remained constant at least in the countries of the European Union (EU) (see table 1) (The Brewers of Europe, 2014).
Table 1 – Total beer consumption per capita between 2008 and 2013 (in 1000 hl) in EU (adapted from The Brewers of Europe, 2014).
2008 2009 2010 2011 2012 2013
Average EU 28 78 75 73 73 73 71
Today beer still remains one of the most widely consumed alcoholic beverages and to cope with its large consumption, production has to keep pace with demand. In the last years beer production has succeeded to satisfy demand but by a close range (The Brewers of Europe, 2014).
A high beer production has a huge impact especially at an economic level. In this matter suppliers, employment, government revenues and hospitality are of particular interest (The Brewers of Europe, 2013).
Several sectors are involved in beer production from raw materials provided by agriculture until it reach the consumers through marketing corresponding to a move 23 billion of euros in European Union (EU) just in 2012 (The Brewers of Europe, 2013).
10
Graphic 1 - EU purchases of goods and services by brewing sector in 2012 (adapted from Brewers of
Europe, 2013).
As it can be seen in graphic 1 almost a quarter of breweries’ purchases concerned packaging. In fact beer is storage in recipients purchased to packaging industry and then sold to consumers. Packaging industry provide to the brewing sector different kinds of recipients. About 50% of beer is sold in glass bottles (returnable and non-returnable) and about 30% in can. There is also kegs, casks and bulk tanks. (The Brewers of Europe, 2013).
Brewing sector has a strict relationship with the industries which means brewing development supply industry by creating more jobs. Above all its indirect employment is higher in agriculture but this also occurs in the other industry sectors as shown in graphic 2. In 2012 the brewing sector helped create more than 300 000 jobs in other industry sectors in EU (The Brewers of Europe, 2013).
Graphic 2 - Indirect employment related to beer in the EU in 2012 (adapted from The Brewers of Europe, 2013).
Hospitality sector also benefits from brewing sector since beers are available in bars, pubs, and restaurants. Yet about 75% of the EU Member States present a higher beer consumption at home than in hospitality facilities. This explains why beer
11 is sold more in bottle than in other containers. Just out of curiosity in 2012 Portugal registered the higher beer consumption in the hospitality sector in all EU as shown in graphic 3 (The Brewers of Europe, 2013).
Graphic 3 - Beer consumption in the hospitality sector, as a percentage of total beer consumption per EU Member State in 2012 (adapted from The Brewers of Europe, 2013).
Government of each country also benefits from brewing sector since they get revenues from beer products. There are three major categories of tax revenues due to beer. The first one is income, payroll taxes and security contributors which are paid by employers and employees involved in all sector related to beer. The second one is valued added tax (VAT) which is levied on the turnover of beer sales in retail and hospitality (The Brewers of Europe, 2013). The third one is called excise duty which is an indirect tax on the sale or use of specific products and is applied in all EU Members States. Alcohol (includes beer) is one of those products alongside with tobacco and energy (European Commission, 2015). This tax can represent up to one fifth of total government revenues due to beer (The Brewers of Europe, 2013).
In Portugal total beer consumption dropped about 20% between 2008 and 2012 but a considerable amount is still being consumed. Like other EU Member States, beer consumption at home (beer consumption off-trade) in Portugal also increased as shown in table 2 (The Brewers of Europe, 2013).
12
Table 2 - Basic characteristics of beer market in Portugal between 2008 and 2012 (adapted from The Brewers of Europe, 2013).
2008 2009 2010 2011 2012 Δ 2008-2012 Total consumption (in
hectoliters) 6 200 000 6 100 000 5 900 000 5 320 000 4 927 000 -20.5% Total consumer spending
(in million Euro) 2 687 3 133 3 001 2 808 2 636 -1.9% Consumption of beer per
capita (in liters) 61 60 59 53 49 -19.7%
Beer consumption on-trade
(hospitality) 70% 70% 69% 69% 67.5% -2.5%
Beer consumption off-trade
(retail) 30% 30% 31% 31% 32.5% 2.5%
Average consumer price in on-trade (1 liter, including
taxes) (in Euro)
6.00 6.60 6.60 6.85 7.04 17.3%
Average consumer price in off-trade (1 liter, including
taxes) (in Euro)
1.56 1.72 1.72 1.78 1.84 18.3%
In 2012 Portugal was one of the top 5 countries to export beer especially to countries out of EU (The Brewers of Europe, 2013).
1.1.7. Metal contaminants
In all beers metal presence is verified although it is not added intentionally. Its presence is due in large part to raw materials (water, cereals, barley, and hops) that are used in brewing corresponding to endogenous sources of metals in beers. Metal content is variable and depends on the substrates used, the type of beer produced, and the country of origin of beer. However metal presence in beers is not explained only by the raw materials used in their manufacture - metals may be added inadvertently during fermentation and maturation processes. Brewing equipment itself as well containers in which beer is stored and transported are possible exogenous metal sources (Donadini et al., 2008; Pohl, 2008).
1.1.8. Legislation
The large consumption of beer and the possibility of contamination with substances that may be harmful to consumers’ health raises great concerns. Hereupon, as many products on the market for human consumption, also beers are regulated by law. In Portugal beers are regulated by Portaria nº 1/96 from 3rd January defining what is meant by beer, what kinds of beer are allowed and permitted
13 additives, marketing and labelling. It refers also what features must be controlled such as color, smell, taste, acidity, and pH. Concerning metals, limits are set for some of them – arsenic (0.1 mg/L), cobalt (0.05 mg/L), copper (0.2 mg/L), iron (0.3 mg/L), lead (0.2 mg/L) and zinc (1 mg/L), the target metals of this study (Portaria nº 1/96).
1.2. Metals referred in legislation
Metals are present in all kind of beverages, alcoholic or not. Some of them are essential in the brewing process others not so much. Still metals may affect beer characteristics in a positive or negative way and may also be a risk for the consumer’s health.
In this study metal quantification will be performed to six elements and all of them are regulated by Portuguese law – arsenic, cobalt, copper, iron, lead, and zinc. Characteristics as well as human exposure, toxicokinetics and toxicology for each of the aforementioned metals will be briefly described in this section.
1.2.1. Arsenic
Arsenic is a steeled grey solid material widely distributed in the Earth’s crust. Chemically it has metal and non-metal characteristics, therefore is classified as a metalloid. However, in environment arsenic is not found in a solid state but combined with other elements (ATSDR, 2007a). There are several oxidation states but the most common ones for arsenic are III and V (Lindo and Silvestre, 2010; Valko et al., 2005). Depending to each element is combined with arsenic can be classified into two categories - organic (carbon and hydrogen) and inorganic (oxygen, chlorine and sulphur) and both forms may occur in environment and in human body (ATSDR, 2007a). Inorganic arsenic is considerably more toxic and more common than the organic form and it is even considered as a human carcinogen by IARC (included in Group I) (Donadini et al., 2008).
The lowest exposure possible to arsenic is the best preventive measure to follow. Nonetheless, people may be exposed to this metalloid through food, water and air especially because arsenic does not have smell neither taste (ATSDR, 2007a). Among food sources arsenic is mainly found in fish and agriculture products. Arsenic is a naturally occurring element which means drinking water from geological structures turns out to be another source of exposure. Nevertheless, much of exposure to arsenic is due to anthropogenic activity – traffic fumes, uncontrolled industrialization and massive use of pesticides in agriculture. Much of arsenic from anthropogenic activity accumulates in soil and water and consequently in grains used to produce beer which means this beverage (as other beverage and products derived from
14 agriculture) could easily introduce arsenic in human body (Donadini et al., 2008). Apparently it does not alter chemical and physical properties of beer.
There are at least three main pathways of exposure through which arsenic may enter in human body – inhalation, oral and dermal. Tough skin is a potential route of exposure to arsenic almost none of this element is absorbed through the mentioned organ. After reach the lung through inhalation, arsenic accumulates on the lung surface and then absorbed (ATSDR, 2007a). Arsenic is easily absorbed in the gastrointestinal tract when the element intake is due to oral exposure – about 80 to 90% of ingested arsenic is absorbed. From there arsenic is transported to every organ in the human body, yet it seems to be more accumulated in hair, nails and skin (Lindo and Silvestre, 2010).
Once present in human organism arsenic can undergo two different metabolic processes – reduction/oxidation and methylation. Reduction/oxidation process interconvert As (III) and As (V). Methylation is a more complex process (biotransformation) where arsenate (arsenic with an oxidation state of V) is reduced to arsenite (arsenic with an oxidation state of III) and then subjected to a series of methylation reactions producing methylarsonous acid (MMA) and dimethylarsinic acid (DMA) (ATSDR, 2007a). Methylation pathway has being considered as a detoxification but recently evidences seem to show the opposite – methylated and dimethylated arsenicals in the trivalent oxidation state appear to be more cytotoxic and genotoxic than the ones in the pentavalent oxidation state. Thereby, arsenic methylation may actually be a pathway for arsenic potential activation instead of diminishing its toxicity (Liu et al., 2008; Thomas et al., 2001 in Valko et al., 2005), especially because arsenicals in the trivalent oxidation state are thiol-reactive, thus inhibiting enzymes and/or altering proteins by reacting with proteinaceous thiol groups (Liu et al., 2008).
As regards to its excretion arsenic may be expelled from the organism through skin, feces and urine (ATSDR, 2007a). Skin is the major organ where arsenic accumulates, therefore it can be excreted through skin desquamation and sweat (Liu et al., 2008). Only small amounts of arsenic are excreted with feces (ATSDR, 2007a). Urine is the primary pathway of arsenic excretion – about 10% is excreted in inorganic acid form, 10 to 20 % MMA and 60 to 80% DMA (Lindo and Silvestre, 2010). Exposure to arsenic (organic and inorganic forms) may have extremely adverse effects in humans and it may even be fatal if ingested in larger doses (70 – 180 mg) (Liu et al., 2008). Several systems like respiratory, cardiovascular, nervous and hematopoietic ones are negatively affected by this element (Lindo and Silvestre, 2010; Liu et al., 2008). It is also associated to cancer development in some organs
15 such as lung, skin, liver, bladder, and kidney (Donadini et al., 2008; Valko et al., 2005).
1.2.2. Cobalt
Cobalt is a natural occurring element with some properties similar to iron like magnetism (Liu et al., 2008). It can be found all over the environment – rocks, soil, water, plants, animals, and even in meteorites (ATSDR, 2004a). It has several applications especially in painting since its salts are commonly used in paint driers and as ingredients of colored pigments. Other applications include corrosion and wear resistance and magnetism (Liu et al., 2008; Valko et al., 2005). Cobalt is an essential element since cobalamin (a form of cobalt) is a critical component of vitamin B12, an important substance to human being since it is required for the production of red blood cells (Liu et al., 2008; Simonsen et al., 2012).
Cobalt exposure is inevitable especially due to diet which is the largest source of cobalt intake (ATSDR, 2004a). Humans cannot synthetize vitamin B12 so it must be ingested to fulfil nutritional requirements and with it cobalt in cobalamin form (Valko et al., 2005). However, occupational exposure it is also relevant especially in plant processing, metallurgical and ceramic industries (ATSDR, 2004a; Simonsen et al., 2012).
Inhalation, oral and dermal exposures are the reported cobalt intakes into the human body. The need to ingest vitamin B12 make oral exposure the most relevant one. Cobalt absorption occurs in gastrointestinal tract (ATSDR, 2004a). Some studies from almost three decades reported cobalt absorption depends on the compound to which cobalt is associated when ingested. For instance, there is a 30% cobalt absorption from cobalt chloride while absorption from cobalt oxide is only 5%. Cobalt absorption also has a huge variation from individual to individual and can go from 5 up to 45% (Elinder and Friberg, 1986 in Liu et al., 2008; Patrick et al., 1989 in ATSDR, 2004a). After absorption cobalt is transported to every organs through bloodstream, especially organs that required vitamin B12 such as liver and kidneys. Cobalt metabolism is most of all related to vitamin B12 metabolism (ATSDR, 2004a). Vitamin B12 is an essential cofactor in methyl transfer reactions during the conversion of homocysteine to methionine (Ansari et al., 2014). As regards to its excretion most of absorbed cobalt is expelled through urine (80%) and feces (15%) (Liu et al., 2008).
Cobalt mechanisms of toxicity are still unclear but several potential ones have been identified (ATSDR, 2004a; Simonsen et al., 2012). Cobalt may inhibit crucial enzymes especially when they are composed with amino acids such as cysteine and
16 methionine because cobalt has high affinity for sulfhydryl groups. Cobalt is also a calcium antagonist which means cobalt can compete with calcium for intracellular calcium binding proteins and even inhibit calcium signaling based processes (Simonsen et al., 2012). Cobalt may also interfere with DNA repair processes and induce DNA damage through oxidative stress. This effects on DNA are a result of several oxidant-based and free radical-based processes where cobalt is involved and capable of generating oxygen radicals like superoxide and thus leading to oxidative stress (ATSDR, 2004a; Simonsen et al., 2012; Valko et al., 2005).
Exposure to cobalt may have some adverse effects to humans. Those effects may include problems at thyroid gland (ATSDR, 2004a; Simonsen et al., 2012), lung related conditions such as asthma, pneumonia, and wheezing (Simonsen et al., 2012; Valko et al., 2005), allergic contact dermatitis (Simonsen et al., 2012) and even cardiomyopathy (Liu et al., 2008).
1.2.3. Copper
Like the previous elements copper is a natural occurring element as well (ATSDR, 2004b). It has several properties such as has malleability, ductility, and electrical and thermal conductivity whereby this element has several applications like coins, electrical wiring, water pipes, metal products and many others (ATSDR, 2004b; Lindo and Silvestre, 2010). Copper is an essential microelement which plays several important roles. For instance, it is a fundamental component in several enzymes; acts as a reductant in the enzymes that reduce molecular oxygen, scavenging and neutralizing free radicals; participates on hemoglobin, myelin, and melanin production; is involved in the development of numerous tissues and participates in both iron and energy metabolism (Fraga, 2005; Lindo and Silvestre, 2010; Liu et al., 2008; Osredkar and Sustar, 2011).
Exposure to copper is inevitable because it is everywhere – rocks, soils, sediments, water and even air. Although copper plays vital roles in the human body, an exaggerated exposure to this element is not advisable in order to minimize toxic effects. Exposure to copper may occur by inhalation of copper-containing dust but oral exposure is much more common (ATSDR, 2004b). Actually there is a recommended daily intake of 1 mg per day for young adults (Fraga, 2005; Osredkar and Sustar, 2011). Sea food, liver, cereals, and seeds are excellent sources of copper (Osredkar and Sustar, 2011; Romaña et al., 2011). Water ingestion is also one of the bigger sources for copper intake especially tap water since copper is commonly used in water pipes (ATSDR, 2004b).
17 Although small amounts of copper are absorbed in the stomach, most of it is absorbed by the gastrointestinal tract, primarily in the duodenum (Liu et al., 2008; Romaña et al., 2011; Valko et al., 2005). Copper absorption in the gastrointestinal tract may be negatively affected by other substances such as iron, zinc, and fructose (Liu et al., 2008). Once absorbed copper may be transported to the liver bounded to albumin. In the liver copper may be stored in hepatocytes (Osredkar and Sustar, 2011; Valko et al., 2005). From the liver copper is transported in the bloodstream to the other organs by being an integral part of ceruloplasmin, a protein responsible for catalyzing the oxidation of minerals such as iron (ATSDR, 2004; Osredkar and Sustar, 2011; Valko et al., 2005). Ceruloplasmin is synthetized in the liver (ATSDR, 2004).
With so many sources of exposure to this element especially by ingestion, copper daily ingestion may exceed the recommended. However, copper levels are maintained within sustainable limits through control of excretion. Although is not an excretion process, copper storage is a way to remove the element from the bloodstream maintaining physiological levels of plasmatic copper. Copper may be excreted through sweat, urine, feces, and menses, but the major route of copper excretion is the bile representing about 80% of total excretion (Liu et al., 2008; Romaña et al., 2011; Valko et al., 2005). About 10-15% copper excreted from bile is reabsorbed (Romaña et al., 2011).
Exposure to high levels of copper can lead to hemolytic anemia, liver injuries, vomiting, and epigastric pain (Lindo and Silvestre, 2010; Liu et al., 2008). As mentioned before copper is important to neutralizing free radicals. However, in excess it may have the opposite effect because this element has the potential to act has an oxidant. Cupric ion (Cu2+) may be reduced by ascorbic acid or by glutathione-S-transferase to cupric ion (Cu+) which is capable of catalyzing the formation of reactive radicals through the decomposition of hydrogen peroxide. Hereupon, in excess copper is capable of generating free radicals which will lead to oxidation stress and consequently DNA damage and even low-density lipoprotein (LDL) oxidation. LDL oxidation may have several consequences especially because it promotes atherogenesis (Valko et al., 2005).
There are also two copper related genetic disorders worth mentioning – Menkes and Wilson Diseases. In Menkes Disease there is a deficiency on the carrier protein (albumin) responsible for transporting copper from the enterocytes to the liver. In Wilson Disease copper is normally transported to the liver but it accumulates in this organ due to a poor incorporation in ceruloplasmin. Also in Wilson Disease there is a deficient excretion through bile leading to copper accumulation in other organs (Liu et al., 2008; Romaña et al., 2011; Osredkar and Sustar, 2011).
18 Unlike arsenic and cobalt, copper does has influence in beer qualities and it is a parameter to take into account during the brewing process. Copper plays an important role in aerobic beer ageing and flavor stability during storage. However, it may be toxic to yeasts and lead to an irreversible beer haze. To prevent haze formation and yeast mutagenesis an upper limit of 0.1 mg/L is recommended (Buiatti, 2009; Pohl, 2008).
1.2.4. Iron
Iron is one of the most abundant elements in the Earth’s crust. In its pure form has a silver color and is highly reactive especially in the presence of oxygen which leads to iron oxidation and thus generating iron oxide (Lindo and Silvestre, 2010). There are several forms of iron oxide but magnetite, maghemite and hematite are the most common ones. These oxides are very important at a technology level mainly due to its magnetic properties. Among the possible applications are magnetic seals and inks, magnetic recording media, catalysts, ferrofluids and even contrast agents for magnetic resonance imaging and therapeutic agents for cancer treatment (Teja and Koh, 2009). Such as copper also iron plays vital roles in human body. It is essential in erythropoiesis and is a fundamental component of several proteins such as hemoglobin, myoglobin (heme proteins), and containing and/or Fe-activated enzymes (succinate dehydrogenase, alcohol dehydrogenase) (Fraga, 2005; Liu et al., 2008).
Iron deficiency causes anemia. A total iron intake ranging between 14.4 and 20.2 mg/day is enough to prevent iron deficiency related problems (Fraga, 2005). There are two forms of iron – heme Fe and non-heme Fe – and both of them are obtainable through diet. Examples of sources of heme Fe are meat, poultry, and fish, while cereals, seed of leguminous plants, fruits, vegetables, and dairy products are good sources of non-heme Fe (Fraga, 2005; Liu et al., 2008).
Iron homeostasis is regulated through several processes including absorption, storage and excretion. Most of the dietary iron is absorbed in the duodenum (Grotto, 2008; Liu et al., 2008; Valko et al., 2005). Some factors such as acidity, and solubilizers enhance iron absorption. The amount of iron absorbed by the body is regulated by the need of the latter (Grotto, 2008). This element is absorbed in the apical membrane of the intestinal epithelial cells (Lindo and Silvestre, 2010). Different protein transporters are involved in heme Fe and non-heme Fe. After been reduced from trivalent iron to divalent iron, dietary free iron (non-heme Fe) is transported into the enterocytes by the divalent metal transporter protein (DMT-1) (Valko et al., 2005). Dietary heme Fe is internalized by the heme carrier protein-1 (HCP1). HCP1 is expressed in the liver and kidneys and its regulation occurs according
19 to intracellular iron level – transport dietary heme Fe when necessary and avoids it when the organism do not need more iron preventing accumulation. Intestinal iron absorption is also influenced by other protein, hepcidin whose expression is regulated at transcriptional level. When iron levels are high there is no need for iron absorption at intestinal level whereby hepcidin expression inhibits DMT-1. If iron absorption is required there is no hepcidin expression (Grotto, 2008).
Once in the enterocytes iron can be stored by ferritin and hemosiderin or transported to the plasma by ferroportin. Then iron bounds to transferrin. However, this protein is not selective for divalent iron which means divalent iron must be converted to trivalent iron. Ceruloplasmin and hephaestin promote divalent iron oxidation to trivalent iron (Valko et al., 2005; Grotto, 2008). Once bounded to transferrin iron is transported and distributed to different tissues. Nevertheless, to enter in a cell a transferrin receptor must exist on the cell membrane, otherwise iron incorporation do not occur. If there is a transferrin receptor on the cell membrane, iron binds to that receptor followed by endocytosis (Grotto, 2008; Liu et al., 2008; Valko et al., 2005).
Besides diet iron may be acquired through recycling senescent blood red cells. Blood red cells have an average life span of 120 days. After that they are no longer functional and must be removed. Such removal is carried out by macrophages which will phagocytose and degrade blood red cells. A great portion of iron is incorporated in the heme group of those cells so this recycling is an important source of the element. After being recovered iron (current oxidation state is II) may be stored in the macrophage itself in ferritin form or exported through ferroportin and oxidized by ceruloplasmin. Finally iron is transported mainly to bone marrow to participate in the production of new red blood cells (Grotto, 2008).
Iron levels are also maintained through excretion. Excretion through gastrointestinal tract is the most common way but iron can also be excreted through urine and skin (Liu et al., 2008).
Accidental ingestion of mineral supplements may lead to acute iron poisoning (Liu et al., 2008). Chronic iron intoxication may also occur especially if there is a high dietary iron intake or if the individual took repeated blood transfusions (Fraga, 2005). Hemochromatosis is probably the most common cause of chronic intoxication. Hemochromatosis is a genetic disorder which enhances iron absorption from the gut leading to the accumulation of this element (Fraga, 2005; Valko et al., 2005). Similarly to copper, iron excess may lead to the generation of free radicals and consequently to serious damage in the organism, including DNA damage due to oxidative stress, lipid and protein peroxidation (Valko et al., 2005).
20 Iron has influence in beer qualities and it is a parameter to take into account during the brewing process. Iron is responsible for beer quality and flavor stability. It may also influence beer color by darkening it. However, in high quantities beer acquires an unpleasant harsh and metallic taste, foam appears greyish, yeast activity is reduced, and there is haze formation (Buiatti, 2009; Pohl, 2008). There is a recommended upper limit which is the same for copper – 0.1 mg/L (Pohl, 2008).
1.2.5. Lead
Lead is a naturally occurring element and probably the most common environmental pollutant. Normally lead is not found in its pure form, as a metal but combined with more elements such as lead oxides (ATSDR, 2007b; Lindo and Silvestre, 2010; Sharma et al., 2011). It can be found in two forms – organic (e.g. gasoline) and inorganic (e.g. paints, pipes) (Donadini et al., 2008). This element has many applications in several areas. It is used as a pigment in paints and dyes, and in the manufacture of batteries, accumulators, and conduits (ATSDR, 2007b; Lindo and Silvestre, 2010).
Due to its numerous applications lead exposure is quite high. Besides that lead contamination through anthropogenic activities must be considered because lead may be present in air and food (Donadini et al., 2008). Bad habits such as smoking is also a form of exposure because cigarettes contain small amounts of lead. Exposure to lead may happen through inhalation and ingestion (ATSDR, 2007b).
After inhalation of air contaminated with lead or aerosols containing this element, lead particles are deposited in the respiratory tract. Amounts and patterns of such deposition is mainly affected by particles size and breathing patterns which may or may not be related to the individual age. Absorption of deposited lead is influenced by particle size and respective solubility (ATSDR, 2007b; Sharma et al., 2011). It should be noted that most of lead particles inhaled have very small dimensions so almost of them are absorbed (Liu et al., 2008). Only a tiny fraction of ingested lead is absorbed and even less is retained. However, this is not exactly true for children since in this case about half of ingested lead is absorbed and one third is retained (Liu et al., 2008).
Regardless the route of exposure, after being absorbed lead enters in the bloodstream and most of it (about 99%) is bounded to hemoglobin and only about 1% on serum. The half-life of lead in blood is about 30 days. Only lead present is serum is distributed. First it goes to soft tissues such as liver and kidneys and then is redistributed to skeleton and hair (ATSDR, 2007b; Liu et al., 2008; Sharma et al., 2011). The half-time of lead in soft tissues is about 40 days (Lindo and Silvestre,
21 2010). Once lead reaches skeleton it tends to accumulate and its level increases with age. The half-time of lead in skeleton is about 20% which is a significant source of endogenous exposure (Liu et al., 2008).
Lead excretion is also independent of the route of exposure. Absorbed lead may be excreted through several ways but the main ones are urine and feces (ATSDR, 2007b; Liu et al., 2008). Lead may also be excreted through sweat, saliva, hair, and nails (ATSDR, 2007b).
Lead is considered one of the most dangerous toxic metals especially due to the amount and severity of the effects that it can cause. Those effects are dependable on the dose and duration of exposure (Lindo and Silvestre, 2010; Liu et al., 2008). Nervous system, bone marrow and kidneys are probably the most affected by lead but this element may also damage hematopoietic and reproductive systems (Lindo and Silvestre, 2010; Liu et al., 2008; Sharma et al., 2011). Similarly to copper and iron, lead is also capable to cause oxidative stress by inducing the generation of reactive oxygen species (Sharma et al., 2011).
Relatively to its carcinogenicity lead in inorganic form is classified as a probable human carcinogen while lead in organic form has not yet been classified (Donadini et al., 2008).
1.2.6. Zinc
Zinc is one of the most common elements in the Earth’s crust and it can be found just about everywhere from air, water, soil up to the most varied foods (ATSDR, 2005). In its pure form zinc is a silvered solid which reacts violently when exposed to moist air (ATSDR, 2005; Lindo and Silvestre, 2010). This metal has several applications especially in metallurgic industry where it is used to produce alloys (ATSDR, 2005; Liu et al., 2008). Zinc is usually found combined with other elements forming oxides, chlorides and sulphide compounds which can be used to make paints, rubber, drugs and others (ATSDR, 2005). It is an essential element due to its biological functions in the human body. Is an important component of hundreds of enzymes and transcription factors being required for protein and DNA synthesis, cell division and it can act as an antioxidant. Zinc is also necessary in cell membrane integrity, bone and teeth mineralization, normal taste and wound healing. It also supports normal growth and development during pregnancy, childhood and adolescence (Fraga, 2005; Liu et al., 2008; Osredkar and Sustar, 2011; Valko et al., 2005). Unlike copper and iron, zinc does not participate in redox reactions (Lindo and Silvestre, 2010).