The Burden of the Minimum Wage
Evidence from Portugal
Tiago Teixeira
Dissertation written under the supervision of Joana Silva
Dissertation submitted in partial fulfilment of requirements for the
Msc in Economics
at the
Universidade Católica Portuguesa
April 2020
The Burden of the Minimum Wage
Evidence from Portugal
Tiago Teixeira
April 22, 2020
Supervisor: Joana Silva
Abstract
This thesis examines the elasticity of employment and wages to changes in the minimum wage and the incidence of the costs of these changes between consumers and firm owners, using firm-level financial information linked to longitudinal employer-employee data from Portugal between 2008 and 2017. It exploits differences in firm exposure to changes in the minimum wage to uncover the sensitivity of employment and wages to this policy and the main margins of adjustment of firms. It finds that more exposed firms experience higher growth in average wage and a larger decline in employment. The employment elasticities with respect to average wages range from -0.48 to -0.56 over 2008–17. Subperiod analysis shows that the employment elasticity varies considerably, with the increases in the minimum wage resulting in larger negative effects on employment during the crisis period of 2010 to 2014, when firms were arguably less able to transfer the burden to consumers in the form of higher prices. During this period, the employment elasticity was -0.77. In terms of incidence, during the period of positive growth (2008–09), the increase in the margin between revenues and materials suggests that most of the costs of the minimum wage increases were borne by consumers. In the subsequent periods, the majority of the minimum wage costs was borne by firm owners, as firms suffer a decrease in profits that offset the increase in labor costs caused by the higher minimum wage.
O Peso do Salário Mínimo
O Caso Português
Tiago Teixeira
22 de Abril de 2020
Supervisor: Joana Silva
Resumo
Esta tese analisa as elasticidades do emprego e salários a mudanças no salário mínimo e a sua incidência nos consumidores e empresários em Portugal entre 2008 e 2017. Através de uma base de dados longitudinal que combina informação de trabalhadores e empresas, esta tese explora as diferenças na exposição das empresas a um aumento do salário mínimo para estimar os efeitos deste no emprego, salários e nas principais margens das empresas. Os resultados indicam que empresas com maior exposição registam maior crescimento no salário médio e um declínio mais acentuado no emprego. As estimativas para a elasticidade do emprego relativa ao salário médio variam entre -0.48 e -0.56 para o período 2008-17. A análise de vários períodos mostra que estas elasticidades variam consideravelmente, sendo que o aumento do salário mínimo foi mais prejudicial para o emprego no período de crise 2010-14. Quando as empresas estavam menos aptas a transferir os custos do salário mínimo para os consumidores através de preços mais altos. Durante este período, a elasticidade do empego foi -0.77. Em termos de incidência, durante o período de crescimento económico 2008-09, o aumento das margens das empresas indica que a maioria dos custos do salário mínimo foram suportados pelos consumidores. Nos períodos seguintes, a maioria dos custos do salário mínimo foram suportado pelos empresários, sendo que a redução registada nos lucros compensou o aumento dos gastos com pessoal causados pelo aumento do salário mínimo.
Acknowledgements
First, and foremost, I would like to thank my supervisor, Professor Joana Silva, for all the invaluable guidance and help throughout these months. I am truly grateful.
I would also like to thank all my colleagues from the Master in Economics, whom I had the pleasure to share this journey with.
Contents
1. Introduction ... 1
2. Institutional Context: Evolution of the Minimum Wage ... 3
3. Data ... 5
4. Empirical Approach ... 8
5. Results ... 10
5.1. Employment and Wage Elasticities to Changes in the Minimum Wage ... 10
5.2. Heterogeneity in Employment and Wage Elasticities ... 12
5.3. Differentiated Elasticities of Employment in Good and Bad times. ... 15
6. The Incidence of the Minimum Wage ... 16
7. Robustness Checks and Threats to Identification ... 19
8. Conclusion ... 22
9. References ... 22
1. Introduction
A large body of research studies the empirical effects of changes in the minimum wage on labour market outcomes and who bears the costs of these changes between consumers and firm owners. The results (on the magnitudes and direction) are mixed. Stigler (1946) and Neumark and Wascher (2010) find that raising the minimum wage has negative effects on employment, particularly among low-skilled workers. In contrast, Card and Krueger (1992, 1995) and Dube, Lester, and Reich (2010) find insignificant or even positive effects. In a recent meta-analysis, Wolfson and Belman (2019) conclude that the effects of increases in the minimum wage on employment are small and potentially non-existent.The results on the incidence of the minimum wage between consumers and firm owners are also controversial. Card and Krueger (1995) and Aaronson and French (2007) find that consumers are the ultimate payers of the minimum wage through higher output prices. In contrast, Draca, Machin, and Van Reenen (2011) find that firm owners bear most of the burden in the form of lower profits.
A number of theoretical explanations for such effects have been advanced. Neoclassical models emphasize that an increase in the minimum wage generates unemployment, especially among low-wage workers. In a competitive labor market with homogeneous workers, equilibrium wage and employment are obtained by the intersection of the demand and supply curves. The employers minimize costs and choose the amount of labor input that sets the marginal product of a worker equal to the marginal cost, that is, the wage. When a minimum wage is imposed above the equilibrium wage, employers need to adjust to ensure cost minimization. Firms are forced to reduce the number of employees or working hours, as the marginal product of labor is inferior to its marginal cost (the minimum wage). Alternatively, employers can increase labor productivity by investing in other factors of production and/or changing the production techniques. This compelling and simple argument suggests that workers bear, at least in part, the costs of minimum wage policies. In contrast, in the monopsony case, the employer enjoys a certain degree of market power, and the imposition of a minimum wage between the monopsonistic wage and the competitive wage can improve employment (Gilroy and Kohen, 1982).
In this thesis, I present new evidence on the employment and wage elasticities to the minimum wage and the incidence of the costs between workers and firms by exploiting increases in the minimum wage in Portugal and the various margins of adjustment of firms. I use a rich combination of firm-level financial information linked to longitudinal
employer-employee data from Social Security records between 2007 and 2017. During this period, the minimum wage grew approximately 23% in real terms and 38% in nominal terms in Portugal. Rather than focusing on the aggregate effects across regions, this thesis focuses on the unequal distribution of effects across firms. It assesses elasticities and incidence, pairing the firm-shock that the minimum wage change implies and firms’ reactions. Specifically, firms with more workers affected by the minimum wage increase are likely to suffer more than those firms with fewer affected workers. This thesis estimates a panel regression based on the year-to-year firm-level relationship between the fraction of workers who earned below the new minimum wage in the year before the change and the percentage change in the outcome of interest during that year. The results show that there is a negative effect on employment resulting from the increase in the minimum wage and a larger positive effect on firms’ average wage. Employment elasticities range between -0.48 and -0.56. The analysis of a 10-year time span also allows for uncovering how the relative magnitudes of these effects (elasticities) changed over time. Employment was particularly sensitive to changes in the minimum wage during the crisis period of 2010 to 2014, when firms arguably were less able to transfer the burden to consumers in the form of higher prices, rather than in the positive growth periods that preceded and followed it. In terms of incidence, I find that during the period of positive growth (2008–09), most of the cost of the minimum wage increase was borne by consumers. Yet, during the crisis period, the majority of the minimum wage costs was borne by firm owners, and this occurred because they suffered a decrease in profits due to the increase in labor costs, which were caused by the higher minimum wage. In particular, during that period, the lion share of the increased cost of labor was covered by lower profits, while the remaining was paid by consumers in the form of higher revenue.
This thesis is perhaps most closely related to a recent study by Harasztosi and Lindner (2019). Using Hungarian data, the authors show that the 60% raise in the Hungarian minimum wage in real terms in 2001 led to negative, but small, employment effects that were observed even four years after the reform. Around 75% of the minimum wage increase was paid by consumers and 25% by firm owners. In this thesis, the results for the period of positive growth are consistent with those of Harasztosi and Lindner (2019). As expected, the results differ in magnitude and are larger in the case of Hungary, given the size and nature of the policy reform.1 1Other papers have estimated the employment elasticities of the minimum wage using different methodologies.
In particular, Centeno, Duarte e Novo (2013) estimate cross-sections of worker-level effects focusing on how they differ throughout the worker position on the wage distribution for the years of 2003 to 2010 using data from
Yet, the incidence results during the crisis subperiod are different and open important avenues for future research. Relative to Harasztosi and Lindner’s (2019) paper, the main advantage of the current thesis is that countries rarely do one-time increases in this magnitude of the minimum wage, but rather they impose year-to-year progressive increases, as in Portugal. Firms’ reactions to a one-time large change are arguably different from their reactions to progressive changes. Moreover, their reactions will depend on factor-market institutions (e.g., collective bargaining, or fair/efficiency wages, which may be particularly relevant in Portugal), but also on the overall performance of the economy. The fact that in the Portuguese case the period under analysis covers crisis and non-crisis years helps to strengthen the argument that the minimum wage–employment relationship largely depends on rent sharing between firms and workers and the ability of firms to increase output prices. Overall, however, my findings remain consistent with the broader argument in Harasztosi and Lindner (2019) but bring additional insights on the incidence of the minimum wage increase between firms and workers and highlight the importance of differencing elasticities of employment to minimum wage changes in good and bad times.
The thesis proceeds as follows. Section 2 describes the evolution of the minimum wage in Portugal during the period of the analysis. Section 3 presents the data. Section 4 describes the empirical methodology. Sections 5 and 6 present the evidence on the employment and wage effects of the minimum wage and the various margins of adjustment by firms. Section 7 explore further robustness checks and threats to identification. And section 8 concludes.
2. Institutional Context:
Evolution of the Minimum
Wage
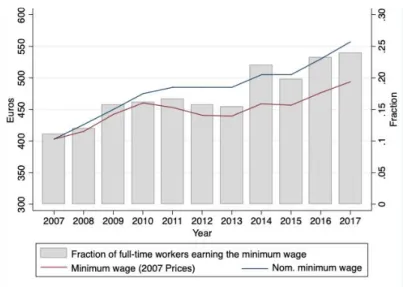
The Minimum Wage policy (or Retribuição Mínima Mensal Garantida – RMMG) was introduced in 1974 in Portugal and, since then, has undergone many adjustments. By law, the nominal minimum wage is revised on an annual basis. It is determined by considering, amongst other factors, the evolution of the cost of living and productivity. The minimum wage is set per month and has a 40 hours/week reference, corresponding to a full-time job in Portugal. Figure 1 presents the evolution of the minimum wage in real terms in Portugal over 2007–17.
wage distribution between 1973 and 1979 in the US. Despite the differences in methodology, this thesis’ elasticity estimates for the period of positive growth in Portugal are in line with their findings. In terms of magnitude, they are similar to those obtained in Portugal and the US and smaller than the one obtained for France, a country with a high minimum wage.
During 2007–17, the minimum wage was revised on seven occasions(every year except 2012, 2013, and 2015). During this period, the nominal minimum wage grew approximately 38.21%, from €403 to €557. The real growth rate was 22.54%. From 2007 to 2010, the nominal minimum wage grew by 17.87%, averaging to 5.96% per year. In the same period, the
purchasing power of the minimum wage rose by 14.21%.From 2011 to 2014, the minimum
wage grew 6.32% in nominal terms. That translated into a 0.27% loss in real terms in the value of the minimum wage. Subsequently, from 2015 to 2017, the minimum wage registered growth of 10.30% in nominal terms. On average, it grew around 7.59% per year. The overall increase in real terms was 12.02%.
Apart from the obvious increase in the disposable income of those workers who earn the minimum wage, the successive revisions of the minimum wage may have had other consequences in the Portuguese economy. In figure 1, the grey bars represent the share of
full-time workers earning the minimum wage. The share of minimum wage earners wentfrom just
above 10% in 2007 to nearly 25% in 2017 (right axis), which means that close to one-fourth of all full-time workers were pushed to the left tail of the wage distribution. These numbers highlight the increasing coverage of this policy.
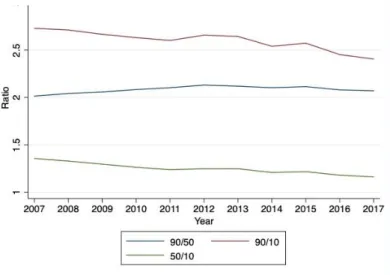
Figure 2 presents the dispersion of the wage distribution. It shows the evolution of the 90th/50th, 90th/10th, and 50th/10th percentile ratios during 2007 to 2017. The minimum wage always coincides with the 10th percentile of the wage distribution. Its increase contributes to a
Source: Computed using Pordata and Quadros do Pessoal Dataset.
Note: The share of full-time workers earning the minimum wage is obtained from the worker-level Quadros de Pessoal dataset. All full-time workers (with 40 weekly hours of work) are considered, with the exception of those who report a base salary below the minimum wage due to extraordinary employment conditions.
reduction of the 10th percentile-median wage ratio, as shown in Figure 2. Similarly, the increase in the minimum wage may have contributed to a reduction of the gap between the bottom 10th percentile and the highest wages, depicted by the decline in the 90/10 ratio. These figures point to decreasing wage inequality in overall terms (in the entire distribution) and in the left tail of the distribution. These dynamics highlight the growing relevance of the minimum wage in the Portuguese economy and the importance of studying its effects, as developed in this thesis in the next sections.
3. Data
The analysis conducted for this thesis is based on two main data sets:
(i) The Quadros de Pessoal (QP) data set on worker and firm characteritics, collected by the Instituto Nacional de Estatística (INE) and Direção-Geral de
Estatística da Educação e Ciência (DGEEC). This database is a census of all
firms with at least one employed worker (trabalhador por conta de outrém) and contains linked information on each worker. The data set includes year-by-year information on firm sales, sector, and location. For the same year and firm, it also includes information on each worker’s monthly wage, weekly hours Source: Computed using the Quadros do Pessoal dataset.
Note: All full-time workers (with 40 weekly hours of work) are considered, with the exception of those who report a base salary below the minimum wage due to extraordinary employment conditions.
Figure 2: Evolution of the ratios of the different percentiles of the wage distribution
worked, tenure, education, occupation, and gender. It has annual periodicity and refers to October of the respective year.
(ii) The Sistema de Contas Integradas das Empresas (SCIE), also provided by INE
and DGEEC. This database is produced on an annual basis and includes companies’ administrative financial information as reported for fiscal and accounting purposes. For all companies registered as societies, it provides a detailed income statement. For this reason, the analysis is limited to this set of firms. The SCIE data set includes information on key indicators used in the analysis, including business volume, operating profit (EBIT), labor costs, expenses for materials (CMVMC), and sector/industry classifications.
Measures of firm-level employment and wages were computed using worker-level
Quadros de Pessoal (QP). Average employment was measured by estimating
full-time-equivalent employment (FTE) and wage using the average real wage of the firm’s workers. The key independent variable in this analysis—firm exposure to an increase in the minimum wage (FE), measured by the share of workers whose salaries are below next year’s new minimum wage—was also computed using worker-level QP. Firm-level QP provides other firm-specific characteristics, such as firm age, entity type, and geographical location. Worker-level QP is collapsed by firm and then linked with firm-level QP. All firms identified in the worker-level data set are matched in the firm-level data set.
The SCIE data set provides important information to control for firm performance and characteristics. It is linked with Quadros de Pessoal, using the unique firm identifier variable
NPC_FIC,and then complemented with firm-level information on imports and exports from
the Comércio Internacional (CI) data set, which is also collected by INE and DGEEC. Some groups of firms or sectors of the economy are not considered in the analysis due to data unavailability. That is the case of public institutions and companies employing only domestic workers, which are not incorporated in the Quadros de Pessoal data set, and financial institutions and nonprofit organizations, which are excluded from the SCIE database. Lastly, due to poor data quality, primary activities (agriculture, fishing, and mining) are also dropped from the analysis.
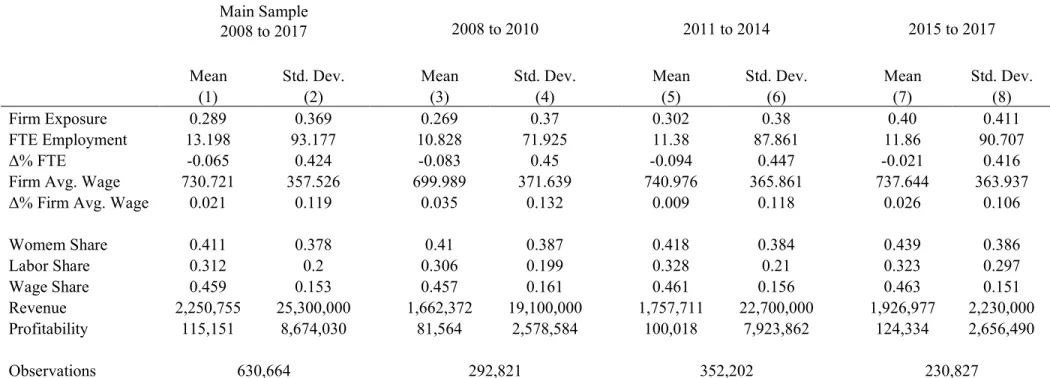
Table 1: Summary Statistics
Main Sample 2008 to 2010 2011 to 2014 2015 to 2017 2008 to 2017Mean Std. Dev. Mean Std. Dev. Mean Std. Dev. Mean Std. Dev.
(1) (2) (3) (4) (5) (6) (7) (8)
Firm Exposure 0.289 0.369 0.269 0.37 0.302 0.38 0.40 0.411 FTE Employment 13.198 93.177 10.828 71.925 11.38 87.861 11.86 90.707 Δ% FTE -0.065 0.424 -0.083 0.45 -0.094 0.447 -0.021 0.416 Firm Avg. Wage 730.721 357.526 699.989 371.639 740.976 365.861 737.644 363.937 Δ% Firm Avg. Wage 0.021 0.119 0.035 0.132 0.009 0.118 0.026 0.106
Womem Share 0.411 0.378 0.41 0.387 0.418 0.384 0.439 0.386 Labor Share 0.312 0.2 0.306 0.199 0.328 0.21 0.323 0.297 Wage Share 0.459 0.153 0.457 0.161 0.461 0.156 0.463 0.151 Revenue 2,250,755 25,300,000 1,662,372 19,100,000 1,757,711 22,700,000 1,926,977 2,230,000 Profitability 115,151 8,674,030 81,564 2,578,584 100,018 7,923,862 124,334 2,656,490 Observations 630,664 292,821 352,202 230,827
Note: The table presents summary statistics for key firm characteristics in the different samples used in the study of firm-level employment and wage effects. All figures are in constant prices (2017).
The main sample in this analysis is formed by all companies matched in Quadros de
pessoal and SCIE that were operating in 2006 and 2007. It contains 128.672 firms and
corresponds to 630.664 observations spread over 2008–17. In Table 1, columns (1) and (2), I report the sample mean and standard deviation for some of the firm characteristics. The average firm in the sample has approximately 13 full-time workers, pays an average monthly wage of €730 (in 2017 prices), and has 29% of its workers directly affected by an increase in the minimum wage. Moreover, for the average firm, around 41% of the workforce are women, labor costs are approximately 31% of business volume, and wages represent 46% of labor costs.2
4. Empirical Approach
In the first part of the analysis, I estimate the elasticity of employment and wages to minim wage changes at the firm level. I establish a relationship between firms’ exposure to the
minimum wage and changes in employment and wages.Firm exposure (FE) to an increase in
the minimum wage, the key explanatory variable in the model, is measured by the share of workers in the firm whose salaries are below next year’s minimum wage. In other words, FE is the fraction of workers in the firm who are directly affected by the new minimum wage.3 I closely follow Machin, Manning, and Rahman (2003) and Draca, Machin, and Van Reenen (2011) and estimate baseline regression models of the following form:
𝑦𝑖𝑡− 𝑦𝑖𝑡−1
𝑦𝑖𝑡−1 = 𝛼𝑡+ 𝛽𝑡𝐹𝐸𝑖𝑡−1+ 𝜆𝑡𝑋𝑖𝑡+ 𝜀𝑖𝑡 , (1)
where i and t are firm and year indexes, respectively; the dependent variable is the firm’s percentage change in outcome y between the year t-1 and t, which takes values between -1 and 1 (-100% and 100%); FEit-1 is firm exposure to the minimum wage increase in the previous year; Xit is a set of controls for firm characteristics and performance which vary flexibly over time.
2For the study of heterogeneity by sector, I restrict the sample to the listed sectors. Appendix table A1 presents
summary statistics of that sample. For the study of the incidence of the minimum wage, I restrict the sample to the manufacturing sector. Appendix table A2 presents summary statistics of that sample. It comprises 22.711 firms and corresponds to 118.210 observations. On average, compared with the full sample, manufacturing firms have more full-time employees, 22, and pay a lower average monthly wage of €708. In addition, manufacturing firms are on average more exposed to a minimum wage increase, with 34% of their employees directly affected by it. For the average manufacturing firm, approximately 36% of its workforce is women.
They include firm age, industry, two-year average export share, two-year average profitability (EBIT), two-year average labour share (labour costs divided by business volume), two-year average share of wage costs in total labour costs, and sector-level two-year average import share. 𝜀𝑖𝑡 is a zero-mean error term. All regressions include year dummies and are weighted by the natural logarithm of firms’ FTE employment to avoid overestimation of the employment effects caused by small firms.
The central assumption behind this model is that, in the absence of a minimum wage increase, 𝛽𝑡 should not be significantly different from zero. That means there is no reason for firms with different levels of exposure to an increase in the minimum wage to behave differently, in terms of employment and wages, when the minimum wage does not change (ceteris paribus). Although this assumption cannot be tested, the results should support the existence of a different behaviour when the minimum wage increases.
In the second part of the thesis, I am interested in understanding who bears the costs of the minimum wage increases. The study of the minimum wage incidence is based on the following accounting identity:
𝑃𝑟𝑜𝑓𝑖𝑡𝑠𝑡≡ 𝑅𝑒𝑣𝑒𝑛𝑢𝑒𝑡− 𝑀𝑎𝑡𝑒𝑟𝑖𝑎𝑙𝑠𝑡− 𝐿𝑎𝑏𝑜𝑢𝑟𝐶𝑜𝑠𝑡𝑠𝑡− 𝑂𝑡ℎ𝑒𝑟𝑠𝑡 (2)
Rearranging and excluding others, I get: Δ 𝐿𝑎𝑏𝑜𝑢𝑟𝐶𝑜𝑠𝑡𝑠 𝑅𝑒𝑣𝑒𝑛𝑢𝑒𝑡 = 𝛥𝑅𝑒𝑣𝑒𝑛𝑢𝑒 𝑅𝑒𝑣𝑒𝑛𝑢𝑒𝑡 − ∆𝑀𝑎𝑡𝑒𝑟𝑖𝑎𝑙𝑠 𝑅𝑒𝑣𝑒𝑛𝑢𝑒𝑡 − ∆𝑃𝑟𝑜𝑓𝑖𝑡𝑠 𝑅𝑒𝑣𝑒𝑛𝑢𝑒𝑡 (3)
If the results show that firms increase wages in response to a higher minimum wage, then the increase must be reflected in the evolution of firms’ spending. Firms with higher exposure must experience a larger surge in labour costs. Equation (3) explains how firms may react to this surge in labour costs. The increase may be supported by firm owners, in which case, the variation in profits should offset the variation in labour costs. And/or the costs may be passed on to consumers, translating into a bigger margin between revenues and materials. To estimate the relations between firms’ exposure to a minimum wage increase and the change in labour costs, revenues, materials, and profits, I use an adaptation of the original model in equation (1). The variation in outcome y is weighted on the firms’ revenues to make the estimates directly comparable. I estimate a model as follows:
where i and t are firm and time indexes, respectively; and all the variables have the same meaning as in the original model in equation (1). The regressions are weighted by the natural logarithm of firms’ revenues.
5. Results
5.1. Employment and Wage Elasticities to Changes in the
Minimum Wage
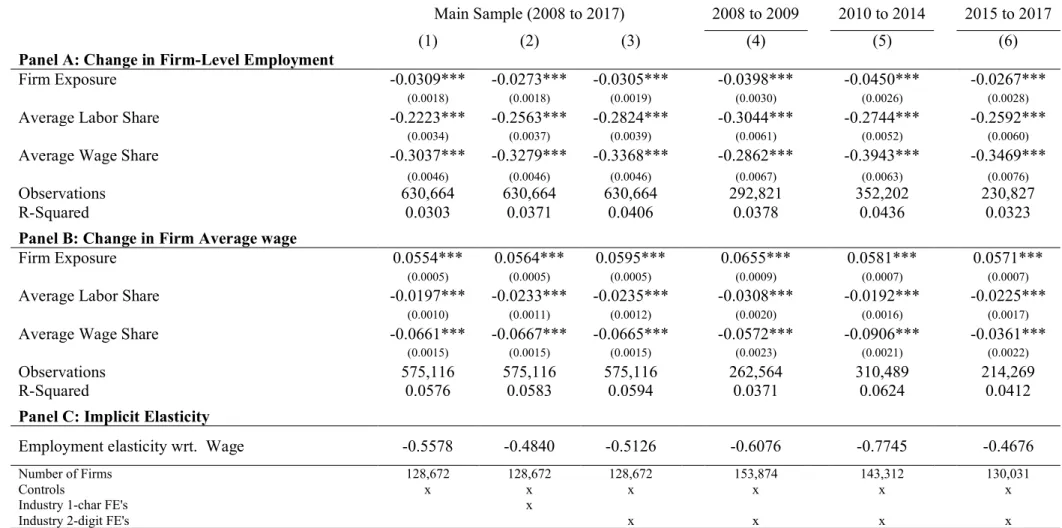
The estimates of the employment elasticities (equation 1) are summarized in Table 2, panel A. There is a negative relation between firms’ fraction of workers directly affected by an increase in the minimum wage and the evolution of employment. In column (1), the estimate indicates that firms with a higher share of their labor force directly affected by the minimum wage changes had a larger reduction in employment. Column (2) includes 1-digit industry effects and column (3) includes instead 2-digit industry effects. Results remain qualitatively similar. Note that because of the way in which employment is estimated, these results reflect not only the effect of firms’ decisions to dismiss workers (lay-offs), but also that of firms that go out of business (closure).
Table 2, panel B, presents the estimates of the wage elasticity (equation 1). The model specifications are the same and in panel B, but in the event of firms closing, the percentage change in the average wage cannot be computed. For this reason, the study of wage effects comprises only companies that remain operational between year t-1 and t. The results, presented in Table 2, panel B, illustrate a positive relation between firms’ share of workers directly affected by the minimum wage and the percentage change in the firm-level average wage. In column (1), the estimate indicates that firms’ average wage increase was 5.5 pp. With 1-digit industry effects (column 2), or 2-digit industry effects (column 3), the estimate is approximately the same.
These findings show that firms that are more exposed to the minimum wage register, on average, a more accentuated decline in employment; but also register higher growth in the average worker’s wage.
𝑦𝑖𝑡− 𝑦𝑖𝑡−1
Table 2: Employment and Wage Elasticities
Main Sample (2008 to 2017) 2008 to 2009 2010 to 2014 2015 to 2017
(1) (2) (3) (4) (5) (6)
Panel A: Change in Firm-Level Employment
Firm Exposure -0.0309*** -0.0273*** -0.0305*** -0.0398*** -0.0450*** -0.0267***
(0.0018) (0.0018) (0.0019) (0.0030) (0.0026) (0.0028)
Average Labor Share -0.2223*** -0.2563*** -0.2824*** -0.3044*** -0.2744*** -0.2592***
(0.0034) (0.0037) (0.0039) (0.0061) (0.0052) (0.0060)
Average Wage Share -0.3037*** -0.3279*** -0.3368*** -0.2862*** -0.3943*** -0.3469***
(0.0046) (0.0046) (0.0046) (0.0067) (0.0063) (0.0076)
Observations 630,664 630,664 630,664 292,821 352,202 230,827 R-Squared 0.0303 0.0371 0.0406 0.0378 0.0436 0.0323
Panel B: Change in Firm Average wage
Firm Exposure 0.0554*** 0.0564*** 0.0595*** 0.0655*** 0.0581*** 0.0571***
(0.0005) (0.0005) (0.0005) (0.0009) (0.0007) (0.0007)
Average Labor Share -0.0197*** -0.0233*** -0.0235*** -0.0308*** -0.0192*** -0.0225***
(0.0010) (0.0011) (0.0012) (0.0020) (0.0016) (0.0017)
Average Wage Share -0.0661*** -0.0667*** -0.0665*** -0.0572*** -0.0906*** -0.0361***
(0.0015) (0.0015) (0.0015) (0.0023) (0.0021) (0.0022)
Observations 575,116 575,116 575,116 262,564 310,489 214,269 R-Squared 0.0576 0.0583 0.0594 0.0371 0.0624 0.0412
Panel C: Implicit Elasticity
Employment elasticity wrt. Wage -0.5578 -0.4840 -0.5126 -0.6076 -0.7745 -0.4676
Number of Firms 128,672 128,672 128,672 153,874 143,312 130,031
Controls x x x x x x
Industry 1-char FE's x
Industry 2-digit FE's x x x x
Note:***p<0,01, **p<0,05, *p<0,1. Robust standard errors are shown in parentheses bellow the coefficients. The table describes the relation between firms' share of worker earning a salary bellow next year's minimum wage (Firm Exposure) and their employment and average wage outcomes. The experiment considers only full-time workers. The employment effect, in Panel A, includes both firms' closure and layoffs while wage effects, in Panel B, include only layoffs. Columns 1 to 3 analyze the main sample of firms, formed by all companies operating in 2006 and 2007 with complete information in the data bases. Columns 4 to 6 analyze period samples formed by all companies operating for at least 2 years before the first year of the respective time window and with complete information in the data bases. In Panel C are reported the respective employment elasticities with respect to the wage. Regressions include year dummies and are weighted by the natural logarithm of employment.
The wage changes are of greater magnitude than the employment changes to a variation in the minimum wage, suggesting that firms respond to the higher minimum wage not only by cutting employment, but also by raising wages.The estimates of the employment elasticity with respect to wages (average wage), or simply the ratio between the estimated employment and wage effects, illustrates this point. These are presented in Table 2, panel C. Overall, the employment effects are approximately half as strong as the wage effects, as the elasticity estimations range from -0.48 to -0.56. In the benchmark specification, with 2-digit industry effects, the implied elasticity is -0.51.
5.2. Heterogeneity in Employment and Wage
Elasticities
In this section, I explore the heterogeneity in employment and wage sensitivity to changes in the minimum wage across different types of firms. First, I compare firms’ responses depending on their size, as larger, more productive firms, might be more resilient. I split the sample into two groups, small firms, with fewer than 10 employees, and medium and large firms, with 10 or more employees. In the main sample, there are 101.826 small firms and 26.846 medium and big firms. In Table 3, I show the estimates of the employment and wage effects for these two groups of firms. In general, the results indicate that small firms are relatively more responsive to increases in the minimum wage, in terms of employment and wages. The employment effects are on average 73% more severe in small firms than in medium and large firms. The wage effects prove to be 10% stronger in small firms than in medium and large firms. This finding is particularly relevant in the Portuguese context where small firms account for the lion share of employment. Specifically, in the QP data set from 2007, there are 272.438 firms in the estimation sample employing at least one full-time worker. Of those, 236.599 (87%) are small firms, employing approximately 32% of all full-time employees.
Second, I examine the heterogeneity in employment and wage elasticities across industries, as their reliance on low wage workers differs. I focus on four major sectors: manufacturing, retail, hospitality, and transportation. These sectors correspond to sections C, G, H, and I of the CAE-Rev.3, respectively. Table 4 presents the estimates of employment and wage elasticities in the four industries. For each industry, I present estimations with and without 2-digit industry effects.
Table 3: Heterogeneous Response in Employment and Wages by Firm Size
Medium and Big Firms Small Firms
(1) (2) (3) (4) (5) (6)
Panel A: Change in Firm-Level Employment
Firm Exposure -0,0294*** -0,0187*** -0,0178*** -0,0347*** -0,0338*** -0,0391*** (0.0039) (0.0040) (0.0045) (0.0020) (0.0020) (0.0021)
Average Labour Share -0,2136*** -0,2480*** -0,2709*** -0,2352*** -0,2732*** -0,3048*** (0.0057) (0.0061) (0.0065) (0.0040) (0.0044) (0.0046)
Average Wage Share -0,1515*** -0,1787*** -0,1870*** -0,3955*** -0,4117*** -0,4211*** (0.0090) (0.0094) (0.0094) (0.0050) (0.0050) (0.0051)
Observations 148,649 148,649 148,649 482,015 482,015 482,015 R-Squared 0.0284 0.0367 0.0413 0.0350 0.0407 0.0444
Panel B: Change in Firm Average wage
Firm Exposure 0,0526*** 0,0521*** 0,0560*** 0,0571*** 0,0591*** 0,0608*** (0.0010) (0.0011) (0.0012) (0.0045) (0.0005) (0.0005)
Average Labour Share -0,0149*** -0,0164*** -0,0175*** -0,0230*** -0,0292*** -0,0290*** (0.0017) (0.0018) (0.0020) (0.0010) (0.0013) (0.0014)
Average Wage Share -0,0567*** -0,0599*** -0,0607*** -0,0715*** -0,0708*** -0,0704*** (0.0029) (0.0031) (0.0031) (0.0016) (0.0016) (0.0016)
Observations 140,250 140,250 140,250 434,866 434,866 434,866 R-Squared 0.0562 0.0569 0.0588 0.0584 0.0594 0.0602
Panel C: Implicit Elasticitiy
Employment elasticity
wrt. Wage -0.5589 -0.3589 -0.3179 -0.6561 -0.5719 -0.6431
Number of firms 26,846 26,846 26,846 101,826 101,826 101,826
Controls x x x x x x
Industry 1-char FE's x x
Industry 2-digit FE's x x
Note:***p<0,01, **p<0,05, *p<0,1. Robust standard errors are shown in parentheses bellow the coefficients. The table describes the relation between firms' share of worker earning a salary bellow next year's minimum wage (Firm Exposure) and their employment and average wage outcomes. The experiment considers only full-time workers. The employment effect, in Panel A, includes both firms' closure and layoffs while wage effects, in Panel B, include only layoffs. Columns 1 to 3 analyze medium/big firms with ten or more full-time employees in 2007. While columns 4 to 6 analyze small firms with less than ten full-time employees in 2007. In Panel C are reported the respective employment elasticities with respect to wages. Regressions include year dummies and are weighted by the natural logarithm of employment.
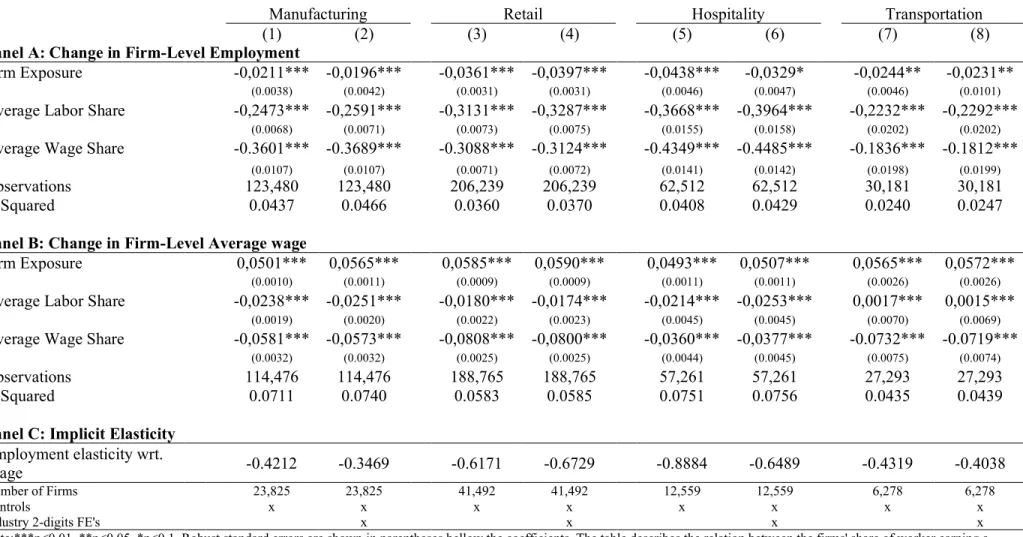
Table 4: Heterogeneous Response in Employment and Wages by Sector
Manufacturing Retail Hospitality Transportation (1) (2) (3) (4) (5) (6) (7) (8)
Panel A: Change in Firm-Level Employment
Firm Exposure -0,0211*** -0,0196*** -0,0361*** -0,0397*** -0,0438*** -0,0329* -0,0244** -0,0231**
(0.0038) (0.0042) (0.0031) (0.0031) (0.0046) (0.0047) (0.0046) (0.0101)
Average Labor Share -0,2473*** -0,2591*** -0,3131*** -0,3287*** -0,3668*** -0,3964*** -0,2232*** -0,2292***
(0.0068) (0.0071) (0.0073) (0.0075) (0.0155) (0.0158) (0.0202) (0.0202)
Average Wage Share -0.3601*** -0.3689*** -0.3088*** -0.3124*** -0.4349*** -0.4485*** -0.1836*** -0.1812***
(0.0107) (0.0107) (0.0071) (0.0072) (0.0141) (0.0142) (0.0198) (0.0199)
Observations 123,480 123,480 206,239 206,239 62,512 62,512 30,181 30,181 R-Squared 0.0437 0.0466 0.0360 0.0370 0.0408 0.0429 0.0240 0.0247
Panel B: Change in Firm-Level Average wage
Firm Exposure 0,0501*** 0,0565*** 0,0585*** 0,0590*** 0,0493*** 0,0507*** 0,0565*** 0,0572***
(0.0010) (0.0011) (0.0009) (0.0009) (0.0011) (0.0011) (0.0026) (0.0026)
Average Labor Share -0,0238*** -0,0251*** -0,0180*** -0,0174*** -0,0214*** -0,0253*** 0,0017*** 0,0015***
(0.0019) (0.0020) (0.0022) (0.0023) (0.0045) (0.0045) (0.0070) (0.0069)
Average Wage Share -0,0581*** -0,0573*** -0,0808*** -0,0800*** -0,0360*** -0,0377*** -0.0732*** -0.0719***
(0.0032) (0.0032) (0.0025) (0.0025) (0.0044) (0.0045) (0.0075) (0.0074)
Observations 114,476 114,476 188,765 188,765 57,261 57,261 27,293 27,293 R-Squared 0.0711 0.0740 0.0583 0.0585 0.0751 0.0756 0.0435 0.0439
Panel C: Implicit Elasticity
Employment elasticity wrt.
Wage -0.4212 -0.3469 -0.6171 -0.6729 -0.8884 -0.6489 -0.4319 -0.4038
Number of Firms 23,825 23,825 41,492 41,492 12,559 12,559 6,278 6,278
Controls x x x x x x x x
Industry 2-digits FE's x x x x
Note:***p<0,01, **p<0,05, *p<0,1. Robust standard errors are shown in parentheses bellow the coefficients. The table describes the relation between the firms' share of worker earning a salary bellow next year's minimum wage (Firm Exposure) and their employment and average wage outcomes in four different industries. The experiment considers only full-time workers. The employment effect, in Panel A, includes both firms' closure and lay-offs while wage effects, in Panel B, include only lay-offs. Regressions include year dummies and are weighted by the natural logarithm of employment.
The estimated wage elasticities, in Table 4, panel B, are very similar across industries. Considering the specification with industry fixed effects, the estimates indicate excess growth of the average wage, ranging from 5.1 to 5.9 pp, in firms with more exposure relative to firms with less exposure to the minimum wage, with the hospitality sector at the lower bound and the retail sector at the upper bound of the range. On employment, in Table 4, panel A, the effects vary considerably across industries. The manufacturing sector, in columns (1) and (2), registers the lowest employment elasticities. Controlling for industry fixed effects, results point to an extra decrease of employment of nearly 2.0 pp. in more exposed firms. By contrast, in column (4), the retail sector has the strongest employment elasticity. The estimates point to an extra decrease of nearly 4.0 pp. with an increase in exposure. The estimates for the hospitality and transportation sectors are -3.3 pp. and -2.3 pp., respectively.
Given that the wage effects are identical across industries, the heterogeneity in employment effects ultimately justifies the discrepancies in the employment elasticities. In Table 4, panel C, the employment elasticities with respect to the wage range from 0.35 to -0.67 across industries. As expected, a highly reliant sector to the minim wage, the retail sector, has the highest employment elasticity, while the manufacturing and transportation sectors proved to be less responsive to the minimum wage increases, which may be related to these sectors typically being more unionized.
5.3. Differentiated Elasticities of Employment in
Good and Bad times.
The analysis developed in the previous sections examines annual elasticities for 2008– 17. In this section, I analyze separately three subperiods, 2008–09, 2010–14, and 2015–17. The main difference between the three subperiods is that the first is a period of growth in gross domestic product, while the second subperiod is instead a period of economic crisis, followed by an economic recovery in the third period. As firms’ behaviour may change with time or according to the economic conjuncture, this thesis estimates and compares the elasticities of employment and wages in each of these subperiods. Each subperiod covers at least two minimum wage raises, as there were no minimum wage increases only in 2012, 2013, and 2015. Although the employment and wage effects estimates are not directly comparable across periods, since these depend on the magnitude of the minimum wage change, the relative effect (the employment elasticity with respect to wages) is comparable across periods.
Table 2, columns (4), (5) and (6), reports the estimates of equation 1 in each of the subperiods. The table indicates that the responsiveness of employment to minimum wage changes was greater in the crisis period of 2010–14 (column 4) than in the preceding and subsequent years (columns 3 and 5). The estimated elasticity for the crisis period is -0.77, whereas the estimated elasticity is -0.61 in 2008–09 and -0.47 in 2015–17.
6. The Incidence of the Minimum Wage
In the previous section, I showed that there is a negative relationship between minimum wage increases and employment and a positive relationship between minimum wage increases and average wages. Moreover, results also indicated that wage responses are nearly twice as large as employment responses. This suggests that firms are more likely to respond to an increase in the minimum wage by raising the wages of the affected workers than dismissing them. Therefore, firms may internalize part of the costs of the higher minimum wage.
To describe how firms adjust to a higher minimum wage and, ultimately, understand who bears the costs of this policy, I proceed by analyzing firm’s various margins of adjustment, such as labour costs, revenues, and expenses for materials.
In this section, the sample is restricted to firms in the manufacturing sector, as complete information on labour costs, revenues, expenses for materials, and profits is just available for this subset of firms.
First, I study the change on firms’ total labour costs associated with the change in minimum wage, a measure of the total income distributed to workers. Using equation (1), I establish a relationship between firms’ fraction of workers affected by the minimum wage and the variation in these costs. The results, presented in Table 5, panel A, point to a clear positive relation between the share of workers affected by the minimum wage and the evolution of labour costs.
The surge in firms’ total labour costs is consistent with the finding that wage responses are of larger magnitude than employment responses. It also confirms the hypothesis that firms raise wages and, consequently, internalize some of the costs of the higher minimum wage. Additionally, these results indicate that the total income distributed to workers increases (labour costs include wage and non-wage compensations. The overall positive impact on labour costs means that the possible reduction in non-wage compensation does not offset the income gains
Next, I study the response of revenues. In Table 5, panel B, I analyze the relation between firms’ fraction of workers affected by the minimum wage and changes in revenues. As in the analysis of the employment effects (in section 5.1), these estimates reflect the cases in which firms go out of business. In those cases, the variation in revenues is assumed to be -1 (-100%).
Results point to a negative relation between firm exposure to the minimum wage and the evolution of revenues. However, it is possible that the country’s economic conjuncture during these years caused an overestimation of the negative effects of the minimum wage on revenues through firm death. For this reason, in panel C, I estimate the revenue effects without firm closures. The new estimates point to a small positive response of firms’ revenues. This positive relationship is especially strong in 2008–09, with an estimated effect of 1.79 pp. (s.e. 0.44%). For the remaining periods, 2010–14 and 2015–17, there is no discernible association between changes in the minimum wage and firm revenues. The estimates are close to zero and statistically insignificant, suggesting a different behaviour of firms.
Finally, in Table 5 panel D, I present the estimates of the association between firms’ fraction of workers affected by the minimum wage and the variation in expenses for materials. These expenses represent the inventory value sold by firms and, consequently, they are a proxy for the quantities sold. Overall, the results show a small negative relation between firm exposure to the minimum wage and expenses for materials. In the benchmark regression, expenses for materials in firms with the totality of their workforce affected by the higher minimum wage fell by 0.23 pp. (s.e. 0.37%) more than in firms without affected workers (the estimate is statistically insignificant). Nonetheless, for 2008–09, there is a clear positive impact on materials; the estimate is 0.021 pp. (s.e. 0.6%). And in 2010–14 and 2015–17, the relation is negative. The estimates are -0.14 pp. and -0.12 pp., respectively. As in the effects on revenues, firms appear to have changed the way they react to an increase in the minimum wage after 2008–09.
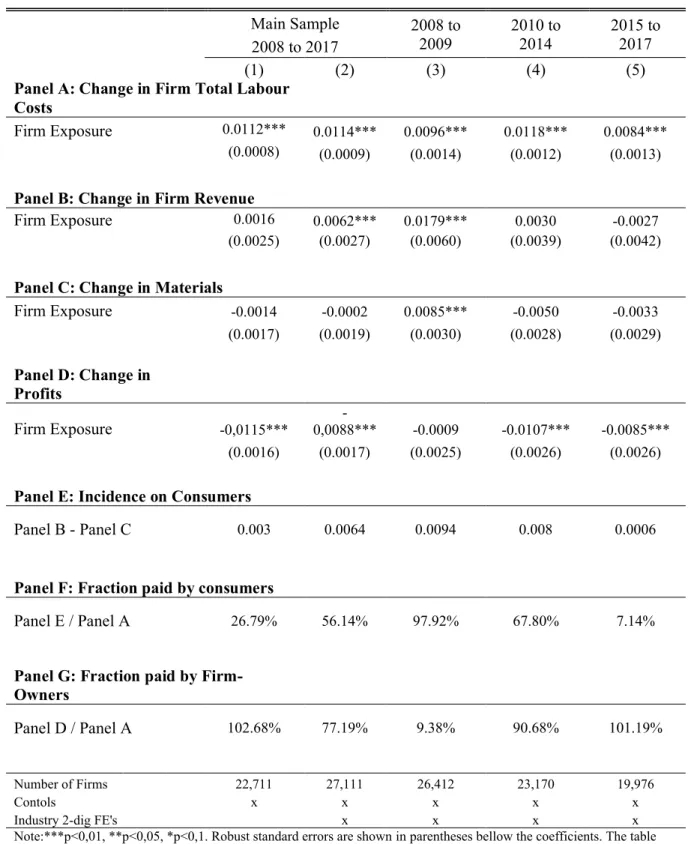
The estimates of the incidence of the minimum wage are presented in Table 6. In panel A, the results confirm the positive relationship between firm exposure to the minimum wage and the evolution of labour costs. The estimates indicate an excess surge in labour costs ranging from 1.12 to 1.14 pp in firms with all their workers affected by the minimum wage, relative to firms without affected workers. In panel B, I present the estimated effects on revenues, which are the same as those in Table 5, panel C.
Table 5: Effects on Firms' Labour Costs, Revenues and Materials
Main Sample 2008 to 2009 2010 to 2014 2015 to 2017 2008 to 2017 (1) (2) (3) (4) (5)Panel A: Change in Firm Total Labour Costs
Firm Exposure 0.0324*** 0.0344*** 0.0376*** 0.0300*** 0.0292***
(0.0019) (0.0021) (0.0035) (0.0030) (0.0034)
Observations 109,743 109,743 46,158 54,498 36,959
R-Squared 0.0593 0.0645 0.0592 0.0750 0.0601
Implicit Elasticity wrt Avg. L.
Costs 0.7133 0.7288 0.7259 0.7246 0.5748
Panel B: Change in Firm Revenue
Firm Exposure 0.0165*** - 0.0095*** - -0.0047 -0.0222*** -0.0148***
(0.0035) (0.0037) (0.0060) (0.0055) (0.0056)
Observations 118,210 118,210 50,666 59,746 39,021
R-Squared 0.0332 0.0378 0.0316 0.0304 0.0207
Implicit Elasticity wrt Avg. L.
Costs -0.3667 -0.2013 -0.0907 -0.5362 -0.2913
Panel C: Change in Firm Revenue (only
lay-offs)
Firm Exposure 0.0016 0.0062*** 0.0179*** 0.0030 -0.0027
(0.0025) (0.0037) (0.0044) (0.0039) (0.0042)
Observations 109,743 109,743 46,158 54,498 36,959
R-Squared 0.0332 0.0378 0.0406 0.0468 0.0177
Implicit Elasticity wrt Avg. L.
Costs -0.3667 -0.2013 0.3456 0.0725 -0.0531
Panel D: Change in Firm Materials
(CMVMC)
Firm Exposure -0.0068* -0.0023 0.0214*** -0.0138*** -0.0122**
(0.0035) (0.0037) (0.0060) (0.0054) (0.0057)
Observations 109,743 109,743 46,158 54,498 36,959
R-Squared 0.0250 0.0274 0.0356 0.0190 0.0155
Implicit Elasticity wrt Avg.
Labour Cost -0.1511 -0.0487 0.4131 -0.3333 -0.0240
Number of Firms 22,711 22,711 26,412 23,170 19,976
Contols x x x x x
Industry 2-dig FE's x x x x
Note:***p<0,01, **p<0,05, *p<0,1. Robust standard errors are shown in parentheses bellow the coefficients. The table describes the relation between firms' share of worker bellow the next minimum wage (Firm Exposure) and their evolution in Total Labour Costs, Revenues and Expenses in Materials. The Revenue effect in panel B includes both firms' closure and lay-offs. Only firms in the manufacturing sector are considered. Columns 1 and 2 analyze the main sample of firms, formed by all companies operating in 2006 and 2007 and with complete information in the data bases. Columns 3 to 5 analyze period samples formed by all companies operating for at least 2 years before the first year of the respective time window and with complete information in the data bases. Regressions include year dummies and are weighted by the natural logarithm of revenues.
And in panel C, I show the impact on expenses for materials. Both specifications have statistically insignificant estimates and depict a small negative change of expenses for materials. The effects on firm profits4 are reported in Table 6, panel D. The results point to a significant and negative relation between firm exposure to a minimum wage increase and the variation in profits.Next, in Table 6 panel E, I report the incidence of changes in the minimum wage on consumers, which is given by the margin between the effects on revenues and materials. Both specifications show a small positive incidence on consumers, suggesting that part of the costs of the higher minimum wage are passed on to them. To understand how the costs are shared between firm owners and consumers, I compare the incidence on each of these groups with the effect on firms’ labour costs. The fraction paid by consumers is the ratio between the incidence on consumers and the effects on labour costs (panel F). My estimations indicate that consumers pay between 27% and 56% of the minimum wage costs. The share paid by firm owners, or simply the ratio between the effect on profits and the effect on labour costs, is shown in panel G. The incidence on firm owners’ ranges from 77% to 100%. The shares for consumers and firm owners do not sum to 100%, but both specifications indicate that the bulk of the minimum wage costs are financed by firm owners.
In Table 6, columns (3) to (5), I examine how the incidence of the minimum wage varies over time. The effect on labour costs is homogeneous across periods, but firms’ adjustment to this surge in costs appears to be different in 2008–09 relative to the subsequent periods. In 2008–09, there is a significant positive association with changes in revenues (1.79 pp; s.e. 0.6%) and materials (0.85 pp; s.e. 0.3%), which means the incidence on consumers is 0.0094 and the share paid by them is around 98%. Moreover, the response in terms of profits is small and statistically insignificant (-0.09 pp; s.e. 0.25%). Thus, the share paid by firm owners is 9%. For 2010–14 and 2015–17, the responses of revenues and materials are small and insignificant. However, the estimated adjustment of profits is negative and statistically significant. My estimations indicate that the share paid by firm owners is 91% and 100% in 2010–14 and 2015– 17, respectively.
7. Robustness Checks and Threats to Identification
In the previous sections, I showed the robustness of my results to controlling for more disaggregated industry fixed effects. In this section, I examine the robustness of the results
Table 6: Incidence of the Minimum Wage
Main Sample 2008 to 2009 2010 to 2014 2015 to 2017 2008 to 2017 (1) (2) (3) (4) (5)Panel A: Change in Firm Total Labour
Costs
Firm Exposure 0.0112*** 0.0114*** 0.0096*** 0.0118*** 0.0084***
(0.0008) (0.0009) (0.0014) (0.0012) (0.0013)
Panel B: Change in Firm Revenue
Firm Exposure 0.0016 0.0062*** 0.0179*** 0.0030 -0.0027
(0.0025) (0.0027) (0.0060) (0.0039) (0.0042)
Panel C: Change in Materials
Firm Exposure -0.0014 -0.0002 0.0085*** -0.0050 -0.0033 (0.0017) (0.0019) (0.0030) (0.0028) (0.0029) Panel D: Change in Profits Firm Exposure -0,0115*** 0,0088*** - -0.0009 -0.0107*** -0.0085*** (0.0016) (0.0017) (0.0025) (0.0026) (0.0026)
Panel E: Incidence on Consumers
Panel B - Panel C 0.003 0.0064 0.0094 0.008 0.0006
Panel F: Fraction paid by consumers
Panel E / Panel A 26.79% 56.14% 97.92% 67.80% 7.14%
Panel G: Fraction paid by
Firm-Owners
Panel D / Panel A 102.68% 77.19% 9.38% 90.68% 101.19%
Number of Firms 22,711 27,111 26,412 23,170 19,976
Contols x x x x x
Industry 2-dig FE's x x x x
Note:***p<0,01, **p<0,05, *p<0,1. Robust standard errors are shown in parentheses bellow the coefficients. The table describes the relation between firms' share of worker bellow next year's minimum wage (Firm Exposure) and their evolution in Total Labour Costs, Revenues, Expenses in Materials and Profits (all relative to Revenues). The Revenue effect includes both firms' closure and lay-offs. Only firms in the manufacturing sector are considered. Columns 1 to 3 analyze the main sample of firms, formed by all companies operating in 2006 and 2007 and with complete information in the data bases. Columns 3 to 5 analyze period samples formed by all companies operating for at least 2 years before the first year of the respective time window and with complete information in the data bases. The regressions include year dummies and are weighted by the natural logarithm of revenues.
with an alternative measure of exposure to the minimum wage and specifications. Results are presented in Appendix Tables A4 and A5 and summarized here.
One potential concern with the measure of exposure to the minimum wage used in this thesis is that it might respond endogenously to the minim wage change. While the use the share computed based on employment levels in the year prior to the year minimum wage change limits this issue, I tested this further by considering two alternative measures of firm exposure. Table A5 presents the results. First, I consider a dummy variable equal to 1 for firms whose exposure is different from 0, and 0 for firms whose the share of affected workers is 0 (columns (1) to (6)). Second, I consider an alternative measure: a dummy variable which is equal to one if the firm has a share of the workforce exposed above the 75th percentile of the distribution and zero otherwise5 (columns (7) to (12)). Reassuringly, the implicit employment elasticities are similar in the different specification and periods using these alternative measures than to those obtained using my original measure of exposure.
While my analysis controls for firm characteristics, it does not account for compositional effects that may arise from workers switching across firms. In this section, I exploit the longitudinal nature of the Portuguese data to account for these effects by including firm fixed effects. In this case, the estimated coefficients of the baseline model are only based on changes within the firms. Appendix Table A5 presented the results. It reveals that the estimates have the same direction and effects are significant as in the original specification. Yet, they differ in terms of magnitude, with higher implied employment elasticities than in the original model, especially if firm exposure is considered as a continuous variable (left panel). If I consider firm exposure as a dummy variable which is one if the firm has a share of affected workers above the 75th percentile of the distribution and zero otherwise (right panel) results are somewhat similar to those in the original model.
When studying the effects of the minimum wage on employment, one obvious limitation is the strong regulation of labor markets which restricts lay-offs. The short-run employment effects might be larger, and more immediate, in more flexible labor markers. The model in this thesis assumes that firms are able to react to the minimum wage in the short-term. But if these restrictions are very binding, it is possible that the effects of the minimum wage on employment are only observed in the medium term. And therefore, it is possible that there is a lagged effect. Moreover, my analysis covers only full-time workers and therefore it does not account for any possible substitution between full and part-time labor.
5 I also analyzed results using a definition of high share as being above or below the median of the share distribution
8. Conclusion
In this thesis, I have shown that increasing the minimum wage has consequences for firm-level employment and wages. More exposed firms register, on average, a more accentuated decline in employment, but also higher growth in the average worker’s wage. In line with Harasztosi and Lindner (2019), my results show that the wage elasticities are of a larger magnitude than employment elasticities, indicating that firms are more likely to respond to the minimum wage increase by raising wages than dismissing workers. My estimates point to employment elasticities with respect to average wages ranging from -0.48 to -0.56. I also found that these elasticities vary considerably across industries. The manufacturing and transportation sectors proved to be less responsive to the minimum wage increases, which may be related to these sectors typically being more unionized. Moreover, my results suggest that the elasticity of employment is not constant over time. Raising the minimum wage is associated with a larger employment reduction during the crisis period (2010–14), with an estimated elasticity of -0.77, followed by 2008–09, with an elasticity of -0.61, and 2015–17, with an elasticity of -0.47.
In this thesis, I also studied the incidence of the minimum wage. I analyzed firms’ response in various accounting margins, to understand whether the costs of this policy are supported by firm owners (through reduction of profits) and/or by consumers (reflecting in a larger margin between revenues and expenses for materials). during the period of positive growth (2008–09), the increase in the margin between revenues and materials suggests that most of the costs of the minimum wage increases were borne by consumers. In the subsequent crisis period, the majority of the minimum wage costs was borne by firm owners, and this occurred because they suffer a decrease in profits that offset the increase in labor costs caused by the higher minimum wage. During that period, the lion share of the increased cost of labor was covered by lower profits, while the remaining was paid by consumers in the form of higher revenue.
9. References
HARASZTOSI, PETER and LINDNER, ATILLA. 2017. Who pays for the minimum wage?
The American Economic Review, Vol. 109, No. 8, August 2019, pp. 2693-2727.
CARD, DAVID and KRUEGER, ALAN B. 1994. Minimum Wages and Employment: A Case Study of the Fast-Food Industry in New Jersey and Pennsylvania. The American Economic
CARD, DAVID and KRUEGER, ALAN B. 1995. Myth and Measurement: The New
Economics of the Minimum Wage. Princeton University Press.
NEUMARK, DAVID and WASHER, WILLIAM. 2007. Minimum Wage and Employment. Foundation and Trends in Microeconomics, Vol.3, No. 1-2, pp 1-182.
CENTENO, MÁRIO, DUARTE, CLÁUDIA and NOVO, ÁLVARO. 2011. The Impact of the Minimum Wage on Low-Wage Earners. Economic Bulletin, Banco de Portugal, Autumn 2011. STIGLER, GEORGE J. 1946. The Economics of Minimum Wage Legislation. The American
Economic Review, Vol. 36, No. 3, pp. 358-365.
FREEMAN, RICHARD B. 1996. The Minimum Wage as a Redistributive Tool. The Economic
Journal, Vol. 106, No. 436, pp. 639-649.
MINISTÉRIO DO TRABALHO, SOLIDARIEDADE E SEGURANÇA SOCIAL (2019). Salário Mínimo Nacional, 45 Anos Depois – Balanço e Perspectivas Atuais Sobre Emprego e Salários em Portugal. Gabinete de Estratégia e Planeamento.
ABOWD, KRAMARZ, MARGOLIS and PHILIPPON. 2000. The Tail of Two Countries: Minimum Wages and Employment in France and the United States. IZA Discussion Papers 2000.
WOLFSON, P. and BELMAN, D. 2019. 15 Years of Research on U.S. Employment and the Minimum Wage. Labour, Vol. 33, No.4, pp. 488-506.
DiNARDO, FORTIN and LEMIEUX. 1996. Labor Market Institutions and the Distribution of Wages 1973-1992: A Semiparametric Approach. Econometrica, Vol. 64, No.5, pp. 1001-1044. DRACA, MACHIN and VAN REENEN. 2011. Minimum Wages and Firm Profitability. American Economic Review. Vol. 3, No. 1, pp. 129-151.
MACHIN, MANNING and RAHMAN. 2003. Where the Minimum Wage Bites Hard: Introduction of Minimum Wages to a Low Wage Sector. Journal of the European Economic Association. Vol. 1, No. 1, pp. 154-180.
10. Appendix
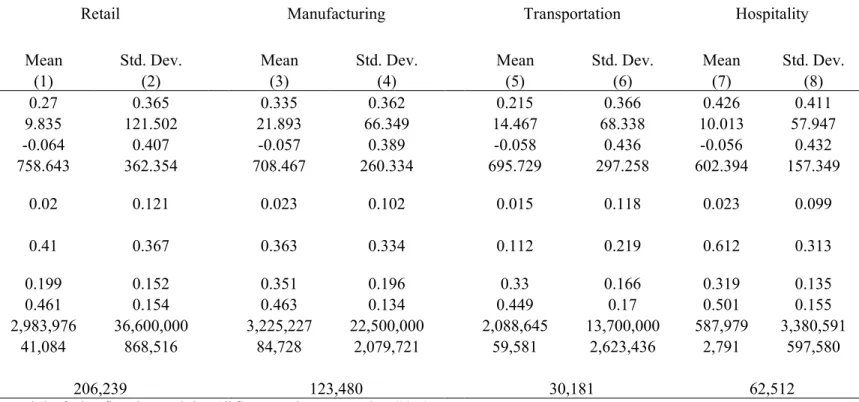
Table A1: Summary Statistics Sector Samples
Retail Manufacturing Transportation Hospitality
Mean Std. Dev. Mean Std. Dev. Mean Std. Dev. Mean Std. Dev.
(1) (2) (3) (4) (5) (6) (7) (8)
Firm Exposure 0.27 0.365 0.335 0.362 0.215 0.366 0.426 0.411 FTE Employment 9.835 121.502 21.893 66.349 14.467 68.338 10.013 57.947 Δ% FTE -0.064 0.407 -0.057 0.389 -0.058 0.436 -0.056 0.432 Firm Average Wage 758.643 362.354 708.467 260.334 695.729 297.258 602.394 157.349 Δ% Firm Average Wage 0.02 0.121 0.023 0.102 0.015 0.118 0.023 0.099 Womem Share 0.41 0.367 0.363 0.334 0.112 0.219 0.612 0.313 Average Labour Share 0.199 0.152 0.351 0.196 0.33 0.166 0.319 0.135 Average Wage Share 0.461 0.154 0.463 0.134 0.449 0.17 0.501 0.155 Revenue 2,983,976 36,600,000 3,225,227 22,500,000 2,088,645 13,700,000 587,979 3,380,591 Profitability 41,084 868,516 84,728 2,079,721 59,581 2,623,436 2,791 597,580
Observations 206,239 123,480 30,181 62,512
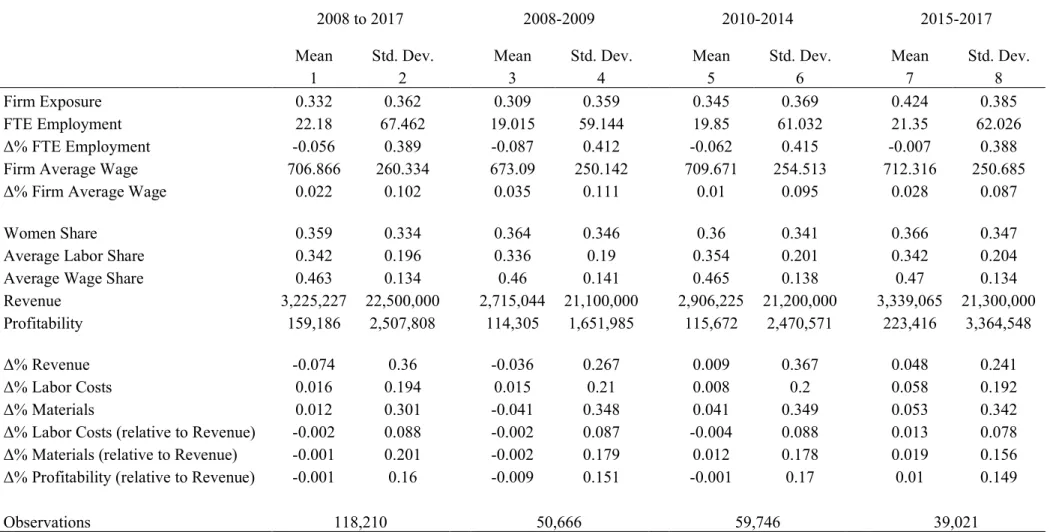
Table A2: Summary Statistics Incidence Samples
2008 to 2017 2008-2009 2010-2014 2015-2017
Mean Std. Dev. Mean Std. Dev. Mean Std. Dev. Mean Std. Dev.
1 2 3 4 5 6 7 8
Firm Exposure 0.332 0.362 0.309 0.359 0.345 0.369 0.424 0.385 FTE Employment 22.18 67.462 19.015 59.144 19.85 61.032 21.35 62.026 Δ% FTE Employment -0.056 0.389 -0.087 0.412 -0.062 0.415 -0.007 0.388 Firm Average Wage 706.866 260.334 673.09 250.142 709.671 254.513 712.316 250.685 Δ% Firm Average Wage 0.022 0.102 0.035 0.111 0.01 0.095 0.028 0.087
Women Share 0.359 0.334 0.364 0.346 0.36 0.341 0.366 0.347 Average Labor Share 0.342 0.196 0.336 0.19 0.354 0.201 0.342 0.204 Average Wage Share 0.463 0.134 0.46 0.141 0.465 0.138 0.47 0.134 Revenue 3,225,227 22,500,000 2,715,044 21,100,000 2,906,225 21,200,000 3,339,065 21,300,000 Profitability 159,186 2,507,808 114,305 1,651,985 115,672 2,470,571 223,416 3,364,548 Δ% Revenue -0.074 0.36 -0.036 0.267 0.009 0.367 0.048 0.241 Δ% Labor Costs 0.016 0.194 0.015 0.21 0.008 0.2 0.058 0.192 Δ% Materials 0.012 0.301 -0.041 0.348 0.041 0.349 0.053 0.342 Δ% Labor Costs (relative to Revenue) -0.002 0.088 -0.002 0.087 -0.004 0.088 0.013 0.078 Δ% Materials (relative to Revenue) -0.001 0.201 -0.002 0.179 0.012 0.178 0.019 0.156 Δ% Profitability (relative to Revenue) -0.001 0.16 -0.009 0.151 -0.001 0.17 0.01 0.149
Observations 118,210 50,666 59,746 39,021
Note The table presents summary statistics for the samples used in the study of the minimum wage incidence. Only firms in the manufacturing sector are considered. All values are in constant prices (2017).
Table A3: Effects on Average Labour Costs
Main Sample (2008 to 2017) 2008 to 2010 2011 to 2014 2015 to 2017
(1) (2) (3) (4) (5) (6)
Panel A: Change in Firm Average
Labour Costs
Firm Exposure 0.0450*** 0.0472*** 0.0486*** 0.0518*** 0.0414*** 0.0508*** (0.0012) (0.0012) (0.0013) (0.0020) (0.0018) (0.0018)
Average Labour Share -0.0331*** -0.0417*** -0.0412*** -0.0393*** -0.0415*** -0.0504*** (0.0024) (0.0026) (0.0027) (0.0043) (0.0038) (0.0041)
Average Wage Share 0.4428*** 0.4523*** 0.4571*** 0.4308*** 0.5295*** 0.4350*** (0.0031) (0.0031) (0.0031) (0.0045) (0.0043) (0.0049)
Observations 575,116 575,116 575,116 262,564 310,489 214,269 R-Squared 0.0476 0.0490 0.0498 0.0456 0.0580 0.0469
Panel B: Implicit Elasticitiy
Employment elasticity wrt.
Labour Costs -0.6867 -0.5784 -0.6276 -0.7683 -1.0870 -0.5256
Number of Firms 128,672 128,672 128,672 153,874 143,312 130,031
Contols x x x x x x
Industry 1-char FE's x
Industry 2-digit FE's x x x x
Note:***p<0,01, **p<0,05, *p<0,1. Robust standard errors are shown in parentheses bellow the coefficients. The table describes the relation between firms' share of worker earning a salary bellow next year's minimum wage (Firm Exposure) and their evolution on average labour costs (labour costs per full-time employee). Columns 1 to 3 analyse the main sample of firms, formed by all companies operating in 2006 and 2007 with complete information in the data bases. Columns 4 to 6 analyse period samples formed by all companies operating for at least 2 years before the first year of the respective time window and with complete information in the data bases. In Panel B are reported the respective employment elasticities with respect to the average labour costs. Regressions include year dummies and are weighted by the natural logarithm of employment.
Table A4: Robustness of Employment and Wage Elasticities to Alternative Measure of Exposure
Exposure variable: =1 if share of workers in the firms whose salaries are below next years minimum wage >0
Exposure variable: =1 if share of workers in the firms whose salaries are below next years minimum wage is in top 75th
percentile
Main Sample (2008 to 2017) 2008 to 2009 2010 to 2014 2015 to 2017 Main Sample (2008 to 2017) 2008 to 2009 2010 to 2014 2015 to 2017
(1) (2) (3) (4) (5) (6) (7) (8) (9) (10) (11) (12)
Panel A: Change in Firm-Level
Employment Firm Exposure -0.0189** * -0.0171** * -0.0190** * -0.0251** * -0.0292** * -0.0158** * -0.0186** * -0.0157** * -0.0175** * -0.0194** * -0.0201** * -0.0186** * (0.0013) (0.0014) (0.0014) (0.0022) (0.0019) (0.0020) (0.0011) (0.0011) (0.0011) (0.0017) (0.0016) (0.0019) Observations 630,664 630,664 630,664 292,821 352,202 230,827 630,664 630,664 630,664 292,821 352,202 230,827 R-Squared 0.0303 0.0369 0.0405 0.0376 0.0434 0.0321 0.0303 0.0370 0.0406 0.0376 0.0431 0.0325
Panel B: Change in Firm Average
wage
Firm Exposure 0.0346*** 0.0346*** 0.0359*** 0.0390*** 0.0357*** 0.0348*** 0.0265*** 0.0265*** 0.0267*** 0.0288*** 0.0263*** 0.0289***
(0.0004) (0.0004) (0.0004) (0.0007) (0.0005) (0.0005) (0.0003) (0.0004) (0.0004) (0.0006) (0.0005) (0.0006)
Observations 575,116 575,116 575,116 262,564 310,489 214,269 575,116 575,116 575,116 262,564 310,489 214,269
R-Squared 0.0487 0.0512 0.0519 0.0295 0.0558 0.0310 0.0487 0.0491 0.0496 0.0288 0.0532 0.0248
Panel C: Implicit Elasticitiy
Employment elasticity wrt. Wage -0.5462 -0.4942 -0.5292 -0.6436 -0.8179 -0.4540 -0.7019 -0.5925 -0.6554 -0.6736 -0.7643 -0.6436
Number of Firms 128,672 128,672 128,672 153,874 143,312 130,031 128,672 128,672 128,672 153,874 143,312 130,031
Contols x x x x x x x x x x x x
Industry 1-char FE’s x x
Industry 2-digit FE’s x x x x x x x x
Note:***p<0,01, **p<0,05, *p<0,1. Robust standard errors are shown in parentheses bellow the coefficients. The table describes the relation between firms' share of worker earning a salary bellow next year's minimum wage (Firm Exposure) and their employment and average wage outcomes. The employment effect, in Panel A, includes both firms' closure and layoffs while wage effects, in Panel B, include only layoffs. In Panel C are reported the respective employment elasticities with respect to the wage. Regressions include year dummies and are weighted by the natural logarithm of employment. In the left panel, firm exposure is a dummy variable which is equal to one if the firm has a share of the workforce exposed above the 75th percentile of the distribution and zero otherwise. And in the right panel, firm exposure is a dummy variable equal to 1 for firms whose exposure is different from 0, and 0 for forms for firms where the share of affected workers is 0. Regressions include year dummies and are weighted by the natural logarithm of employment.