doi: 10.1007/BF03195712
Genetic differences between wild and hatchery populations of
Diplodus sargus and D. vulgaris inferred from RAPD markers:
implications for production and restocking programs design
J. C. Pereira2, P. G. Lino1, A. Leitão1, S. Joaquim1, R. Chaves2, P. Pousão-Ferreira1,H. Guedes-Pinto2, M. Neves dos Santos1
1Instituto Nacional de Recursos Biológicos (INRB, I.P.) / IPIMAR, Av. 5 de Outubro s/n, Olhão, Portugal 2
Centro de Genética e Biotecnologia da Universidade de Trás-os-Montes e Alto Douro IBB-CGB/UTAD. P-5000-911 Vila Real, Portugal
Abstract. Restocking and stock enhancement programs are now recognized as an important tool for the
management of fishery resources. It is important, however, to have an adequate knowledge on the genetic population structure of both the released stock and the wild population before carrying out such programs. In this study, random amplified polymorphic DNA (RAPD) markers were applied to assess genetic diversity and population structure of wild and hatchery populations of the white seabream Diplodus sargus and the common two-banded seabream D. vulgaris (Sparidae). The estimated values for intrapopulation genetic variation, measured using the percentage of polymorphic loci (%P), Shannon index (H’), and Nei’s gene diversity (h), showed high values for all populations. The percentage of genetic variation within D. sargus and
D. vulgaris populations, based on coefficient of gene differentiation, reached 82.5% and 90% of the total genetic
variation, respectively. An undeniable decrease in genetic variation was found in both hatchery populations, particularly in D. sargus, compared to the wild ones. However, the high values of variation within all populations and the low levels of genetic variation among populations did not indicate inbreeding or depression effects, thus indicating a fairly proper hatchery management. Nevertheless, the results of this study highlight the importance of monitoring the genetic variation of hatchery populations, particularly those to be used in restocking programs. The creation of a genetic baseline database will contribute to a more efficient conservation management and to the design of genetically sustainable restocking programs.
Keywords: Diplodus sargus, Diplodus vulgaris, RAPD marker, population genetics, restocking.
Introduction
Restocking and stock enhancement have been used as tools to recover stocks of commercially overexploited marine fish in several countries (Støttrup and Sparrevohn 2007). However, the massive releases of hatchery-produced fish have raised concerns on their genetic effects on wild populations at 2 levels: (1) hatchery fish may have a reduced genetic variability (Taniguchi 2004), and this may eventually lower the genetic diversity in the population into which it is released; and (2) genetic viability of wild populations may
be eroded by transplantation of non-native fish or their hatchery-derived offspring (Tringali and Bert 1998). It is therefore necessary to have adequate knowledge on the genetic population structure be- fore carrying out any restocking or stock enhancement project (Cross 2000), which can be achieved by molecular genetic analysis (Ward 2006).
The white seabream Diplodus sargus (Linnaeus 1758) and the common two-banded seabream D.
vulgaris (Geoffroy Saint-Hilaire 1817) are
highly commercially valuable species, naturally
Correspondence: A. Leitão, Instituto Nacional de Recursos Biológicos, I.P. / IPIMAR, Avenida 5 de Outubro s/n, P-8700-305 Olhão, Portugal; e-mail: [email protected]
occurring in southern Portugal (Algarve coastal waters). These are demersal fish belonging to the family Sparidae, whose geographic distribution extends from the Bay of Biscay to Cape Verde Islands. Their bathymetric range extends from the shallow subtidal zone down to the depth of about 90 m (Whitehead et al. 1986). Diplodus sargus in- habits littoral waters on rocky bottoms and sand close to rocks, while D. vulgaris also occurs on sandy bottoms (Whitehead et al. 1986). Both species are morphologically very similar, but are easily distinguished based on external features. They have the same trophic level (Guidetti and Sala 2007), their reproduction season overlaps (Gonçalves et al. 2003; Erzini et al. 2001), but they do not tend to form mixed schools during mating (M.N. Santos and P.G. Lino, oral comm.).
The Portuguese Fisheries and Marine Research Laboratory (IPIMAR) produces and rears these 2 species in its own Aquaculture Research Station (EPPO). The capacity to mass produce fish species is one of the conditions to consider a species for re- stocking (Bell et al. 2006; Støttrup and Sparrevohn, 2007). Although presently both stocks do not require such intervention, IPIMAR has been testing the potential of these species for restocking, since according to Bell et al. (2006), there are no “shortcuts” to identify whether hatchery releases will be a viable management option for each situation.
The establishment of a founder stock for sparid hatchery production should be considered the fun- damental step in broodstock management, since it will determine the population’s genetic variability and inbreeding that will take place by future crosses. In general, the effective size of founder populations is conditioned by hatchery techniques constraints, which may result in the use of only a few individuals as broodstock. This practice may lead to erosion of the genetic diversity of the progeny stocks (Alarcón et al. 2004). Therefore, proper hatchery management and breeding pro- grams should be implemented, both for genetic enhancement programs and for the design of restocking or stock enhancement strategies. In or- der to carry out such programs, information on the genetic background of hatchery populations and on the genetic relationships between hatchery and the wild populations of these species are fundamental. The use of molecular markers applied to stock assessment has often cast light on population sub- structure, and given useful information for the management of fishery resources (Allendorf and
Phelps 1980). RAPD (random amplified polymorphic DNA) is a polymorphic assay based on the amplification of random DNA sequences, using primers with arbitrary nucleotide sequences. RAPD is a low-cost, simple technique, which re- quires no previous sequence information and in which a large number or putative loci may be screened (Weising et al. 1995). However, this technique has some disadvantages, associated mainly with dominance, reproducibility, homology inferences, and artifact fragments (Jones et al. 1997; Harris 1999; Ali et al. 2004). The RAPD method (Williams et al. 1990) has been widely used in molecular biology laboratories and frequently applied to reveal population-genetic variation, divergence, and biogeography (Schaal and Leverich 2001). In aquaculture fish species, it has already been successfully applied to catfish (Liu et al. 1998), discus (Khol et al. 1999), red seabream (Jiang et al. 2004), carp (Wang and Li 2004), gilthead seabream (Bilgen et al. 2007), and flounder (Liu et al. 2007).
The main objective of this study was therefore to define the genetic structure of both hatchery produced and wild populations of D. sargus and
D. vulgaris from Southern Portugal, in order to
estimate the degree of potential genetic erosion of hatchery populations, by comparing their genetic variability with that of geographically close wild stocks.
Materials and methods
Sample collection and DNA extraction
For each species, D. sargus and D. vulgaris, 20 hatchery-produced fish were obtained from the IPIMAR’s EPPO, while 20 wild fish were obtained from natural southern Portuguese populations. All wild fish were captured by the local fishing fleet, at the same area on the south Algarve coastal waters (southern Portugal). Fin clips were cut immediately after collection of the individuals, placed in 95% ethanol, and stored until further processing. The protocol used for genomic DNA extraction is based on the use of the automatic sys- tem equipment QuickGene-810 and an adaptation of the QuickGene DNA Tissue kit developed by FUJIFILM LIFE SCIENCE. The fin clips (5–25 mg) were cut in small peaces and placed in a 2-mL Eppendorf tube. 180 µL of MDT (Tissue Lysis Buffer) and 20 µL of EDT (Proteinase K) were added to the mixture and
incubated overnight at 55oC. The subsequent addition of 180 µL of LDT (Lysis Buffer) was followed by vortexing for 15 s, and a flash spin down. After incubation at 70oC for 10 min, 240 µL of absolute ethanol was added, and the tubes were vortexed and spun down. Finally, the lysate was transferred to a car- tridge of the automatic nucleic-acid isolation sys- tem QuickGene-800, and the “DNA tissue mode” was selected.
RAPD amplification
A series of optimization experiments were con- ducted following the protocol of Williams et al. (1990), with various concentrations and purity of template DNA, dNTPs, MgCl2 concentration, and
Taq polymerase, to determine which conditions produced the strongest and most reproducible pat- terns. A total number of 20 RAPD primers (Operon Technologies) were screened. Among them, 6 RAPD primers (Table 1) produced clear and reproducible bands, so they were selected for amplification of all the D. sargus and D. vulgaris DNA samples. To test the reproducibility of the bands, 3 replicates were analysed for all selected primers in which contamination controls were added. The amplification reactions were per- formed in volumes of 25 µL, containing 50 ng of genomic template DNA, 2 mM MgCl2, 100 µM of
dATP, dCTP, dGTP and dTTP each, 0.2 µM of the primer, and 0.5 units of Taq DNA polymerase (Fermentas, Life Sciences). Amplification was performed in a Thermal Cycler (T-personal, Biometra) in a total of 45 cycles: 1 min at 94oC, 1 min at 30–36oC, and 2 min at 72oC, using the fastest possible transitions between each temperature. The total volume of the PCR products were evaluated in 2% agarose gels and visualized by ethidium bromide staining. After electrophoresis, DNA bands profiling were observed under UV light, and the images were saved in a gel analyzer (UVIDOC).
Data analysis
Amplified fragments were scored as binary data, i.e. presence as 1 and absence as 0, for homologous bands. Only data generated from reproducible bands were used for statistical analysis. The number of polymorphic loci, percentage of polymorphic loci (%P), observed number of alleles (na), effective number of
alleles (ne), Nei’s gene diversity (h), and
Shannon index (H’) were estimated using the
program GenAlEx 6.1 (Peakall and Smouse 2007). Nei’s (1987) coefficient of gene differentiation (GST, analogous to the fixation index FST) and gene flow (Nm) were estimated using
POPGENE program version 1.32 (Yeh et al. 1997). To calculate the percentage of polymorphic loci with the most common allele not exceeding 95% (%P95) and Nei’s (1972) genetic distance, we
used TFPGA 1.3 software (Miller 1997). To estimate the genetic structure of D. sargus and D. vulgaris populations, a measure of genetic differentiation (ÖPT) was estimated using the
non-parametric analysis of molecular variance (AMOVA) with the program GenAlEx 6.1 (Peakall and Smouse 2007) for variation among individuals within populations and among populations. Allele frequency was calculated according to Lynch and Milling (1994).
Results
Genetic diversity within populations
The 6 selected primers amplified 161 and 168 clear and reproducible bands, for D. sargus and
D. vulgaris populations, respectively (Table 1).
The size of the major amplified bands ranged between 200 and 1500 bp.
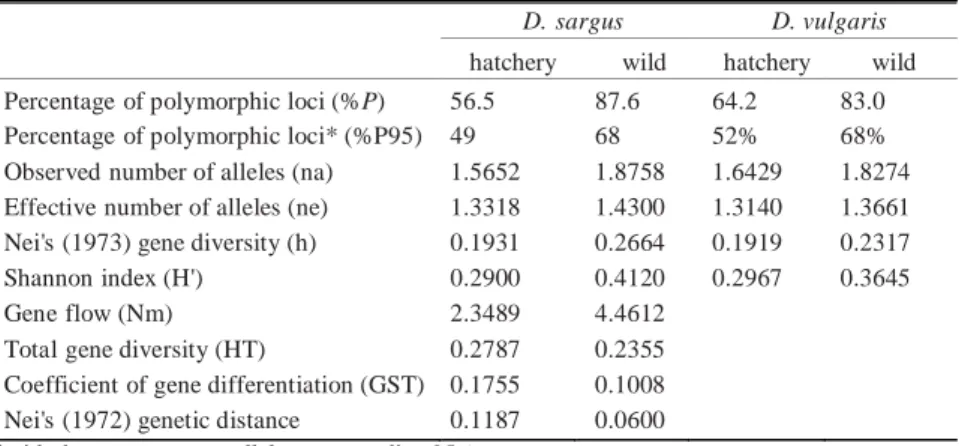
Intrapopulation genetic diversity values, estimated by the Shannon index (H’), Nei’s gene diversity (1973) (h), number of observed and effective alleles (na and ne), and percentage of
polymorphic loci (%P and %P95), are presented in
Table 2. A high percentage of polymorphic loci (%P) was observed for both species. However, values for hatchery populations were lower than those for wild populations. The H’ and h values were higher in the wild than in the hatchery populations for both species. Nevertheless, the results demonstrate that the intrapopulation genetic variation was high within populations in all 4 cases.
Genetic variation between populations
Analysis of molecular variance (AMOVA) and coefficient of gene differentiation (GST) (Nei
1987; Excoffier et al. 2005), calculated with the programs mentioned earlier, allowed us to examine the hierarchical partitioning of genetic variation in the populations of D. sargus and D. vulgaris. According to the values obtained with the application of multi-population analysis
(Nei 1987) (Table 2), the total genetic diversity (HT) was 0.2787 for D. sargus and 0.2305
for D. vulgaris, whilst the values of the coefficient of gene differentiation (GST) were 0.1755 (D. sargus) and 0.1008 (D. vulgaris). This means that
82.5% and 90% of the total genetic variation is within D. sargus and D. vulgaris populations, respectively. The D. sargus and D. vulgaris populations presented high values of gene flow (Nm = 2.3489 and 4.4612, respectively), which is
consistent with previous findings.
The AMOVA results indicated that within-population variation accounted for 77% and 88% of the total genetic variation, whilst be- tween-population variation accounted for the remaining 23% and 12%, for D. sargus and D. vulgaris, respectively. The analogue of fixation index (ÖPT), calculated with AMOVA,
reached 0.225 and 0.122 for D. sargus and D.
vulgaris, respectively, suggesting moderate to low
genetic differentiation between the wild and hatchery populations of both Diplodus species. The analyses of these values lead us to a conclusion that there are no major genetic differences between the wild and hatchery populations in both studied species.
Discussion
Avoiding extinction of heavily exploited populations is the first goal of any nature conservation plan (Man et al. 1995), but since all environments ultimately change and will probably change at an ever-increasing rate due to human influence, then conservation programs must also maintain the capacity of fish to adapt genetically, preserving genetic variability. Therefore one of the major concerns should be the maintenance of the existing genetic variation, both within and among different populations, maintaining high levels of heterozygosis and preserving allele richness (Meffe 1986).
Several methods based on PCR have been developed for genetic analysis of several fish species. RAPD fingerprinting revealed to be less time consuming and less expensive (Liu and Cordes 2004; Liu et al. 2004). The disadvantage of its low reproducibility can be overcome by replicating exactly the same laboratory conditions and assaying 2 or more times to ensure reproducibility. Consequently, RAPD is one of the best methods for the assessment of genetic
variation among populations in species where little molecular genetic in- formation is available. This technique has been previously successfully applied to population analysis of several fish species (Liu et al. 1998; Jiang et al. 2004; Wang and Li 2004), including specific comparisons between wild and hatchery populations of the same species (Khol et al. 1999; Bilgen et al. 2007; Liu et al. 2007).
Genetic diversity within populations is highly important for the adaptation to changing environments and, as a consequence, for long-term survival of a species. In this work, all studied populations of D. sargus and D. vulgaris revealed high within-population variation, estimated by several genetic parameters. Lenfant and Planes (1996), González-Wangüemert et al. (2004) and Domingues et al. (2007), had also previously found high values of within-population genetic diversity in several D.
sargus populations. However, as far as D. vulgaris is concerned, to our best knowledge,
this is the first genetic population study performed.
The analysis of the genetic structure in both species also revealed that the level of be- tween-population variation was higher in D.
sargus than in D. vulgaris. AMOVA results
showed that genetic variation was higher within populations than between populations, for both
Diplodus species. The obtained low to moderate
genetic differentiation between populations, associated with the reduced values of genetic distance and high values of gene flow, allows us to state that these populations correspond to a genetic structure of a single population by species. Similarly low level of between-population variation was found by D’Anna and Badalamenti (2000) be- tween hatchery and wild
D. sargus populations from Golfo di
Castellammare (Sicily).
In conclusion, results of this study give a preliminary view of genetic variation both within and between these populations. Both hatchery populations analysed, but particularly that of D.
sargus, show an unquestionable decrease in
genetic variation in comparison to the wild ones. However, the high values of variation within populations and the low levels of variation among populations did not reveal any inbreeding or depression effects, thus indicating a fairly proper hatchery management. The IPIMAR hatchery,
being a research facility, is particularly careful with this issue, having a 20% annual replacement of the broodstock with new wild specimens. Nevertheless, an assessment of the genetic structure of hatchery populations should be conducted periodically along the selective breeding programs, in order to avoid any major reduction in genetic diversity of hatchery populations, particularly those to be used in future restocking programs. The intrapopulation genetic variation is, in fact, an essential parameter of species adaptation to environmental changes. When a gene pool from a population narrows and loses genetic plasticity, it becomes more prone to changes in environmental conditions and therefore is more susceptible to extinction (Guttman and Berg, 1998). The creation of genetic baseline data with the use of several other molecular markers will certainly contribute to a more efficient conservation management and should be used for each species prior to any massive release that might affect the wild population.
Acknowledgements. This study was partly sup- ported by 3 grants from the Fundação para a Ciê n cia e Tecnologia (FCT), attributed to Jorge C. Pereira
(SFRH/BD/27720/2006), Pedro G. Lino
(SFRH/BD/19308/2004) and Alexandra Leitão
(SFRH/BPD/18961/2004), and by the
PROMOPESCA project developed within the framework of the INTERREG IIIA Programme (Cooperaçã o Transfronteiriça Portugal-Espanha).
REFERENCES
Alarcón JA, Magoulas A, Georgakopoulos T, Zouros E, Alvarez MC, 2004. Genetic comparison of wild and cultivated European populations of the gilthead seabream (Spaurus aurata). Aquaculture 230: 65–80.
Ali BA, Ahmed MMM, El-Zaeem S, 2004. Technical note: application of RAPD markers in fish. Part II: among and within families; Cichlidae (freshwater), Mugilidae (catadromous), Sparidae and Serranidae (marine). Int J Biotechnol 6: 393–401.
Allendorf FW, Phelps SR, 1980. Loss of genetic variation in a hatchery stock of cutthroat trout. American Fisheries Society 109: 537–543.
Bell JD, Bartley DM, Lorenzen K, Loneragan NR,2006. Restocking and stock enhancement of coastal fisheries: potential, problems and progress. Fish. Res. 80: 1–8.
Bilgen G, Akhan S, Arabaci M, Oguz I, 2007. Genetic diversity of gilthead sea bream (Sparus aurata) broodstocks as determined by RAPD-PCR.Israeli Journal of Aquaculture-Bamidgeh 59: 217–223.
Cross TF, 2000. Genetic implications of
translocation and stocking of fish species, with particular reference to Western Australia. Aquacult. Res. 31: 83–94.
D’Anna G, Badalamenti F, 2000. Iniziativa di restocking del sarago maggiore, Diplodus sargus, e tecniche di monitoraggio in un’area protetta con strutture artificiali nel Golfo di Castellammare (Sicilia N–O). Project no. 4C124 of “Ministero delle politiche Agricole e Forestali (Italy)”: 52.
Domingues VS, Santos RS, Brito A, Alexandrou M, Almada VC, 2007. Mitochondrial and nuclear markers reveal isolation by distance and effects of
Pleistocene glaciations in the northeastern
Atlantic and Mediterranean populations of the white seabream Diplodus sargus, L.). J Exp Mar Biol Ecol 346: 102–113.
Erzini K, Bentes L, Coelho R, Correia C, Lino PG, Monteiro P, et al. 2001. Fisheries biology and assessment of demersal species (Sparidae) from the South of Portugal. Final report. UEDG XIV -98/082.
Excoffier L, Estoup A, Cornuet JM, 2005. Bayesian analysis of an admixture model with mutations and
arbitrarily linked markers. Genetics 169: 1727–
1738.
Gonçalves JMS, Bentes L, Coelho R, Correia C, Lino PG, Monteiro P, et al. 2003. Age and growth, maturity, mortality and yield-per-recruit for two-banded bream (Diplodus vulgaris Geoffr.) from
the south coast of Portugal. Fish Res 62:349–
359.
González-Wangüemert M, Pérez-Ruzafa Á, Marcos C, García-Charton J, 2004. Genetic differentiation of Diplodus sargus (Pisces: Sparidae) populations in Southwest Mediterranean. Biol J Linn Soc 82: 249–261.
Guidetti P, Sala E, 2007. Community-wide effects of marine reserves in the Mediterranean Sea. Mar Ecol-Prog Ser 335: 43–56.
Guttman SI, Berg D, 1998. Changes in the genetic diversity of aquatic organisms in the great lakes: causes and consequences. Setac News 23–24. Harris SA, 1999. RAPDs in systematics—a useful
methodology?. In: Hollingsworth PM, Batesman RM, Gornall RJ, eds. Molecular Systematics and Plant Evolution. London: Taylor and Francis: 211–228.
Jiang S, Yang H, Su T, Gong S, 2004. Genetic diversity of three geographical populations of Pagrosomus major revealed by RAPD analysis. J Fish China 28: 334–338.
Jones CJ, Edwards KJ, Castaglione S, Winfield MO, Sala F, van de Wiel C, et al. 1997. Reproducibility testing of RAPD, AFLP and SSR markers in plants by a network of European laboratories. Mol Breed 3: 381–390.
Khol TL, Khoo G, Fan LQ, Phang VPE, 1999. Genetic diversity among wild forms and cultivated varieties of discus (Symphysodon spp.) as revealed by
random amplified polymorphic DNA (RAPD) fingerprinting. Aquaculture 173: 485–497.
Lenfant P, Planes S, 1996. Genetic differentiation of white sea bream within the Lion’s Gulf and the Ligurian Sea (Mediterranean Sea). J Fish Biol 49: 613–621.
Liu Y, Wang X, Liu L, 2004. Analysis of genetic variation in surviving apple shoots following cryopreservation by vitrification. Plant Sci 166: 677– 685.
Liu YG, Chen SL, Li BF, 2007. Genetic differentiation among common and selected hatchery populations of flounder: Evidence from RAPD markers. Biochem Syst Ecol 35: 689–695.
Liu Z, Li P, Argue BJ, Dunham RA, 1998. Inheritance of RAPD markers in channel catfish (Ictalurus punctatus), blue fish (I. furcatus) and their F1, F2 and backcross hybrids. Anim Genet 29: 58.
Liu ZJ, Cordes JF, 2004. DNA marker technologies and
their applications in aquaculture genetics.
Aquaculture 238: 1–37.
Lynch M, Milligan BG, 1994. Analysis of population genetic structure with RAPD markers. Mol Ecol 3: 91–99.
Man A, Law R, Polunin NVC, 1995. Role of marine reserves in recruitment to reef fisheries: a metapopulation model. Biol Conserv 71: 197–204. Meffe GK, 1986. Conservation genetics and the
management of endangered species. Fisheries
11:14–23.
Miller MP, 1997. A Windows program for the analysis of allozyme and molecular population genetic data (TFPGA). Department of Biological Sciences, Northern Arizona University, Flagstaff, USA. Nei M, 1972. Genetic distance between populations.
Am Nat 106: 283–292.
Nei M, 1973. Analysis of gene diversity in subdivided populations. Proc Natl Acad Sci U. S. A. 70: 3321–3323.
Nei M, 1987. Molecular evolutionary genetics. New York: Columbia University Press.
Peakall R, Smouse PE, 2006. GENALEX 6: genetic analysis in Excel. Population genetic software for teaching and research. Mol Ecol Notes 6: 288–295. Schaal BA, Leverich WJ, 2001. Plant population
biology and systematics. Taxon 50: 357–373.
Støttrup JG, Sparrevohn CR, 2007. Can stock enhancement enhance stocks? J Sea Res 57: 104– 113.
Taniguchi N, 2004. Genetic factors in broodstock management for seed production. Rev Fish Biol Fisher 13: 177–185.
Tringali MD, Bert TM, 1998. Risk to genetic effective population size should be an important consideration in fish stock enhancement programs. B Mar Sci 62: 641–659.
Wang C, Li S, 2004. Phylogenetic relationships of ornamental (koi) carp, Oujiang color carp and longfin carp revealed by mitochondrial DNA COII
gene sequences and RAPD analysis. Aquaculture 231: 83–91.
Ward RD, 2006. The importance of identifying spatial population structure in restocking and stock enhancement programs. Fish Res 80: 9–18.
Weising K, Nybom H, Wolff K, Meyer W, 1995. DNA fingerprinting in plants and fungi. CRC Press, Lon- don.
Whitehead PJP, 1986Bauchot M-L, Hureau J-C, Niel- sen J, Tortonese E, eds. Fishes of the North-eastern Atlantic and the Mediterranean. Paris: UNESCO. Williams JGK, Kubelik AR, Livak KJ, Rafalski JA,
Tingey SV, 1990. DNA polymorphisms amplified by arbitrary primers are useful as genetic markers. Nu- cleic Acids Res 8: 6531–6535.
Yeh FC, Yang RC, Boyle TBJ, Ye ZH, Mao JX, 1997.
POPGENE, the user-friendly shareware for
population genetic analysis. Molecular Biology and Biotechnology Centre, University of Alberta, Edmonton, Canada.
Table 1. Summary of used RAPD primers and band data of the studied Diplodus species.
Ta = annealing temperature; N = total number of bands; %P = percentage of polymorphic
bands
Name Primers D.sargus
sequence (5´ 3´) Ta (oC) N %P N %P
hatchery wild
hatchery wild
OPE03 CCAGATGCAC 36 35 71.5 100 33 69.6 81.8 OPE05 TCAGGGAGGT 33 22 59.0 90.9 21 61.9 76.1 OPE10 CACCAGGTGA 36 15 86.6 86.6 27 70.5 88.9 OPE12 TTATCGCCCC 33 30 53.0 80.0 31 45.1 96.7 OPE14 TGCGGCTGAG 33 37 48.0 93.3 32 65.6 71.8 OPE15 ACGCACAACC 33 22 31.8 63.6 24 75.0 79.2
Table 2. Summary of genetic variation statistics for the studied Diplodus species
D. sargus D. vulgaris
hatchery wild hatchery wild
Percentage of polymorphic loci (%P) 56.5 87.6 64.2 83.0
Percentage of polymorphic loci* (%P95) 49 68 52% 68%
Observed number of alleles (na) 1.5652 1.8758 1.6429 1.8274
Effective number of alleles (ne) 1.3318 1.4300 1.3140 1.3661
Nei's (1973) gene diversity (h) 0.1931 0.2664 0.1919 0.2317
Shannon index (H') 0.2900 0.4120 0.2967 0.3645
Gene flow (Nm) 2.3489 4.4612
Total gene diversity (HT) 0.2787 0.2355
Coefficient of gene differentiation (GST) 0.1755 0.1008
Nei's (1972) genetic distance 0.1187 0.0600