arXiv:1207.0210v2 [hep-ex] 19 Nov 2012
EUROPEAN ORGANISATION FOR NUCLEAR RESEARCH (CERN)
CERN-PH-EP-2012-138
Submitted to: Phys. Lett. B.
Search for the Standard Model Higgs boson produced in
association with a vector boson and decaying to a
b
-quark pair
with the ATLAS detector
The ATLAS Collaboration
Abstract
This Letter presents the results of a direct search with the ATLAS detector at the LHC for a Standard
Model Higgs boson of mass
110 ≤ m
H≤ 130 GeV
produced in association with a
W
or
Z
boson and
decaying to
b¯b
. Three decay channels are considered:
ZH → ℓ
+ℓ
−b¯b
,
W H → ℓνb¯b
and
ZH → ν ¯νb¯b
,
where
ℓ
corresponds to an electron or a muon. No evidence for Higgs boson production is observed
in a dataset of
7 TeV pp
collisions corresponding to
4.7
fb
−1of integrated luminosity collected by
ATLAS in 2011. Exclusion limits on Higgs boson production, at the
95%
confidence level, of
2.5
to
5.5
times the Standard Model cross section are obtained in the mass range
110
–
130 GeV
. The expected
exclusion limits range between
2.5
and
4.9
for the same mass interval.
Search for the Standard Model Higgs boson produced in association with a
vector boson and decaying to a b-quark pair with the ATLAS detector
The ATLAS Collaboration
Abstract
This Letter presents the results of a direct search with the ATLAS detector at the LHC for a Standard Model Higgs boson of mass 110 ≤ mH ≤ 130 GeV produced in association with a W or Z boson and decaying to
b¯b. Three decay channels are considered: ZH → ℓ+ℓ−b¯b, W H → ℓνb¯b and ZH → ν ¯νb¯b, where ℓ corresponds
to an electron or a muon. No evidence for Higgs boson production is observed in a dataset of 7 TeV pp collisions corresponding to 4.7 fb−1 of integrated luminosity collected by ATLAS in 2011. Exclusion limits
on Higgs boson production, at the 95% confidence level, of 2.5 to 5.5 times the Standard Model cross section are obtained in the mass range 110–130 GeV. The expected exclusion limits range between 2.5 and 4.9 for the same mass interval.
Keywords: Standard Model Higgs Boson, ATLAS, LHC
1. Introduction
The search for the Standard Model (SM) Higgs boson [1–3] is one of the most important endeav-ours of the Large Hadron Collider (LHC). The re-sults of searches in various channels using data cor-responding to an integrated luminosity of up to 4.9 fb−1 have been reported recently by both the
ATLAS and CMS collaborations [4, 5]. The Higgs boson has been excluded at the 95% confidence level below 114.4 GeV by the LEP experiments [6], in the regions 100–106 GeV and 147–179 GeV at the Tevatron p¯p collider [7], and in the regions 112.5– 115.5 GeV and 127–600 GeV by the LHC experi-ments. This Letter reports on a search for the SM Higgs boson performed for the H → b¯b decay mode, over the mass range 110-130 GeV where this decay mode dominates.
Due to the large backgrounds present in the dom-inant production process gg → H → b¯b, the anal-ysis reported here is restricted to Higgs boson pro-duction in association with a vector boson, W H and ZH [8–12], where the vector boson provides an additional final state signature, allowing for signif-icant background suppression. An additional han-dle against the backgrounds is provided by exploit-ing the better signal-over-background level of the kinematic regions where the weak bosons have high
transverse momenta [13]. These channels are also important contributors to Higgs boson searches at CMS [14] and the Tevatron [7].
This Letter presents searches in the ZH → ℓ+ℓ−b¯b , W H → ℓνb¯b and ZH → ν ¯νb¯b channels,
where ℓ is either an electron or a muon. The data used were recorded by the ATLAS experiment dur-ing the 2011 LHC run at a centre-of-mass energy of √s = 7 TeV and correspond to integrated lu-minosities of 4.6 to 4.7 fb−1 [15, 16], depending on
the analysis channel. The leptonic decay modes of the weak bosons are selected to suppress back-grounds containing only jets in the final state. In the ZH → ν ¯νb¯b channel, the multijet background is suppressed by requiring a large missing transverse energy.
2. The ATLAS Detector
The ATLAS detector [17] consists of four main subsystems. An inner tracking detector is immersed in the 2 T magnetic field produced by a super-conducting solenoid. Charged particle position and momentum measurements are made by silicon de-tectors in the pseudorapidity1 range |η| < 2.5 and
1ATLAS uses a right-handed coordinate system with its
by a straw tube tracker in the range |η| < 2.0. Calorimeters cover |η| < 4.9 with a variety of detec-tor technologies. The liquid-argon electromagnetic calorimeter is divided into barrel (|η| < 1.475) and endcap (1.375 < |η| < 3.2) sections. The hadronic calorimeters (using liquid argon or scintillating tiles as active materials) surround the electromagnetic calorimeter and cover |η| < 4.9. The muon spec-trometer measures the deflection of muon tracks in the field of three large air-core toroidal magnets, each containing eight superconducting coils. It is instrumented with separate trigger chambers (cov-ering |η| < 2.4) and high-precision tracking cham-bers (covering |η| < 2.7).
3. Data and Monte Carlo Samples
The collision data used in this analysis are se-lected such that all elements of the ATLAS de-tector were delivering high-quality data. In the ZH → ℓ+ℓ−b¯b and the W H → ℓνb¯b analyses,
events were primarily collected using single-lepton triggers with a transverse momentum (pT)
thresh-old of 20 GeV for electrons, which was raised to 22 GeV as the instantaneous luminosity increased, and 18 GeV for muons. In the ZH → ℓ+ℓ−b¯b
anal-ysis, these triggers were supplemented with a di-electron trigger with a threshold of 12 GeV. The lepton trigger efficiency is measured using a sam-ple of Z → ℓ+ℓ− events. The resulting efficiency,
relative to the offline selection, is close to 100% for ZH → e+e−b¯b and W H → eνb¯b. It is around 95%
for the ZH → µ+µ−b¯b channel and 90% for the
W H → µνb¯b channel, due to the lower angular cov-erage of the muon trigger chambers with respect to the precision tracking chambers. The missing trans-verse energy (Emiss
T ) trigger used for the ZH →
ν ¯νb¯b channel has a threshold of 70 GeV and an ef-ficiency above 50% for Emiss
T above 120 GeV. This
efficiency exceeds 99% for Emiss
T above 170 GeV.
The efficiency curve is measured in a sample of W → µν + jet events collected using muon triggers, which do not rely on the presence of Emiss
T . The
the detector and the z-axis coinciding with the axis of the beam pipe. The x-axis points from the IP to the centre of the LHC ring, and the y-axis points upward. Cylindrical co-ordinates (r,φ) are used in the transverse plane, φ being the azimuthal angle around the beam pipe. The pseudorapidity is defined in terms of the polar angle θ as η = − ln tan(θ/2). For the purpose of the fiducial selection, this is calculated relative to the geometric centre of the detector; otherwise, it is relative to the reconstructed primary vertex of each event.
Monte Carlo (MC) simulation predicts the trigger efficiency to be 5% higher than that observed in collision data for 120 GeV ≤ Emiss
T < 160 GeV and
agrees for Emiss
T ≥ 160 GeV. A correction factor of
0.95 ± 0.01 is therefore applied to the MC in the lower Emiss
T region, and no trigger efficiency
correc-tion is applied elsewhere.
The W H and ZH signal processes are modelled using MC events produced by the Pythia [18] event generator, interfaced with the MRST mod-ified leading-order (LO*) [19] parton distribution functions (PDFs), using the AUET2B tune [20] for the parton shower, hadronization and multiple par-ton interactions. The total cross sections for these channels, as well as their corresponding uncertain-ties, are taken from the LHC Higgs Cross Section Working Group report [21]. Differential next-to-leading order (NLO) electroweak corrections as a function of the W or Z transverse momentum have also been applied [12, 22]. The Higgs boson decay branching ratios are calculated with Hdecay [23].
The background processes are modelled with sev-eral different event generators. The Powheg [24– 26] generator, in combination with MSTW 2008 NLO PDFs [27] and interfaced with the Pythia program for the parton shower and hadronization, is used to simulate W + ≥ 1b jet events. The Sherpa generator [28] is used to simulate Z+≥ 1b jet and Z+≥ 1c jet events. The Alpgen gener-ator [29] interfaced with the Herwig program [30] is used to simulate W + ≥ 1c jet, W + ≥ 1 light jet (i.e. not a c or b jet) and Z+ ≥ 1 light jet events. The above background simulations include γ∗
pro-duction and Z/γ∗ interference where appropriate.
The MC@NLO generator [31], using CT10 NLO PDFs [32] and interfaced to Herwig, is used for the production of top-quarks (single top and top-quark pair production). The Herwig generator, is used to simulate the diboson (ZZ, W Z and W W ) samples. The Herwig generator uses the AUET2 tune [33] for the parton shower and hadronization model, re-lies on MRST LO* PDFs (except for top produc-tion) and is in all cases interfaced to Jimmy [34] for the modelling of multiple parton interactions. MC samples are passed through the full ATLAS detector simulation [35] based on the Geant4 [36] program.
4. Reconstruction and Identification of Physics Objects
Events are required to have at least one recon-structed primary vertex with three or more associ-ated tracks with pT> 0.4 GeV in the inner
detec-tor. If more than one vertex is reconstructed, the primary vertex is chosen as the one with the high-est sum of the squares of the transverse momenta of all its associated tracks.
The charged leptons that are used to reconstruct the vector boson candidate are required to sat-isfy pT > 20 GeV in the ZH → ℓ+ℓ−b¯b channel,
while this cut is increased to pT > 25 GeV in the
W H → ℓνb¯b channel in order to be above the trigger threshold, and maintain a high trigger ef-ficiency. In both cases, the leptons must be central (|η| < 2.47 for electrons and |η| < 2.5 for muons) and have a matching track in the inner detector that is consistent with originating from the primary vertex.
Electron candidates are reconstructed from en-ergy clusters in the electromagnetic calorimeter and are required to pass identification criteria based on the shower shape. Central electrons must have a matching track in the inner detector that is consis-tent with originating from the primary vertex and requirements are placed on track quality and track-cluster matching [37]. Further track and track-cluster related identification criteria are applied to elec-tron candidates in order to reduce background from jets being misidentified as electrons. The criteria are tighter for W decays, where the background is larger. Muons are found by searching for tracks re-constructed in the muon spectrometer with |η| < 2.7. If the muon spectrometer track matches a track in the inner detector, then the muon is re-constructed from a combination of both tracks.
In order to suppress background from semilep-tonic heavy-flavour hadron decays, the leptons are required to be isolated. In the ZH → ℓ+ℓ−b¯b and
W H → ℓνb¯b channels the sum of the transverse mo-menta of all charged tracks (other than those of the charged leptons) reconstructed in the inner detec-tor within a cone of ∆R =p(∆η)2+ (∆φ)2< 0.2
from each charged lepton is required to be less than 10% of the transverse momentum of the lepton it-self. In the W H → ℓνb¯b channel, the isolation re-quirement is strengthened by requiring in addition that the sum of all transverse energy deposits in the calorimeter within a cone of ∆R < 0.3 from the charged lepton be less than 14% of the transverse
energy of the lepton itself.
In order to suppress the top-quark background in the ZH → ν ¯νb¯b channel, events containing elec-trons with |η| < 2.47 and pT> 10 GeV, or muons
with |η| < 2.7 and pT> 10 GeV are removed.
Sim-ilar requirements are applied on any additional lep-ton reconstructed in the W H → ℓνb¯b channel, but the minimum lepton pT is increased to 20 GeV if
the additional lepton has the same charge as, or a different flavour than the signal lepton. Events with forward electrons [37] (2.47 < |η| < 4.5) with pT> 20 GeV are also removed in the W H → ℓνb¯b
channel.
Jets are reconstructed from energy clusters in the calorimeter using the anti-ktalgorithm [38] with a
radius parameter of 0.4. Jet energies are calibrated using pT- and η-dependent correction factors based
on MC simulation and validated with data [39]. A further correction is applied when calculating the di-jet invariant mass, as described in section 5 be-low. The contribution from jets originating from other collisions in the same bunch crossing is re-duced by requiring that at least 75% of the summed transverse momentum of inner detector tracks (with pT > 0.4 GeV) associated with the jet are
com-patible with originating from the primary vertex. Furthermore, a jet is required to have no identi-fied electron within ∆R ≤ 0.4. Only jets with pT > 25 GeV and within the acceptance of the
inner detector (|η| < 2.5) are used to reconstruct Higgs boson candidates. A looser selection, for ad-ditional jets with pT > 20 GeV and |η| < 4.5, is
used to suppress additional hadronic activity in the W H → ℓνb¯b channel.
Jets which originate from b quarks can be distin-guished from other jets by the relatively long life-time of hadrons containing b quarks. Such jets are primarily identified (“b-tagged”) by reconstructing one or more secondary decay vertices from tracks within the jet, or by combining the distances of clos-est approach to the primary event vertex (impact parameters) of tracks in the jet [40–42]. This in-formation is combined into a single discriminant w, such that a jet with higher w is more likely to be a b jet. A selection cut on w is applied, resulting in an efficiency of about 70% for identifying true b jets, with a c jet rejection factor of about 5, and a light jet rejection factor of about 130, evaluated in simulated t¯t events.
The missing transverse momentum and its mag-nitude are measured from the vector sum of the transverse momentum vectors associated with
clus-ters of energy reconstructed in the calorimeclus-ters with |η| < 4.9 [43]. A correction is applied to the energy of those clusters that are associated with a reconstructed physical object (jet, electron, τ -lepton, photon). Reconstructed muons are also in-cluded in the sum, and any calorimeter energy de-posits associated with them are excluded. To sup-plement the calorimeter-based definition of Emiss
T
in the ZH → ν ¯νb¯b channel, the track-based miss-ing transverse momentum, pmiss
T , is calculated from
the vector sum of the transverse momenta of in-ner detector tracks associated with the primary ver-tex [44].
5. Event Selection
Events in the ZH → ℓ+ℓ−b¯b channel are required
to contain exactly two same-flavour leptons. The two leptons must be oppositely charged in the case of muons. This is not required for electrons since energy losses from showering in material in the in-ner detector lead to a higher charge misidentifica-tion probability. The invariant mass of the lepton pair must be in the range 83 GeV < mℓℓ< 99 GeV.
A requirement of Emiss
T < 50 GeV reduces the
back-ground from top-quark production.
Events in the W H → ℓνb¯b channel are required to contain a single charged lepton and Emiss
T >
25 GeV. A requirement on the transverse mass2 of
mT> 40 GeV is imposed to suppress the multijet
background.
The ZH → ν ¯νb¯b selection requires Emiss T >
120 GeV. A requirement of pmiss
T > 30 GeV is
im-posed to suppress events with poorly measured Emiss
T . Cuts on the difference in azimuthal
an-gle between the directions of Emiss
T and pmissT ,
∆φ(ETmiss, pmissT ) < π/2, and the difference in
az-imuthal angle between Emiss
T and the nearest jet
min(∆φ(Emiss
T , jet)) > 1.8 are applied to reduce the
multijet background, which is dominated by one or more jets being mismeasured by the calorimeter.
The transverse momentum of the vector boson, pV
T, is reconstructed from the two leptons in the
ZH → ℓ+ℓ−b¯b channel, from the lepton and Emiss T
in the W H → ℓνb¯b channel and from Emiss T in the
ZH → ν ¯νb¯b channel.
2The transverse mass (m
T) is defined from the
trans-verse momenta and the azimuthal angles of the charged
lepton (pℓ T and φ ℓ ) and neutrino (pν T and φ ν ): mT = q 2pℓ Tp ν T(1 − cos(φ ℓ − φν)), where pν T= E miss T .
Events in all channels are required to contain ex-actly two b-tagged jets, of which one must have pT > 45 GeV and the other pT > 25 GeV. If pVT
is less than 200 GeV the two b-tagged jets are re-quired to have a separation of ∆R > 0.7, to reduce W +jet and Z+jet backgrounds. Additionally, in the ZH → ν ¯νb¯b channel a cut on the separation between the two jets of ∆R < 2.0 (∆R < 1.7) for pV
T < 160 GeV (pVT > 160 GeV) is applied
to reduce the multijet background. Events in the ZH → ℓ+ℓ−b¯b channel may contain additional
non-b-tagged jets, while, in the W H → ℓνb¯b and ZH → ν ¯νb¯b channels, events with additional jets are rejected, to further suppress top-quark back-ground. In the W H → ℓνb¯b analysis, where the top-quark background is dominant, events contain-ing additional jets with |η| < 4.5 and pT> 20 GeV
are rejected, while in the ZH → ν ¯νb¯b channel the selection is restricted to jets with |η| < 2.5 and pT> 25 GeV.
In the ZH → ν ¯νb¯b analysis, further cuts are applied on the azimuthal angle between Emiss
T and
the reconstructed transverse momentum of the b¯b system, ∆φ(b¯b, Emiss
T ), to further reject multijet
background. The cuts are ∆φ(b¯b, Emiss
T ) > 2.7 for
120 < pV
T < 160 GeV and ∆φ(b¯b, ETmiss) > 2.9 for
pV
T≥ 160 GeV.
A search for H → b¯b decays is performed by look-ing for an excess of events above the background ex-pectation in the invariant mass distribution of the b-jet pair (mb¯b). The value of the reconstructed
mb¯b is scaled by a factor of 1.05, obtained from
MC-based studies, to account on average for e.g. losses due to soft muons and neutrinos from b and c hadron decays. To increase the sensitivity of the search, this distribution is examined in bins of pV
T.
As the expected signal is characterized by a rela-tively hard pV
T spectrum, the signal to background
ratio increases with pV
T. The and ZH → ℓ+ℓ−b¯b
and W H → ℓνb¯b channels are examined in four bins of the transverse momentum of the recon-structed W or Z boson, given by: pV
T < 50 GeV,
50 ≤ pV
T < 100 GeV, 100 ≤ pVT < 200 GeV
and pV
T ≥ 200 GeV. In the ZH → ν ¯νb¯b search
three bins are defined: 120 < pV
T < 160 GeV,
160 ≤ pV
T < 200 GeV and pVT ≥ 200 GeV. The
ex-pected signal to background ratios for a Higgs boson signal with mH = 120 GeV vary from about 1% in
the lowest pV
T bins to about 10-15% in the highest
pV
T bins. For this Higgs boson mass, 5.0% and 2.4%
of the ZH → ℓ+ℓ−b¯b and W H → ℓνb¯b events are
with negligible contributions from other final states. On the other hand, the ZH → ν ¯νb¯b analysis has a non-negligible contribution from W H → ℓνb¯b : 2.1% of the ZH → ν ¯νb¯b signal and 0.2% of the W H → ℓνb¯b signal are expected to pass the anal-ysis selection.
6. Background Estimation
Backgrounds are estimated using a combination of data-driven and MC-based techniques. Signif-icant sources of background include top, W +jet, Z+jet, diboson and multijet production. The dom-inant background in the ZH → ℓ+ℓ−b¯b channel
is Z+jet production. In the W H → ℓνb¯b chan-nel both the top-quark and W +jet production are important. In the ZH → ν ¯νb¯b channel, there is a significant contribution from top, W +jet, Z+jet and diboson production. Multijet production is a negligible background, except for the W H → ℓνb¯b channel.
The flavour composition of the W +jet and Z+jet backgrounds is determined partially from data.
The shapes of the mb¯b distribution of the top,
W +jet and Z+jet backgrounds are taken from MC simulation, with the respective normalizations be-ing determined from data. The ratio of sbe-ingle-top to top-pair production is taken from NLO QCD com-putations [45]. Multijet backgrounds are estimated entirely from data. The diboson backgrounds are determined from MC simulation with cross sections normalized to NLO QCD computations [46, 47].
The flavour composition of the W +jet and Z+jet samples is determined using templates produced from three exclusive MC samples containing at least one true b jet, at least one true c jet, or only light jets. The relative normalizations of the three com-ponents are adjusted by fitting the distribution of the b-tagging discriminating variable w found in MC simulation to the distribution found in con-trol data samples dominated by W +jet and Z+jet events. Once the relative normalizations of the flavour components have been fixed, the overall nor-malizations are determined from data in a separate step.
Sidebands in the mb¯b distribution, defined by
se-lecting events with mb¯b < 80 GeV or 150 GeV <
mb¯b < 250 GeV along with the standard event
se-lection, are used to normalize the Z+jet, W +jet and top backgrounds.
In addition, two control regions which are dom-inated by top-quark production are used to
fur-ther constrain the normalization of the top back-ground. The ZH top control region selects events from the sidebands of the Z boson mass peak: mℓℓ∈ [60 GeV, 76 GeV] ∪ [106 GeV, 150 GeV] with
Emiss
T > 50 GeV, while the W H top control region
selects W + 3 jet events with two b-tagged jets. The normalizations of the Z+jet, W +jet and top-quark backgrounds are determined in the ZH → ℓ+ℓ−b¯b or W H → ℓνb¯b channels, by
si-multaneous fits to the sidebands of the mb¯b
distribu-tions, and either the ZH or W H top control regions defined above. In the W H sideband fit, the nor-malizations of the top-quark, the W +2 jet and the W +3 jet distributions are varied. In the ZH side-band fit, the normalizations of the top-quark and Z+jet backgrounds are left floating. The normal-izations of the remaining sub-leading backgrounds are left fixed in the fit at their expectation values from Monte Carlo predictions, except for multi-jet production which is estimated from data. The rela-tive data to MC normalization factors for top-quark background agree with unity to within 20% in both the ZH → ℓ+ℓ−b¯b or W H → ℓνb¯b sideband fits.
The normalization of the top-quark background in the ZH → ℓ+ℓ−b¯b signal region is based on the
ZH sideband and control region fit result, while the normalization of the same background in the ZH → ℓ+ℓ−b¯b and ZH → ν ¯νb¯b signal regions is
based on the W H sideband and control region fit re-sult. Monte Carlo predictions are used to extrapo-late the Z+jet (W +jet) normalizations determined in the ZH → ℓ+ℓ−b¯b (W H → ℓνb¯b ) sidebands
to the signal regions of all three channels. The normalization factors for W +jet and Z+jet range from 0.8 to 2.4 depending on jet flavour and multi-plicity. The MC to data normalization factors are applied to several additional control samples with selections to enhance the Z, W or top-quark contri-butions. After these corrections are applied, good agreement is found with the data in both shape and normalization within the statistical and systematic uncertainties.
The backgrounds from multijet events are esti-mated entirely from collision data. For the ZH → ℓ+ℓ−b¯b channel, the multijet background
normal-ization is determined from the sidebands of the mℓℓ distribution in events containing at least two
jets, and is found to contribute less than 1% and is therefore neglected. Multijet Emiss
T templates for
the W H → ℓνb¯b channel are obtained by selecting events with lepton candidates failing the charged lepton analysis selection, but satisfying looser
lep-ton selections. The normalization is determined by fitting these templates to the Emiss
T distribution. A
30% uncertainty is determined from a comparison between the normalized templates and the data in a multijet-dominated control region, defined by re-quiring Emiss
T < 25 GeV and mT< 40 GeV.
In the ZH → ν ¯νb¯b channel, the multijet background is estimated using three control re-gions defined using two variables, ∆φ(Emiss
T , pmissT )
and min(∆φ(Emiss
T , jets)), which showed no
ap-preciable correlation. The ratio of events with ∆φ(Emiss
T , jet) > 1.8 to those with
min(∆φ(Emiss
T , jet)) < 1.8 is determined for events
with ∆φ(Emiss
T , pmissT ) > π/2. This ratio is then
applied to events with ∆φ(Emiss
T , pmissT ) < π/2 to
estimate the multijet background in the signal re-gion. Upper estimates of the multijet contami-nation in the signal region are found to be 0.85, 0.04 and 0.26 events for 120 < pV
T < 160 GeV,
160 ≤ pV
T < 200 GeV and pVT ≥ 200 GeV,
respec-tively. The accuracy of the estimate is limited by the number of events in the control regions.
The distribution of mℓℓ in the ZH → ℓ+ℓ−b¯b
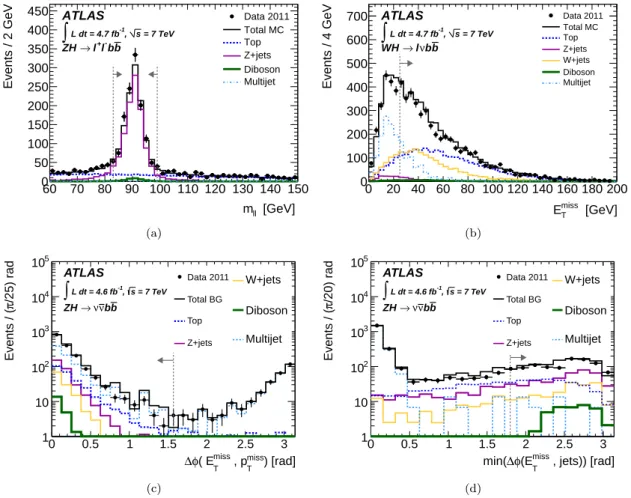
channel is shown in Fig. 1(a) after all analysis requirements have been applied (except for the di-lepton mass cut), including the requirement of two b-tagged jets. The signal region is seen to be dominated by Z+jet with smaller contribu-tions from top-quark and diboson production. The Emiss
T distribution in the W H → ℓνb¯b channel
is shown in Fig. 1(b) after all requirements, ex-cept for the mT and ETmiss cuts. The signal
re-gion is seen to have large contributions from top-quark production and W +jet, with smaller con-tributions from the multijet background, Z+jet and diboson production. Figures 1(c) and 1(d) show the ∆φ(Emiss
T , pmissT ) and min(∆φ(ETmiss, jet))
distributions for the ZH → ν ¯νb¯b channel, af-ter all requirements except for those applied to these variables. The multijet background shape in Figure 1(c) is obtained from data events with min(∆φ(Emiss
T , jet)) < 0.4, after subtracting the
re-maining backgrounds, and normalized to the data in the region defined by ∆φ(Emiss
T , pmissT ) > π/2.
In Figure 1(d), the multijet shape is obtained from events with ∆φ(Emiss
T , pmissT ) > π/2 and normalized
to data events with min(∆φ(Emiss
T , jet)) < 0.4.
It can be seen that the requirements on these variables effectively reduce the multijet back-ground. The signal region has large contributions from Z+jet and top, with smaller contributions from the W +jet, diboson production and multijet
backgrounds. For all distributions, the data are rea-sonably well described by MC simulation and the multijet background, which was determined from data.
7. Systematic Uncertainties
The sources of systematic uncertainty considered are those affecting the various efficiencies (recon-struction, identification, selection), as well as the momentum or energy of physics objects, the nor-malization and shape of the mb¯b distribution of
the signal and background processes, and the tegrated luminosity. Among these, the leading in-strumental uncertainties for all channels are related to the uncertainty on the b-tagging efficiency, which varies between 5% and 19% depending on the b-tagged jet pT [42], and the jet energy scale (JES)
for b-tagged jets which varies between 3% and 14% depending on the jet pT and η [48]. The pT
depen-dence of the b-tagging efficiency has been consid-ered, based on the full covariance matrix of the mea-sured b-tagging efficiency in jet pT intervals [42].
The uncertainty on the flavour composition of the Z + jet and W + jet background is estimated by varying the fraction of Z + c-jets and W + c-jets by 30% as derived from the fit described in Section 6. The uncertainties on the SM Higgs boson inclu-sive cross sections are evaluated by varying the fac-torization and renormalization scales, and by tak-ing into account the uncertainties on the PDFs, on the strong coupling constant and on the H → b¯b branching fraction. These uncertainties are esti-mated to be ≈ 4% for both W H and ZH produc-tion and are treated according to the recommenda-tions given in Refs. [21, 49, 50]. Additional uncer-tainties are considered, as a function of the trans-verse momentum of the W and Z bosons, which range from ≈ 4% to ≈ 8%, depending on chan-nel and on the pW
T or p Z
T interval. These
corre-spond to the difference between the inclusive and differential electroweak corrections [12, 22], and to differences in acceptance between the Pythia and Powheg+Herwig generators. The latter arise mainly from the perturbative QCD model uncer-tainty caused by rejecting events with three or more jets in the W H → ℓνb¯b and ZH → ν ¯νb¯b analyses. The uncertainties on the normalizations of the Z+jet, W +jet and top-quark backgrounds are taken from the statistical uncertainties on the fits to control regions and mb¯bsidebands (see Section 6)
[GeV] ll m 60 70 80 90 100 110 120 130 140 150 Events / 2 GeV 0 50 100 150 200 250 300 350 400 450 Data 2011 Total MC Top Z+jets Diboson Multijet ATLAS = 7 TeV s , -1 L dt = 4.7 fb
∫
b b -l + l → ZH (a) [GeV] miss T E 0 20 40 60 80 100 120 140 160 180 200 Events / 4 GeV 0 100 200 300 400 500 600 700 Data 2011 Total MC Top Z+jets W+jets Diboson Multijet ATLAS = 7 TeV s , -1 L dt = 4.7 fb∫
b b ν l → WH (b) ) [rad] miss T , p miss T ( E φ ∆ 0 0.5 1 1.5 2 2.5 3 /25) rad π Events / ( 1 10 2 10 3 10 4 10 5 10 Data 2011 Total BG Top Z+jets W+jets Diboson Multijet ATLAS = 7 TeV s , -1 L dt = 4.6 fb∫
b b ν ν → ZH (c) , jets)) [rad] miss T (E φ ∆ min( 0 0.5 1 1.5 2 2.5 3 /20) rad π Events / ( 1 10 2 10 3 10 4 10 5 10 Data 2011 Total BG Top Z+jets W+jets Diboson Multijet ATLAS = 7 TeV s , -1 L dt = 4.6 fb∫
b b ν ν → ZH Data 2011 Total BG Top Z+jets (d)Figure 1: (a) The dilepton invariant mass distribution in the ZH → ℓ+ℓ−
b¯b channel, (b) the missing transverse energy without
the mT requirement in the W H → ℓνb¯b channel, (c) the azimuthal angle separation between EmissT and p
miss
T and (d) the
minimum azimuthal separation between Emiss
T and any jet in the ZH → ν ¯νb¯b channel. All distributions are shown for events
containing two b-tagged jets. The various Monte Carlo background distributions are normalized to data sidebands and control distributions and the multi-jet background is entirely estimated from data as described in the text. The vertical dashed lines correspond to the values of the cuts applied in each analysis, and the horizontal arrows indicate the events selected by each cut.
by the remaining sources of systematic uncertainty. The resulting normalization uncertainties are ap-plied to the ZH → ν ¯νb¯b channel. A correlation between the normalizations of the W +jet and top-quark backgrounds is introduced by the simulta-neous fit to the mb¯b sidebands and the W H top
control region in the W H → ℓνb¯b channel. This correlation is taken into account when transferring to the ZH → ν ¯νb¯b channel the uncertainties on the normalization of these backgrounds.
The background normalization corrections are determined in an inclusive way, using all selected events in the ZH → ℓ+ℓ−b¯b and W H → ℓνb¯b
chan-nels, and the shape of the mb¯b and pVT
distribu-tions are in each case taken from the MC simu-lation. Therefore, a possible mismodelling of the underlying mb¯b and pVT distributions, as predicted
by the MC generators, is also considered. An un-certainty due to the shape of the pZ
Tdistribution for
the Z+jet background in the ZH → ℓ+ℓ−b¯b
chan-nel is estimated by finding variations of the MC pZ
T distribution in the mb¯b sidebands which cover
any differences between MC simulation and data. The mb¯b distribution of simulated Z+jet events is
then reweighted according to these variations, to estimate the effect on the final results. An un-certainty due to the modelling of W +jet in the W H → ℓνb¯b channel is estimated by reweighting
the pW
T and mb¯b distributions of simulated W +jet
events by variations motivated by a comparison of different theoretical models (Powheg+Pythia, Powheg+Herwig, aMC@NLO+Herwig [51] and Alpgen+Herwig). Theoretical uncertainties of 11% and 15% are applied to the normalization of the diboson samples and the single-top sample, respectively. The normalization uncertainty for the multijet background is taken to be 30% for W H → ℓνb¯b, as described in Section 6. For ZH → ℓ+ℓ−b¯b
and ZH → ν ¯νb¯b this background is found to be neg-ligible. The uncertainty in the integrated luminos-ity has been estimated to be 3.9% [15, 16]. This un-certainty is applied only to backgrounds for which the normalization is not taken directly from a com-parison between data and MC simulation. Where it is applied, this systematic uncertainty is assumed to be correlated among the different backgrounds.
8. Results
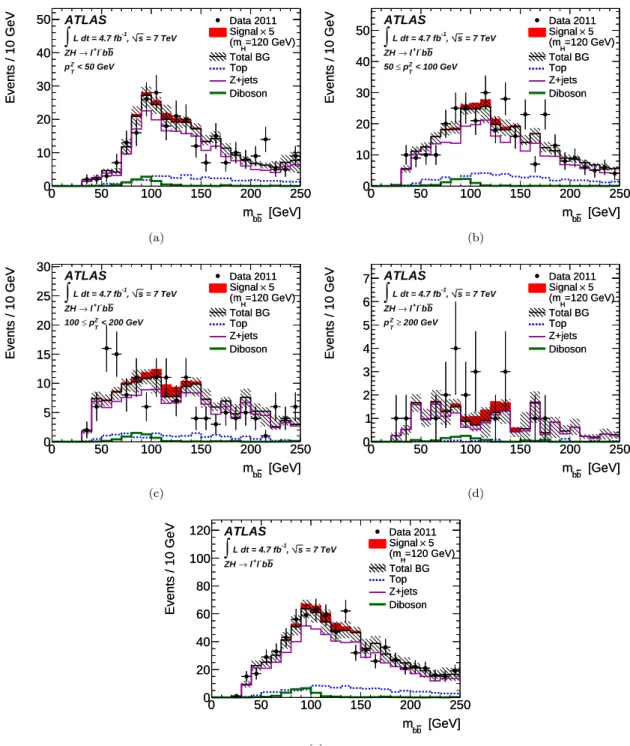
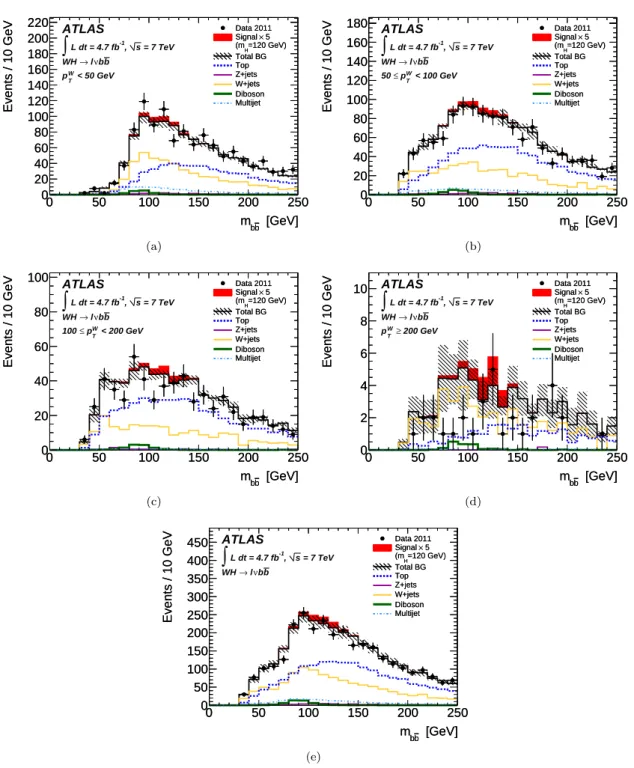
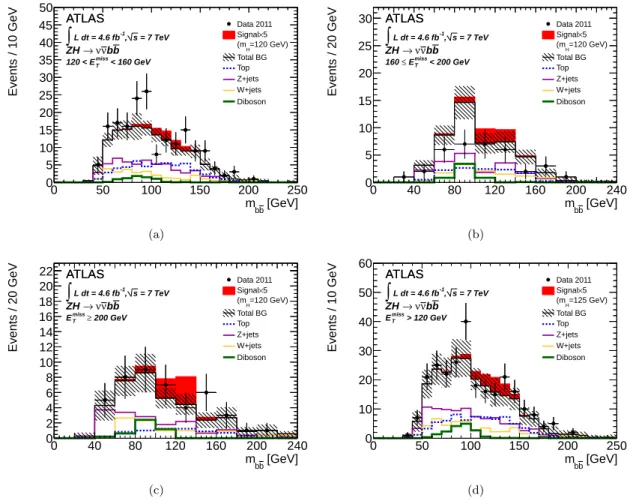
The analysis is performed for five Higgs boson mass hypotheses between 110 GeV and 130 GeVand the signal hypothesis is tested based on a fit to the invariant mass distribution of the b-jet pair, mb¯b, in
the signal region (80 < mb¯b < 150 GeV). The mb¯b
distribution is shown in Figs. 2 – 4 for each channel, separately for different ranges of pV
T. The data
dis-tributions are overlaid with the expectations from the MC simulation and data-driven backgrounds. Within the experimental uncertainty, the data show no excess over the background expectation. The signal shape is dominated by the experimental res-olution on the jet energy measurement. The mb¯b
resolution for signal events is about 16 GeV on av-erage.
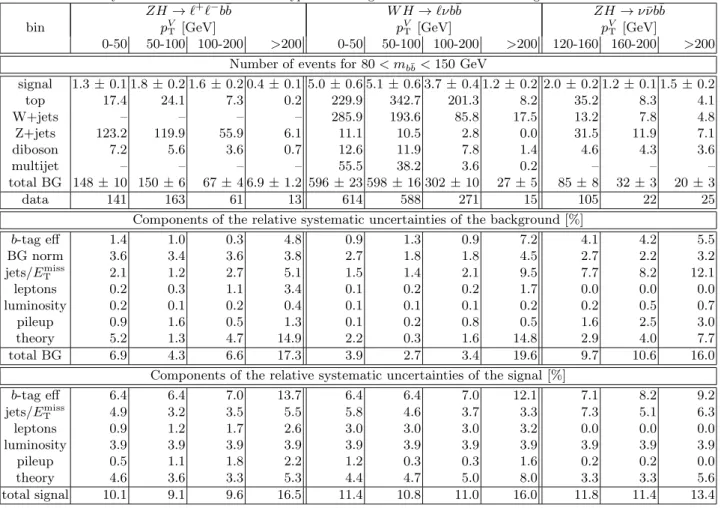
The number of events in the signal region se-lected in data is shown in Table 1 for each chan-nel. The expected number of signal events for mH= 120 GeV is also shown, along with the
corre-sponding estimated number of background events. Also shown are the relative systematic uncertain-ties on the signal and total background yields aris-ing from the followaris-ing sources: b-taggaris-ing efficiency and mis-tag rate, background normalization, jet and Emiss
T uncertainties, lepton reconstruction and
identification, integrated luminosity, overlaid colli-sion events (pileup), and uncertainties on the MC predictions (theory). Uncertainties on the shape of the mb¯b distribution are also taken into account in
the fit.
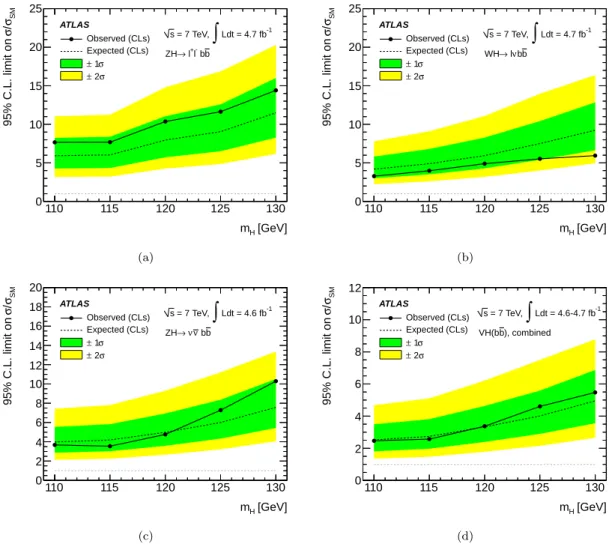
For each Higgs boson mass hypothesis, a one-sided upper limit is placed on the ratio of the Higgs boson production cross section to its SM value, µ = σ/σSM, at the 95% confidence level (CL). The
exclusion limits are derived from the CLs[52]
treat-ment of the p-values computed with the profile like-lihood ratio [53], as implemented in the RooStats program [54], using the binned distribution of mb¯b.
The systematic uncertainties are treated by mak-ing the expected mb¯b templates and sample
nor-malizations dependent on additional fit parameters (“nuisance parameters”), one for each systematic uncertainty, which are then constrained with Gaus-sian terms within their expected uncertainties. The dependence of the mb¯b shapes on the nuisance
pa-rameters is described with bin-by-bin linear inter-polation between the corresponding +1σ or −1σ variations and the nominal case.
The resulting exclusion limits are listed in Ta-ble 2 for each channel and for the statistical combi-nation of the three channels. They are also plotted in Fig. 5. The limits are expressed as the multiple of the SM Higgs boson production cross section which is excluded at 95% CL for each value of the Higgs boson mass. The observed upper limits range be-tween 7.7 and 14.4 for the ZH → ℓ+ℓ−b¯b channel,
between 3.3 and 5.9 for the W H → ℓνb¯b channel and between 3.7 and 10.3 for the ZH → ν ¯νb¯b chan-nel, depending on the Higgs boson mass. The com-bined exclusion limit for the three channels together ranges from 2.5 to 5.5 times the SM cross section, depending on the Higgs boson mass. The limits in-clude systematic uncertainties, the largest of which arise from the top, Z+jet, and W +jet background estimates, the b-tagging efficiency, and the jet en-ergy scale. The systematic uncertainties weaken the limits by 25−40% depending on the search channel. 9. Summary
This Letter presents the results of a direct search by ATLAS for the Standard Model Higgs boson pro-duced in association with a W or Z boson. The following decay channels are considered: ZH → ℓ+ℓ−b¯b, W H → ℓνb¯b and ZH → ν ¯νb¯b, where ℓ
corresponds to an electron or a muon. The mass range 110 < mH < 130 GeV is examined for five
Higgs boson mass hypotheses separated by 5 GeV steps. The three channels use datasets correspond-ing to 4.6 – 4.7 fb−1 of pp collisions at√s = 7 TeV.
Table 1: Number of data, simulated signal, and estimated background events in each bin of pV
T for the W H → ℓνb¯b ,
ZH → ℓ+ℓ−
b¯b and ZH → ν ¯νb¯b channels. The signal corresponds to a Higgs boson mass of mH = 120 GeV. The number of
events is shown for the full signal region (mb¯b∈ [80 GeV, 150 GeV]). Background sources found to be negligible are signalled
with “–”. Relative systematic uncertainties on the hypothesized signal and estimated total background are shown.
ZH → ℓ+ ℓ−b¯b W H → ℓνb¯b ZH → ννb¯¯ b bin pVT [GeV] p V T [GeV] p V T [GeV] 0-50 50-100 100-200 >200 0-50 50-100 100-200 >200 120-160 160-200 >200
Number of events for 80 < mb¯b<150 GeV
signal 1.3 ± 0.1 1.8 ± 0.2 1.6 ± 0.2 0.4 ± 0.1 5.0 ± 0.6 5.1 ± 0.6 3.7 ± 0.4 1.2 ± 0.2 2.0 ± 0.2 1.2 ± 0.1 1.5 ± 0.2 top 17.4 24.1 7.3 0.2 229.9 342.7 201.3 8.2 35.2 8.3 4.1 W+jets – – – – 285.9 193.6 85.8 17.5 13.2 7.8 4.8 Z+jets 123.2 119.9 55.9 6.1 11.1 10.5 2.8 0.0 31.5 11.9 7.1 diboson 7.2 5.6 3.6 0.7 12.6 11.9 7.8 1.4 4.6 4.3 3.6 multijet – – – – 55.5 38.2 3.6 0.2 – – – total BG 148 ± 10 150 ± 6 67 ± 4 6.9 ± 1.2 596 ± 23 598 ± 16 302 ± 10 27 ± 5 85 ± 8 32 ± 3 20 ± 3 data 141 163 61 13 614 588 271 15 105 22 25
Components of the relative systematic uncertainties of the background [%]
b-tag eff 1.4 1.0 0.3 4.8 0.9 1.3 0.9 7.2 4.1 4.2 5.5 BG norm 3.6 3.4 3.6 3.8 2.7 1.8 1.8 4.5 2.7 2.2 3.2 jets/Emiss T 2.1 1.2 2.7 5.1 1.5 1.4 2.1 9.5 7.7 8.2 12.1 leptons 0.2 0.3 1.1 3.4 0.1 0.2 0.2 1.7 0.0 0.0 0.0 luminosity 0.2 0.1 0.2 0.4 0.1 0.1 0.1 0.2 0.2 0.5 0.7 pileup 0.9 1.6 0.5 1.3 0.1 0.2 0.8 0.5 1.6 2.5 3.0 theory 5.2 1.3 4.7 14.9 2.2 0.3 1.6 14.8 2.9 4.0 7.7 total BG 6.9 4.3 6.6 17.3 3.9 2.7 3.4 19.6 9.7 10.6 16.0
Components of the relative systematic uncertainties of the signal [%]
b-tag eff 6.4 6.4 7.0 13.7 6.4 6.4 7.0 12.1 7.1 8.2 9.2 jets/Emiss T 4.9 3.2 3.5 5.5 5.8 4.6 3.7 3.3 7.3 5.1 6.3 leptons 0.9 1.2 1.7 2.6 3.0 3.0 3.0 3.2 0.0 0.0 0.0 luminosity 3.9 3.9 3.9 3.9 3.9 3.9 3.9 3.9 3.9 3.9 3.9 pileup 0.5 1.1 1.8 2.2 1.2 0.3 0.3 1.6 0.2 0.2 0.0 theory 4.6 3.6 3.3 5.3 4.4 4.7 5.0 8.0 3.3 3.3 5.6 total signal 10.1 9.1 9.6 16.5 11.4 10.8 11.0 16.0 11.8 11.4 13.4
Table 2: The observed and expected 95% CL exclusion limits on the Higgs boson cross section for each channel, expressed in multiples of the SM cross section as a function of the hypothesized Higgs boson mass. The last two columns show the combined exclusion limits for the three channels.
Mass ZH → ℓ+ℓ−b¯b W H → ℓνb¯b ZH → ν ¯νb¯b Combined
[GeV] Obs. Exp. Obs. Exp. Obs. Exp. Obs. Exp.
110 7.7 6.0 3.3 4.2 3.7 4.0 2.5 2.5
115 7.7 6.2 4.0 4.9 3.6 4.2 2.6 2.7
120 10.4 8.0 4.9 5.9 4.8 5.0 3.4 3.3
125 11.6 9.1 5.5 7.5 7.3 6.0 4.6 4.0
backgrounds is observed. Upper limits on Higgs bo-son production, at the 95% confidence level, of 2.5 to 5.5 times the Standard Model cross section are obtained in the mass range 110 − 130 GeV. The ex-pected exclusion limits range between 2.5 and 4.9 for the same mass interval.
10. Acknowledgements
We thank CERN for the very successful opera-tion of the LHC, as well as the support staff from our institutions without whom ATLAS could not be operated efficiently.
We acknowledge the support of ANPCyT, Argentina; YerPhI, Armenia; ARC, Australia; BMWF, Austria; ANAS, Azerbaijan; SSTC, Be-larus; CNPq and FAPESP, Brazil; NSERC, NRC and CFI, Canada; CERN; CONICYT, Chile; CAS, MOST and NSFC, China; COLCIENCIAS, Colom-bia; MSMT CR, MPO CR and VSC CR, Czech Re-public; DNRF, DNSRC and Lundbeck Foundation, Denmark; EPLANET and ERC, European Union; IN2P3-CNRS, CEA-DSM/IRFU, France; GNAS, Georgia; BMBF, DFG, HGF, MPG and AvH Foun-dation, Germany; GSRT, Greece; ISF, MINERVA, GIF, DIP and Benoziyo Center, Israel; INFN, Italy; MEXT and JSPS, Japan; CNRST, Morocco; FOM and NWO, Netherlands; RCN, Norway; MNiSW, Poland; GRICES and FCT, Portugal; MERYS (MECTS), Romania; MES of Russia and ROSATOM, Russian Federation; JINR; MSTD, Serbia; MSSR, Slovakia; ARRS and MVZT, Slove-nia; DST/NRF, South Africa; MICINN, Spain; SRC and Wallenberg Foundation, Sweden; SER, SNSF and Cantons of Bern and Geneva, Switzer-land; NSC, Taiwan; TAEK, Turkey; STFC, the Royal Society and Leverhulme Trust, United King-dom; DOE and NSF, United States of America.
The crucial computing support from all WLCG partners is acknowledged gratefully, in particular from CERN and the ATLAS Tier-1 facilities at TRIUMF (Canada), NDGF (Denmark, Norway, Sweden), CC-IN2P3 (France), KIT/GridKA (Ger-many), INFN-CNAF (Italy), NL-T1 (Netherlands), PIC (Spain), ASGC (Taiwan), RAL (UK) and BNL (USA) and in the Tier-2 facilities worldwide. References
[1] F. Englert, R. Brout, Broken symmetry and the mass of gauge vector mesons, Phys. Rev. Lett. 13 (1964) 321– 323. doi:10.1103/PhysRevLett.13.321.
[2] P. W. Higgs, Broken symmetries and the masses of gauge bosons, Phys. Rev. Lett. 13 (1964) 508–509. doi:10.1103/PhysRevLett.13.508.
[3] G. Guralnik, C. Hagen, T. Kibble, Global conservation laws and massless particles, Phys. Rev. Lett. 13 (1964) 585–587. doi:10.1103/PhysRevLett.13.585.
[4] ATLAS Collaboration, Combined search for the
Standard Model Higgs boson using up to 4.9
f b−1 of pp collision data at √s = 7 TeV
with the ATLAS detector at the LHC, Phys.
Lett. B 710 (2012) 49–66. arXiv:1202.1408,
doi:10.1016/j.physletb.2012.02.044.
[5] CMS Collaboration, Combined results of
searches for the standard model Higgs
bo-son in pp collisions at √s = 7 TeV, Phys.
Lett. B 710 (2012) 26–48. arXiv:1202.1488,
doi:10.1016/j.physletb.2012.02.064.
[6] LEP Working Group for Higgs boson searches, Search for the Standard Model Higgs boson at LEP, Phys.
Lett. B 565 (2003) 61–75. arXiv:hep-ex/0306033,
doi:10.1016/S0370-2693(03)00614-2.
[7] Combined CDF and D0 Upper Limits on Standard
Model Higgs Boson Production with up to 8.6 fb−1 of
DataarXiv:arXiv:1107.5518.
[8] T. Han, S. Willenbrock, QCD correction to the pp → WH and ZH total cross-sections, Phys. Lett. B273 (1991) 167–172. doi:10.1016/0370-2693(91)90572-8. [9] O. Brein, A. Djouadi, R. Harlander, NNLO QCD
cor-rections to the Higgs-strahlung processes at hadron col-liders, Phys. Lett. B 579 (2004) 149–156.
[10] M. L. Ciccolini, S. Dittmaier, M. Kr¨amer, Electroweak
radiative corrections to associated WH and ZH produc-tion at hadron colliders, Phys. Rev. D68 (2003) 073003. [11] A. Denner, et al., Electroweak corrections to Higgs-strahlung off W/Z bosons at the Tevatron and the LHC with HAWKarXiv:1112.5142.
[12] G. Ferrera, M. Grazzini, F. Tramontano,
As-sociated WH production at hadron colliders:
a fully exclusive QCD calculation at NNLO,
Phys.Rev.Lett. 107 (2011) 152003. arXiv:1107.1164, doi:10.1103/PhysRevLett.107.152003.
[13] J. M. Butterworth, A. R. Davison, M.
Ru-bin, G. P. Salam, Jet substructure as a new
Higgs search channel at the LHC, Phys. Rev.
Lett. 100 (2008) 242001. arXiv:0802.2470,
doi:10.1103/PhysRevLett.100.242001.
[14] CMS Collaboration, Search for the
stan-dard model Higgs boson decaying to bottom
quarks in pp collisions at √s=7 TeV, Phys.
Lett.B 710 (2012) 284–306. arXiv:1202.4195,
doi:10.1016/j.physletb.2012.02.085.
[15] Luminosity Determination in pp Collisions at √s =
7 TeV Using the ATLAS Detector at the LHC, Eur. Phys. J. C 71 (2011) 1630. arXiv:hep-ex/1101.2185.
[16] Luminosity Determination in pp Collisions at √s =
7 TeV using the ATLAS Detector in 2011, ATLAS-CONF-2011-116.
[17] The ATLAS Experiment at the CERN Large Hadron Collider, JINST 3 (2008) S08003.
[18] T. Sjostrand, S. Mrenna, P. Z. Skands,
PYTHIA 6.4 Physics and Manual, JHEP
05 (2006) 026. arXiv:hep-ph/0603175,
doi:10.1088/1126-6708/2006/05/026.
[19] A. Sherstnev, R. Thorne, Parton
C55 (2008) 553–575. arXiv:0711.2473, doi:10.1140/epjc/s10052-008-0610-x.
[20] ATLAS tunes of PYTHIA6 and Pythia8
for MC11,
ATL-PHYS-PUB-2011-009arXiv:http://cdsweb.cern.ch/record/1363300. [21] LHC Higgs Cross Section Working Group, S. Dittmaier,
C. Mariotti, G. Passarino, R. Tanaka (Eds.), Handbook of LHC Higgs cross sections: 1. Inclusive observables, CERN-2011-002arXiv:1101.0593.
[22] S. Dittmaier, S. Dittmaier, C. Mariotti, G. Passarino, R. Tanaka, et al., Handbook of LHC Higgs Cross Sec-tions: 2. Differential DistributionsReport of the LHC Higgs Cross Section Working Group. arXiv:1201.3084. [23] A. Djouadi, J. Kalinowski, M. Spira, HDECAY: A pro-gram for Higgs boson decays in the Standard Model and its supersymmetric extension, Comput. Phys. Commun. 108 (1998) 56–74.
[24] S. Alioli and others, NLO Higgs boson production via gluon fusion matched with shower in POWHEG, JHEP 0904 (2009) 002. arXiv:0812.0578.
[25] P. Nason, C. Oleari, NLO Higgs boson production via vector-boson fusion matched with shower in POWHEG, JHEP 1002 (2010) 037. arXiv:0911.5299.
[26] C. Oleari, L. Reina, W±
b¯b production in POWHEG,
JHEP 1108 (2011) 061. arXiv:1105.4488,
doi:10.1007/JHEP08(2011)061,10.1007/JHEP11(2011)040. [27] A. D. Martin, et al., Parton distributions for the LHC,
Eur. Phys. J. C63 (2009) 189–285. arXiv:0901.0002, doi:10.1140/epjc/s10052-009-1072-5.
[28] T. Gleisberg, et al., Event generation with SHERPA
1.1, JHEP 02 (2009) 007. arXiv:0811.4622,
doi:10.1088/1126-6708/2009/02/007.
[29] M. L. Mangano, et al., ALPGEN, a generator for hard multi-parton processes in hadronic collisions, JHEP 07 (2003) 001.
[30] G. Corcella, et al., HERWIG 6: an event generator for hadron emission reactions with interfering gluons (including super-symmetric processes), JHEP 01 (2001) 010. doi:10.1088/1126-6708/2001/01/010.
[31] S. Frixione, B. R. Webber, Matching NLO QCD compu-tations and parton shower simulations, JHEP 06 (2002) 029. arXiv:hep-ph/0204244.
[32] H.-L. Lai, M. Guzzi, J. Huston, Z. Li, P. M. Nadol-sky, et al., New parton distributions for collider physics,
Phys. Rev. D82 (2010) 074024. arXiv:1007.2241,
doi:10.1103/PhysRevD.82.074024.
[33] New atlas event generator tunes to
2010 data, Tech. Rep.
ATL-PHYS-PUB-2011-008, CERN, Geneva (2011).
arXiv:https://cdsweb.cern.ch/record/1345343. [34] J. M. Butterworth, J. R. Forshaw, M. H. Seymour,
Mul-tiparton interactions in photoproduction at HERA, Z.
Phys. C 72 (1996) 637–646. arXiv:hep-ph/9601371,
doi:10.1007/s002880050286.
[35] The ATLAS Simulation Infrastructure, Eur.
Phys. J. C 70 (2010) 823–874. arXiv:1005.4568,
doi:10.1140/epjc/s10052-010-1429-9.
[36] S. Agostinelli, et al., GEANT4: A simulation
toolkit, Nucl. Instrum. Meth. A 506 (2003) 250–303. doi:10.1016/S0168-9002(03)01368-8.
[37] Electron performance measurements with
the ATLAS detector using the 2010 LHC
proton-proton collision data, Eur. Phys.
J C72 (2012) 1909. arXiv:1110.3174v2,
doi:10.1140/epjc/s10052-012-1909-1.
[38] M. Cacciari, G. P. Salam, G. Soyez,
The anti-kT jet clustering algorithm,
JHEP 04 (2008) 063. arXiv:0802.1189,
doi:10.1088/1126-6708/2008/04/063.
[39] Jet energy measurement with the atlas detector in proton-proton collisions at sqrt(s) = 7 tevSubmitted to Eur. Phys. J. C. arXiv:1112.6426.
[40] b-jet tagging calibration on c-jets
con-taining d*+ mesons,
ATLAS-CONF-2012-039arXiv:https://cdsweb.cern.ch/record/1435193.
[41] Measurement of the mistag rate with 5 fb1
of data collected by the atlas detector, ATLAS-CONF-2012-040arXiv:https://cdsweb.cern.ch/record/1435194. [42] Measurement of the b-tag efficiency in a
sam-ple of jets containing muons with 5 fb-1 of
data from the atlas detector, ATLAS-CONF-2012-043arXiv:https://cdsweb.cern.ch/record/1435197. [43] Performance of missing transverse momentum
recon-struction in proton-proton collisions at√s = 7 tev with
atlas, Eur. Phys. J. C 72 (2012) 1844. arXiv:1108.5602.
[44] Measurement of the missing transverse
momen-tum based on tracks in proton-proton
colli-sions at √s = 900 gev centre-of-mass energy
with the atlas detector,
ATLAS-CONF-2010-020arXiv:https://cdsweb.cern.ch/record/1277652. [45] M. Aliev, et al., HATHOR – HAdronic Top and Heavy
quarks crOss section calculatoR, Comput. Phys. Com-mun. 182 (2011) 1034. arXiv:1007.1327.
[46] J. M. Campbell, R. K. Ellis, An update on vec-tor boson pair production at hadron colliders, Phys.
Rev. D 60 (1999) 113006. arXiv:hep-ph/9905386,
doi:10.1103/PhysRevD.60.113006.
[47] Binoth, T. and Ciccolini, M. and Kauer, N. and
Kr¨amer, M., Gluon-induced w-boson pair production at
the lhc, JHEP 12 (2006) 046. arXiv:hep-ph/0611170v1.
[48] Update on the jet energy scale
system-atic uncertainty for jets produced in
proton-proton collisions at √s = 7 tev measured
with the atlas detector,
ATLAS-CONF-2011-007arXiv:https://cdsweb.cern.ch/record/1330713.
[49] M. Botje, J. Butterworth, A. Cooper-Sarkar,
A. de Roeck, J. Feltesse, et al., The PDF4LHC working group interim recommendationsarXiv:1101.0538. [50] R. D. Ball, et al., Impact of heavy quark masses
on parton distributions and LHC phenomenology, Nucl. Phys. B849 (2011) 296–363. arXiv:1101.1300, doi:10.1016/j.nuclphysb.2011.03.021.
[51] R. Frederix, S. Frixione, V. Hirschi, F. Maltoni, R. Pit-tau, et al., W and Z/γ∗ boson production in association with a bottom-antibottom pair, JHEP 1109 (2011) 061. arXiv:1106.6019, doi:10.1007/JHEP09(2011)061.
[52] A. L. Read, Presentation of search results: the CLs
technique, J. Phys. G 28 (2002) 2693–2704.
[53] G. Cowan, K. Cranmer, E. Gross, O. Vitells, Asymp-totic formulae for likelihood-based tests of new physics, Eur. Phys. J. C 71 (2011) 1554. arXiv:1007.1727v2, doi:10.1140/epjc/s10052-011-1554-0.
[54] L. Moneta, et al., The RooStats Project, in: Pro-ceedings of the 13th International Workshop on Ad-vanced Computing and Analysis Techniques in Physics Research, ACAT2010, Proceedings of Science, 2010. arXiv:1009.1003.
[GeV] b b m 0 50 100 150 200 250 Events / 10 GeV 0 10 20 30 40 50 Data 2011 5 × Signal =120 GeV) H (m Total BG Top Z+jets Diboson ATLAS = 7 TeV s , -1 L dt = 4.7 fb
∫
b b -l + l → ZH < 50 GeV Z T p Data 2011 5 × Signal =120 GeV) H (m Total BG Top Z+jets Diboson [GeV] b b m 0 50 100 150 200 250 Events / 10 GeV 0 10 20 30 40 50 (a) [GeV] b b m 0 50 100 150 200 250 Events / 10 GeV 0 10 20 30 40 50 Data 2011Signal × 5 =120 GeV) H (m Total BG Top Z+jets Diboson ATLAS = 7 TeV s , -1 L dt = 4.7 fb∫
b b -l + l → ZH < 100 GeV Z T p ≤ 50 Data 2011 5 × Signal =120 GeV) H (m Total BG Top Z+jets Diboson [GeV] b b m 0 50 100 150 200 250 Events / 10 GeV 0 10 20 30 40 50 (b) [GeV] b b m 0 50 100 150 200 250 Events / 10 GeV 0 5 10 15 20 25 30 Data 2011 5 × Signal =120 GeV) H (m Total BG Top Z+jets Diboson ATLAS = 7 TeV s , -1 L dt = 4.7 fb∫
b b -l + l → ZH < 200 GeV Z T p ≤ 100 Data 2011 5 × Signal =120 GeV) H (m Total BG Top Z+jets Diboson [GeV] b b m 0 50 100 150 200 250 Events / 10 GeV 0 5 10 15 20 25 30 (c) [GeV] b b m 0 50 100 150 200 250 Events / 10 GeV 0 1 2 3 4 5 6 7 Data 2011 5 × Signal =120 GeV) H (m Total BG Top Z+jets Diboson ATLAS = 7 TeV s , -1 L dt = 4.7 fb∫
b b -l + l → ZH 200 GeV ≥ Z T p Data 2011 5 × Signal =120 GeV) H (m Total BG Top Z+jets Diboson [GeV] b b m 0 50 100 150 200 250 Events / 10 GeV 0 1 2 3 4 5 6 7 (d) [GeV] b b m 0 50 100 150 200 250 Events / 10 GeV 0 20 40 60 80 100 120 Data 2011 5 × Signal =120 GeV) H (m Total BG Top Z+jets Diboson ATLAS = 7 TeV s , -1 L dt = 4.7 fb∫
b b -l + l → ZH Data 2011 5 × Signal =120 GeV) H (m Total BG Top Z+jets Diboson [GeV] b b m 0 50 100 150 200 250 Events / 10 GeV 0 20 40 60 80 100 120 (e)Figure 2: The invariant mass mb¯b for ZH → ℓ+ℓ
−
b¯b shown for the different pZ
T bins: (a) 0 < p Z T< 50 GeV, (b) 50 ≤ p Z T< 100 GeV, (c) 100 ≤ pZ T< 200 GeV, (d) p Z
T≥ 200 GeV and (e) for the combination of all p
Z
Tbins. The signal distributions are
shown for mH= 120 GeV and are enhanced by a factor of five for visibility. The shaded area indicates the total uncertainty on
the background prediction. For better visibility, the signal histogram is stacked onto the total background, unlike the various background components which are simply overlaid in the figure.
[GeV] b b m 0 50 100 150 200 250 Events / 10 GeV 0 20 40 60 80 100 120 140 160 180 200 220 Data 2011 5 × Signal =120 GeV) H (m Total BG Top Z+jets W+jets Diboson Multijet ATLAS = 7 TeV s , -1 L dt = 4.7 fb
∫
b b ν l → WH < 50 GeV W T p Data 2011 5 × Signal =120 GeV) H (m Total BG Top Z+jets W+jets Diboson Multijet [GeV] b b m 0 50 100 150 200 250 Events / 10 GeV 0 20 40 60 80 100 120 140 160 180 200 220 (a) [GeV] b b m 0 50 100 150 200 250 Events / 10 GeV 0 20 40 60 80 100 120 140 160 180 Data 2011 5 × Signal =120 GeV) H (m Total BG Top Z+jets W+jets Diboson Multijet ATLAS = 7 TeV s , -1 L dt = 4.7 fb∫
b b ν l → WH < 100 GeV W T p ≤ 50 Data 2011 5 × Signal =120 GeV) H (m Total BG Top Z+jets W+jets Diboson Multijet [GeV] b b m 0 50 100 150 200 250 Events / 10 GeV 0 20 40 60 80 100 120 140 160 180 (b) [GeV] b b m 0 50 100 150 200 250 Events / 10 GeV 0 20 40 60 80 100 Data 2011 5 × Signal =120 GeV) H (m Total BG Top Z+jets W+jets Diboson Multijet ATLAS = 7 TeV s , -1 L dt = 4.7 fb∫
b b ν l → WH < 200 GeV W T p ≤ 100 Data 2011 5 × Signal =120 GeV) H (m Total BG Top Z+jets W+jets Diboson Multijet [GeV] b b m 0 50 100 150 200 250 Events / 10 GeV 0 20 40 60 80 100 (c) [GeV] b b m 0 50 100 150 200 250 Events / 10 GeV 0 2 4 6 8 10 Data 2011Signal × 5 =120 GeV) H (m Total BG Top Z+jets W+jets Diboson Multijet ATLAS = 7 TeV s , -1 L dt = 4.7 fb∫
b b ν l → WH 200 GeV ≥ W T p Data 2011 5 × Signal =120 GeV) H (m Total BG Top Z+jets W+jets Diboson Multijet [GeV] b b m 0 50 100 150 200 250 Events / 10 GeV 0 2 4 6 8 10 (d) [GeV] b b m 0 50 100 150 200 250 Events / 10 GeV 0 50 100 150 200 250 300 350 400 450 Data 2011Signal × 5 =120 GeV) H (m Total BG Top Z+jets W+jets Diboson Multijet ATLAS = 7 TeV s , -1 L dt = 4.7 fb∫
b b ν l → WH Data 2011 5 × Signal =120 GeV) H (m Total BG Top Z+jets W+jets Diboson Multijet [GeV] b b m 0 50 100 150 200 250 Events / 10 GeV 0 50 100 150 200 250 300 350 400 450 (e)Figure 3: The invariant mass mb¯bfor W H → ℓνb¯b shown for the different p
W T bins: (a) 0 < p W T < 50 GeV, (b) 50 ≤ p W T < 100 GeV, (c) 100 ≤ pW T < 200 GeV, (d) p W
T ≥ 200 GeV and (e) for the combination of all p
W
Tbins. The signal distributions are
shown for mH= 120 GeV and are enhanced by a factor of five for visibility. The shaded area indicates the total uncertainty on
the background prediction. For better visibility, the signal histogram is stacked onto the total background, unlike the various background components which are simply overlaid in the figure.
[GeV] b b m 0 50 100 150 200 250 Events / 10 GeV 0 5 10 15 20 25 30 35 40 45 50 Data 2011 5 × Signal =120 GeV) H (m Total BG Top Z+jets W+jets Diboson ATLAS ATLAS = 7 TeV s , -1 L dt = 4.6 fb
∫
< 160 GeV miss T 120 < E b b ν ν → ZH (a) [GeV] b b m 0 40 80 120 160 200 240 Events / 20 GeV 0 5 10 15 20 25 30 Data 2011 5 × Signal =120 GeV) H (m Total BG Top Z+jets W+jets Diboson ATLAS ATLAS = 7 TeV s , -1 L dt = 4.6 fb∫
< 200 GeV miss T E ≤ 160 b b ν ν → ZH (b) [GeV] b b m 0 40 80 120 160 200 240 Events / 20 GeV 0 2 4 6 8 10 12 14 16 18 20 22 Data 2011 5 × Signal =120 GeV) H (m Total BG Top Z+jets W+jets Diboson ATLAS ATLAS = 7 TeV s , -1 L dt = 4.6 fb∫
200 GeV ≥ miss T E b b ν ν → ZH (c) [GeV] b b m 0 50 100 150 200 250 Events / 10 GeV 0 10 20 30 40 50 60 Data 2011 5 × Signal =125 GeV) H (m Total BG Top Z+jets W+jets Diboson ATLAS ATLAS = 7 TeV s , -1 L dt = 4.6 fb∫
> 120 GeV miss T E b b ν ν → ZH (d)Figure 4: The invariant mass mb¯bfor ZH → ν ¯νb¯b shown for the different pZTbins: (a) 120 < p
Z
T < 160 GeV, (b) 160 ≤ p
Z T<
200 GeV, (c) pZ
T≥ 200 GeV and (d) for the combination of all p
Z
T bins. The signal distributions are shown for mH= 120 GeV
and are enhanced by a factor of five for visibility. The shaded area indicates the total uncertainty on the background prediction. For better visibility, the signal histogram is stacked onto the total background, unlike the various background components which are simply overlaid in the figure.
[GeV] H m 110 115 120 125 130 SM σ / σ 95% C.L. limit on 0 5 10 15 20 25 Observed (CLs) Expected (CLs) σ 1 ± σ 2 ± b b -l + l → ZH ATLAS -1 Ldt = 4.7 fb
∫
= 7 TeV, s (a) [GeV] H m 110 115 120 125 130 SM σ / σ 95% C.L. limit on 0 5 10 15 20 25 Observed (CLs) Expected (CLs) σ 1 ± σ 2 ± b b ν l → WH ATLAS -1 Ldt = 4.7 fb∫
= 7 TeV, s (b) [GeV] H m 110 115 120 125 130 SM σ / σ 95% C.L. limit on 0 2 4 6 8 10 12 14 16 18 20 Observed (CLs) Expected (CLs) σ 1 ± σ 2 ± b b ν ν → ZH ATLAS -1 Ldt = 4.6 fb∫
= 7 TeV, s (c) [GeV] H m 110 115 120 125 130 SM σ / σ 95% C.L. limit on 0 2 4 6 8 10 12 Observed (CLs) Expected (CLs) σ 1 ± σ 2 ± ), combined b VH(b ATLAS -1 Ldt = 4.6-4.7 fb∫
= 7 TeV, s (d)Figure 5: Expected (dashed) and observed (solid line) exclusion limits for (a) the ZH → ℓ+ℓ−
b¯b , (b) W H → ℓνb¯b and (c)
ZH → ν ¯νb¯b channels expressed as the ratio to the SM Higgs boson cross section, using the profile-likelihood method with CLs.
The dark (green) and light (yellow) areas represent the 1σ and 2σ ranges of the expectation in the absence of a signal. (d) shows the 95% confidence level exclusion limits obtained from the combination of the three channels.
The ATLAS Collaboration
G. Aad48, B. Abbott111, J. Abdallah11,
S. Abdel Khalek115, A.A. Abdelalim49,
O. Abdinov10, B. Abi112, M. Abolins88,
O.S. AbouZeid158, H. Abramowicz153,
H. Abreu136, E. Acerbi89a,89b,
B.S. Acharya164a,164b, L. Adamczyk37,
D.L. Adams24, T.N. Addy56, J. Adelman176,
S. Adomeit98, P. Adragna75, T. Adye129,
S. Aefsky22, J.A. Aguilar-Saavedra124b,a,
M. Agustoni16, M. Aharrouche81, S.P. Ahlen21,
F. Ahles48, A. Ahmad148, M. Ahsan40,
G. Aielli133a,133b, T. Akdogan18a,
T.P.A. ˚Akesson79, G. Akimoto155, A.V. Akimov94,
M.S. Alam1, M.A. Alam76, J. Albert169,
S. Albrand55, M. Aleksa29, I.N. Aleksandrov64,
F. Alessandria89a, C. Alexa25a, G. Alexander153,
G. Alexandre49, T. Alexopoulos9,
M. Alhroob164a,164c, M. Aliev15, G. Alimonti89a,
J. Alison120, B.M.M. Allbrooke17, P.P. Allport73,
S.E. Allwood-Spiers53, J. Almond82,
A. Aloisio102a,102b, R. Alon172, A. Alonso79,
F. Alonso70, B. Alvarez Gonzalez88,
M.G. Alviggi102a,102b, K. Amako65, C. Amelung22,
V.V. Ammosov128,∗, A. Amorim124a,b,
N. Amram153, C. Anastopoulos29, L.S. Ancu16,
N. Andari115, T. Andeen34, C.F. Anders58b,
G. Anders58a, K.J. Anderson30,
A. Andreazza89a,89b, V. Andrei58a,
X.S. Anduaga70, P. Anger43, A. Angerami34,
F. Anghinolfi29, A. Anisenkov107, N. Anjos124a,
A. Annovi47, A. Antonaki8, M. Antonelli47,
A. Antonov96, J. Antos144b, F. Anulli132a,
S. Aoun83, L. Aperio Bella4, R. Apolle118,c,
G. Arabidze88, I. Aracena143, Y. Arai65,
A.T.H. Arce44, S. Arfaoui148, J-F. Arguin14,
E. Arik18a,∗, M. Arik18a, A.J. Armbruster87,
O. Arnaez81, V. Arnal80, C. Arnault115,
A. Artamonov95, G. Artoni132a,132b,
D. Arutinov20, S. Asai155, R. Asfandiyarov173,
S. Ask27, B. ˚Asman146a,146b, L. Asquith5,
K. Assamagan24, A. Astbury169, B. Aubert4, E. Auge115, K. Augsten127, M. Aurousseau145a,
G. Avolio163, R. Avramidou9, D. Axen168,
G. Azuelos93,d, Y. Azuma155, M.A. Baak29,
G. Baccaglioni89a, C. Bacci134a,134b, A.M. Bach14,
H. Bachacou136, K. Bachas29, M. Backes49,
M. Backhaus20, E. Badescu25a,
P. Bagnaia132a,132b, S. Bahinipati2, Y. Bai32a,
D.C. Bailey158, T. Bain158, J.T. Baines129,
O.K. Baker176, M.D. Baker24, S. Baker77,
E. Banas38, P. Banerjee93, Sw. Banerjee173,
D. Banfi29, A. Bangert150, V. Bansal169,
H.S. Bansil17, L. Barak172, S.P. Baranov94,
A. Barbaro Galtieri14, T. Barber48,
E.L. Barberio86, D. Barberis50a,50b, M. Barbero20,
D.Y. Bardin64, T. Barillari99, M. Barisonzi175,
T. Barklow143, N. Barlow27, B.M. Barnett129,
R.M. Barnett14, A. Baroncelli134a, G. Barone49,
A.J. Barr118, F. Barreiro80, J. Barreiro Guimar˜aes
da Costa57, P. Barrillon115, R. Bartoldus143,
A.E. Barton71, V. Bartsch149, R.L. Bates53,
L. Batkova144a, J.R. Batley27, A. Battaglia16,
M. Battistin29, F. Bauer136, H.S. Bawa143,e,
S. Beale98, T. Beau78, P.H. Beauchemin161,
R. Beccherle50a, P. Bechtle20, H.P. Beck16,
A.K. Becker175, S. Becker98, M. Beckingham138,
K.H. Becks175, A.J. Beddall18c, A. Beddall18c,
S. Bedikian176, V.A. Bednyakov64, C.P. Bee83,
M. Begel24, S. Behar Harpaz152, M. Beimforde99,
C. Belanger-Champagne85, P.J. Bell49,
W.H. Bell49, G. Bella153, L. Bellagamba19a,
F. Bellina29, M. Bellomo29, A. Belloni57,
O. Beloborodova107,f, K. Belotskiy96,
O. Beltramello29, O. Benary153,
D. Benchekroun135a, K. Bendtz146a,146b,
N. Benekos165, Y. Benhammou153,
E. Benhar Noccioli49, J.A. Benitez Garcia159b,
D.P. Benjamin44, M. Benoit115, J.R. Bensinger22,
K. Benslama130, S. Bentvelsen105, D. Berge29,
E. Bergeaas Kuutmann41, N. Berger4,
F. Berghaus169, E. Berglund105, J. Beringer14,
P. Bernat77, R. Bernhard48, C. Bernius24,
T. Berry76, C. Bertella83, A. Bertin19a,19b,
F. Bertolucci122a,122b, M.I. Besana89a,89b,
G.J. Besjes104, N. Besson136, S. Bethke99,
W. Bhimji45, R.M. Bianchi29, M. Bianco72a,72b,
O. Biebel98, S.P. Bieniek77, K. Bierwagen54,
J. Biesiada14, M. Biglietti134a, H. Bilokon47,
M. Bindi19a,19b, S. Binet115, A. Bingul18c,
C. Bini132a,132b, C. Biscarat178, U. Bitenc48,
K.M. Black21, R.E. Blair5, J.-B. Blanchard136,
G. Blanchot29, T. Blazek144a, C. Blocker22,
J. Blocki38, A. Blondel49, W. Blum81, U. Blumenschein54, G.J. Bobbink105,
V.B. Bobrovnikov107, S.S. Bocchetta79,
A. Bocci44, C.R. Boddy118, M. Boehler41,
J. Boek175, N. Boelaert35, J.A. Bogaerts29,
A. Bogdanchikov107, A. Bogouch90,∗,
C. Bohm146a, J. Bohm125, V. Boisvert76,
T. Bold37, V. Boldea25a, N.M. Bolnet136,
M. Bomben78, M. Bona75, M. Boonekamp136,