Universidade de Trás-os-Montes e Alto Douro
The Impact of Internal and External Loads in the Neuromuscular and
Mechanical Properties of Hamstring Muscles in Football Players
Master Thesis International Master in Performance Analysis of Sport
Tiago Moreira da Silva
Orientador: Professor Doutor Nuno Miguel Correia Leite
Coorientador: Professor Doutor Danguole Satkunskiene
ii
Universidade de Trás-os-Montes e Alto Douro
The Impact of Internal and External Loads in the Neuromuscular and
Mechanical Properties of Hamstring Muscles in Football Players
Master Thesis International Master in Performance Analysis of Sport
Tiago Moreira da Silva
Orientador: Professor Doutor Nuno Miguel Correia Leite
Coorientador: Professora Doutor Danguole Satkunskiene
Composição Júri:
Catarina Isabel Neto Gavião Abrantes
Sara Diana Leal dos Santos
Nuno Miguel Correia Leite
iii
Declaração
Nome: Tiago Moreira da Silva C.C: 14013804
Telemóvel: (+351) 96506765
Correio Eletrónico: tiagom.silva@hotmail.com
Designação do Mestrado: Mestrado Internacional em Análise da Performance Desportiva Título da dissertação: “The Impact of Internal and External Loads in the Neuromuscular and
Mechanical Properties of Hamstring Muscles in Football Players”
Orientador: Professor Doutor Nuno Miguel Correia Leite Coorientador: Professor Doutor Danguole Satkunskiene Ano de Conclusão: 2018
Declaro que esta dissertação de mestrado é o resultado de uma pesquisa e trabalho pessoal efetuada por mim e orientada pelo meu orientador e coorientador. O seu conteúdo é original e todas as fontes consultadas estão devidamente citadas no texto e mencionadas na bibliografia final. Declaro ainda que este trabalho não foi apresentado em nenhuma outra instituição para a obtenção de qualquer grau académico.
Vila Real, outubro de 2018 Tiago Moreira da Silva
iv
“Sei que o melhor de mim está por chegar” Mariza
v
Acknowledgements
Agradeço a minha família… a minha MÃE… e ao meu PAI, um agradecimento é certamente pouco… sei bem todo o empenho que tiveram na minha educação e as dificuldades que tiveram para me proporcionar as melhores condições possíveis. É um agradecimento incondicional e vitalício. Estarei eternamente grato e nunca conseguirei retribuir suficientemente aquilo que eles já fizeram e continuam a fazer por mim. Dedico-lhes esta tese como sinal do meu reconhecimento, carinho e amor que tenho por ambos. O meu MUITO OBRIGADO!
Agradeço a todos os amigos e colegas que foram passando pela a minha vida académica, social e desportiva. Acredito que cada ser singular tem algo para nos ensinar, e o nosso espírito deverá ser sempre de partilha.
Durante o mestrado tenho obrigatoriamente de agradecer a quatro amigos especiais, denomina dos carinhosamente de “Portuguese Delegation”, companheiros de grandes aventuras, viagens, dores de cabeça, de partilha de histórias e ideias, conhecimento e muito mais ao longo destes dois anos, foram um alicerce neste projeto que decidi ingressar em 2016, o Mestrado Internacional em Análise e Performance no Desporto, são eles Joana Silva, José Barbosa e José Gomes, OBRIGADO PELA PACIÊNCIA! OBRIGADO AMIGOS!
Quero agradecer a todo o corpo docente do IMPAS com quem tive oportunidade de aprender, crescer e tornar-me um melhor profissional!
Agradeço ao meu orientador da Tese de Mestrado e coordenador do IMPAS, professor Doutor Nuno Leite pelo acompanhamento e orientação da minha Tese, e por no fundo ser um dos principa is impulsionadores do programa.
In Lithuania I must say thank you very much to professor Danguole! She helped me a lot with novel technologies that I never thought to explore. Besides this, she was also my co-supervisor in this master thesis and she was always willing to speak with me. Ačiū Professor! Ačiū Lietuva! Na Lituânia tive oportunidade ainda de conhecer pessoas incríveis, as quais merecem ser aqui também mencionadas. Além do estágio, tão, mas tão rico que me proporcionaram valeram-se desde o seu início pela sua hospitalidade. O treinador e professor Mariano Barreto, os treinadores João
vi Luís Martins, Sérgio Louro e Luís Guilherme, e, ainda o fisioterapeuta Artur Pereira onde realizei o meu estádio integrado no mestrado.
Lastly but no less important, I want to say thank you to all of my dear classmates of this cohort program! We were few, but we were good!
I should also say thank you to all of those that I was in touch throughout this master, across different countries and cultures! To all of ERAMUS students that have the courage to leave their suitable zones!
O meu humilde e sincero OBRIGADO A TODOS VÓS!
Tiago Moreira da Silva Dezembro de 2018
vii
Resumo
Contextualização: O conhecimento atual do rendimento humano está ainda longe de perceber
como parâmetros físicos como as acelerações, desacelerações e saltos podem influenciar o rendimento de um jogador e em particular a funcionalidade muscular. Objetivos: O objetivo deste estudo foi analisar as relações entre as cargas internas e externas nas propriedades mecânicas e neuromusculares dos músculos isquiotibiais em jogadores de futebol. Em paralelo, esta investigação pretendeu caracterizar, por tipo de sessão de treino e em diferentes posições no campo, perfis específicos deste tipo de componentes físicas. Métodos: A amostra utilizada foi composta por jogadores de futebol (n=11) de um clube Lituano que compete na principal divisão do país, A Lyga. Os jogadores foram testados usando o aparelho Biodex System 3 no laboratório da LSU. Os mesmos jogadores foram reavaliados quatro semanas após a avaliação inicial enquanto que entre ambos os testes, a carga aplicada foi monitorizada diariamente com unidades GPS OptimEye S5 da Catapult Sports - Australia (carga externa) e com a PSE (carga interna) sendo mais tarde correlacionadas com os testes laboratoriais. Resultados: Os eventos de acelerações de baixa e moderada intensidade foram estatisticamente correlacionados de forma negativa (p =0.005; r =-0.773 e p =0.011; r=-0728, respetivamente) com o aumento da tensão involuntária dos músculos isquiotibiais. Nos jogos oficiais verificaram-se valores significativamente mais elevados em parâmetros físicos como a carga individual do jogador, PSE e desacelerações. Relativamente as sessões de cariz físico, equipararam-se nas acelerações, pois nenhum resultado estatisticamente relevante foi obtido, enquanto que no total dos saltos existiu a probabilidade de o número de eventos ocorrer com mais frequência que em jogos. Os resultados obtidos em função da posição em campo, nomeadamente os defesas em comparação com os médios apresentaram um maior número de eventos em acelerações e saltos de baixa intensidade. Entre médios e avançados, foi identificada uma diminuição na perceção subjetiva de esforço e no número de eventos de aceleração de baixa e moderada intensidade. Os saltos baixos e médios ocorrem com mais frequência em avançados. Conclusão: Este estudo confirma que diferentes componentes físicas deverão ser consideradas nas diferentes sessões de treino. Ajudando a prescrever estímulos de treino semelhantes ao jogo tendo em conta a posição em campo e a preocupação pelo estado muscular, enriquecendo assim o rendimento individual e coletivo.
viii
Palavras-Chaves: Rendimento; Monitorização; Avaliação Muscular; GPS; PSE; Tipo de Sessões
de Treino; Posições Específicas;
Abstract
Purpose: Current human performance knowledge is still far from understand how physical
workloads such as acceleration, decelerations and jumps can influence performance and in particularly muscle functionality. Aims: The aim of this study was to examine the relations hips between internal and external workload in the neuromuscular and mechanical properties of hamstring muscles in football players. In parallel, this study aimed to profile markers of these sort of loads for training formats and players’ positions. Methods: Sample used included football players (n=11) from one club which competes in A Lyga (Lithuania 1st division). The players were
evaluated Using Biodex System 3 under laboratories condition at LSU. The retest of this protocol was done after four weeks while in between these assessments, the workload of the same players was monitored daily with GPS units from OptimEye S5, Catapult Sports - Australia (external load) and with RPE (internal load) having been later correlated with the laboratory tests. Results: Low and moderate accelerations events were negative correlated (p =0.005; r =-0.773 and p =0.011; r=-0.728, respectively) with increase of hamstring muscle stiffness. In official matches were identif ie d statiscally greater values than the remaining training sessions in physical parameters as player load, RPE and decelerations. Regarding physical sessions were similar in acceleration because no differences were found, while total jumps had a greater probability to occur more often in comparison with matches. Concerning the results obtained by players’ positions, namely defenders in comparison with midfielders presented a greater number of events in terms of low accelerations and jumps. Between midfielders and forwards, it was identified a decrease on RPE as well as low and moderate accelerations. Low and moderate jumps occurred often in forwards. Conclusion: This study confirmed that different physical loads must be considered to different formats. Helping to prescribe and replicate similar stimulus to the matches by player positions and should be aware about the muscle functionality with an aim to enrich the team and the individual performance.
Key Words: Performance; Monitoring; Muscular Assessment; GPS; RPE; Training Session Type;
ix Table of Contents Declaração ... iii Acknowledgements ... v Resumo ... vii Abstract ... viii Table of Contents ... ix List of Tables ... xi List of Figures ... xi
List of Symbols or Abbreviations ... xiii
Introduction ... 1
Research aims ... 4
Methods ... 5
Sample ... 5
Procedures... 6
Passive Hamstring Stretch Protocol... 7
Isokinetic unilateral protocol ... 8
Period and Data Collected ... 9
GPS analysis ... 9
Research Overview ... 11
Statistical and Data Analysis ... 12
x (i) Examine the relationships between loads in the neuromuscular properties of quadriceps and hamstring muscles in football players (Passive Stiffness, Ratio Hamstring/Quadriceps’s and
RFD of both muscles). ... 14
(ii) Quantify the physical loads inside a professional football team - comparison of different training formats assessed in official matches as well as daily practice during the in-season period. ... 20
Magnitude Based Inferences Between Training Session Formats ... 22
(iii) Describe the physical demands of professional players by position using GPS parameters as well as the Ratio of Perceived Exertion. ... 23
Magnitude Based Inferences Between Player Positions ... 24
Discussion ... 25
Conclusion ... 31
Further Research... 32
xi
List of Tables
Table 1. Hamstring Stress Relaxation Protocol (Mean ± SD), P - value, Difference in means (90
% Confidence Intervals), Effect Size of Cohen's d and Magnitude Base Inferences - Uncertainty in true differences (% chances) ... 14
Table 2. Isokinetic Unilateral Extensio/Flexion 60 DEG/SEC (Mean ± SD, P - value, Difference
in means (90 % Confidence Intervals), Effect Size of Cohen's d and Magnitude Base Inferences - Uncertainty in true differences (% chances). ... 16
Table 3. Isokinetic Unilateral Extension/Flexion 180 DEC/SEC. Mean ± SD, P - value, Difference
in means (90 % Confidence Intervals), Effect Size of Cohen's d and Magnitude Base Inferences - Uncertainty in true differences (% chances). ... 17
Table 4. Correlation between difference in passive stiffness and total loads ... 18 Table 5. Internal and external load (Mean ± SD) during different session type in comparison to
matches. ... 21
Table 6. Characteristics of internal and external load (Mean ± SD) at different levels of intensities
for different player positions on the field: defenders, midfielders and forwards. ... 23
List of Figures
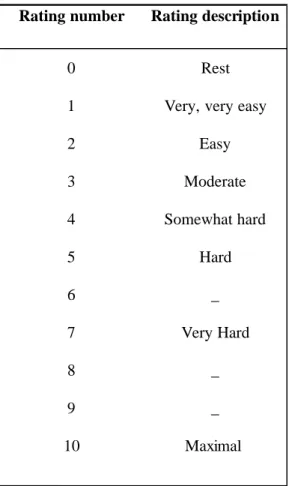
Figure 1. Rating Perceived Exertion Scale - Foster, Florhaug, Franklin, Gottschall, Hrovatin,
Parker and Dodge, 2001)………..4
Figure 2. Techno-tactical assignment to positional roles (Di Salvo et. al 2007)
……….……….5
Figure 3. Passive angle-torque curve during passive stiffness assessment……….7 Figure 4 Research Overview ... 11 Figure 5. Pre and Post Isokinetic Unilateral Protocol Outcomes. Percentage variations ( %) are
xii represents group mean changes. The differences in means (%); ±90% CL (confidence limits) are represented by a scale of 25%-75% possibly (*); 75-95%, likely (**); 95-99%, very likely (#) and >99%, most likely (##). ... 15
Figure 6. Represents graphically the fluctuations in terms of Ratio of force Development alongside
the different measurements at 60º doing the comparison at the same period between maximum strength produced by the flexors and extensors. Percentage variations ( %) are expressed as mean ± SD. The differences in means (%); ±90% CL (confidence limits) are represented by a scale of 25%-75% possibly (*); 75-95%, likely (**); 95-99%, very likely (#) and >99%, most likely (##). ... 15
Figure 7. Represents graphically the fluctuations in terms of Ratio of force Development alongside
the different measurements at 180º doing the comparison at the same period between maximum strength produced by the flexors and extensors. Percentage variations ( %) are expressed as mean ± SD. The differences in means (%); ±90% CL (confidence limits) are represented by a scale of 25%-75% possibly (*); 75-95%, likely (**); 95-99%, very likely (#) and >99%, most likely (##) ... 18
Figure 8. Correlation between differences obtained from the pre to the pos test and low
accelerations………...19
Figure 9. Correlation between differences obtained from the pre to the pos test and moderate
accelerations………...19
Figure 10. Player Load and RPE (Mean total loads ± SD) measured alongside 4 weeks, including
training diaries and matches.. ... 20
Figure 11. Accelerations (Acc), Decelerations (DC) and Jumps (mean total Events SD) measured
alongside 4 weeks, including training diaries and matches. ... 21
Figure 12. Standerdized (Cohen's d) differences between matches and the remaining training
sessions formats (recovery, tactical and physical).. ... 22
Figure 13. Standerdized (Cohen's d) differences between player position (defender, midfielders
xiii
List of Symbols or Abbreviations
ACC - Accelerations AU – Arbitrary Units CL – Confidence Limits DEC – Decelerations DEG – Degrees EMG - Electromyography ES – Effect Size Ev - Events
IMA - Inertial Movement Analysis IMU – Inertial Measurement Unit H/Q . Hamstring and Quadriceps Ratio GPS – Global Positioning System
LSU – Lithuania Sports University Nm – Newton metro
MBI – Magnitude Base Inferences Ms - Milliseconds
RFD – Ratio Force Development ROM – Range of Motion
r – pearson correlation
RPE – Ratio of Perceived Exertion PSE – Percepção Subjetiva de Esforço SEC - Seconds
1
Introduction
Football is typically characterized as a high-intensity, intermittent, contact team sport that requires a number of proficient physical and physiological capabilities to perform successfully (Turner & Stewart, 2014). These capabilities are crucial to achieve a meaningful performance, and therefore optimal loads must be considered when the coaching staff designs the annual plan. Hootman, Dick, and Agel (2007) stated that team sports require athletes to rapidly accelerate, decelerate and change direction, often under significant time constraints, in response to an opposing player or to gain the possession of the ball.
Apart from the necessary technical and tactical skills required, football players must also develop as well as retain a high level of aerobic and anaerobic conditioning, speed, agility, strength, and power (Turner & Stewart, 2014).
Bompa and Buzzichelli (2015), stated that excessive amounts of training can lead to an overload of the system’s capacity and increased risk of injury and illness. Otherwise, insufficient training may restrain the performance benefits. The activities performed by the athlete lead to an external and internal load stress on the various physiological subsystems and also cause mechanical stresses on the various musculosketal tissues. (Vanrenterghem, Nedergaard, Robinson & Drust, 2017). Following the necessity to assess the players’ workflow week by week, the explosion of technology has been a powerful tool to sports scientists, coaches and physiotherapists in the last decades. Novel technologies offer ample opportunities to continuously monitor the activities of a player, in terms of biomechanical stresses and musculoskeletal tissues adaptations as well as internal and external load monitoring. Vanrenterghemand and colleagues (2017) proposed a new theoretical framework in which physiological and biomechanical loads-adaptations pathways were considered separately. Considering all these areas of sports disciplines, different tools of evaluation started to be used together and the knowledge of a multidisciplinary team is needed to operationalize them.
Therefore, in this master thesis, Biodex System 3 isokinetic dynamometer was used (Drouin, Valovich mcLeod, Shultz, Gansneder & Perrin 2004). Also GPS units from OptimEye S5 (Catapult Sports, Australia) and the Rating Perceived Exertion (Borg 1982) methods to collect data. The content, methods and protocols will be explained ahead in this study.
2 Passive Stiffness is the rate of rise, or slope, of the applied torque during passive stretch is used to define stiffness, in this thesis associated to the hamstring muscles (Palmer, Jenkins & Cramer, 2013). Resistance torque or passive torque can be seen as the force produced involuntary according with maximum range of motion at which the subject folds discomfort but not pain (Cabido, Bergamini, Andrade, Lima, Menzel, & Chagas, 2014). Mechanical stiffness is important when considering the role of the tendon on the mechanical contraction. Although, other researchers described that passive muscle tension is increased after damaging eccentric exercise and no research has examined changes in hamstring passive muscle tension throughout a simulated sport activity (Marshall, Lovell & Siegler, 2016).
Moreover, it could be very important to know how specific physical demands as accelerations and decelerations that induce concentric and eccentric efforts (respectively) can increase passive stiffness. Exploration of passive-tension changes during matches and daily practice may provide understanding of mechanical changes in the function of the hamstring musculature. An increase in the slope, may indicate symptoms of eccentric muscle damage and thus an increased likelihood of strain injury. This has been observed after eccentric exercise has been attributed to damaged fibers contracting during stretching, knee angular velocities during sprinting have been estimated as high as 600°/s to 700°/s, thus necessitating rapid eccentric hamstring torque output to decelerate knee extension during the terminal swing phase (Kuitunen, Komi, & Kyröläinen, 2002; Chumanov, Heiderscheit & Thelen 2007).
Therefore, it’s also very useful to assess the functional ratio between agonist and antagonis t muscles. The ratio hamstrings and quadriceps is a calculation in which the strength (peak torque) of the hamstring muscles in eccentric/concentric motion is divided by the strength of the quadriceps in an eccentric/concentric motion (Askling, Karlsson & Thorstensson, 2003). Strength imbalances between knee flexor and extensors have been related with high probability of getting an injury. Knapik, Baumann, Jone, Harris and Vaughan (1991) suggested that players with a strength imbalance of greater than 15% were 2.6 times more likely to suffer injury. The causes of these imbalances are not known but could be due to the nature of the game in which players repeatedly kick the ball with a preferred leg. Pinto and Arruda (2001) described that isokinetic evaluations in athletes are crucial and there really is an ideal hamstrings: quadriceps (H:Q) ratio between the knee flexor and extensor musculature. Nevertheless, quadriceps are capable to produce a force three times greater than the hamstrings.
3 Furthermore, the rate of force development (RFD) was also considered, it is a measure of explos ive strength, or simply how fast an athlete can develop force – hence the ‘rate’ of ‘force development’. This is defined as the speed at which the contractile elements of the muscle can develop force (Aagaard, Simonsen, Andersen, Magnusson & Dyhre-Poulsen, 2002). It has been used to evaluate the capacity to rapidly generate force, which may be essential for sports performance (Aagaard et al., 2011). Therefore, improving an athlete’s RFD may make them more explosive as they can develop larger forces in a shorter period. Additionally, insights can be had by knowing that improvements in RFD are likely to be the result of increases in muscle-tendon stiffness (Kubo, Kanehisa, Ito & Fukunaga, 2001).
Analyses of physical demands in football have been crucial over the last years to highlight and better prepare the players to perform during competitive periods. Therefore, having a deeper knowledge about some moments during trainings sessions may allow coaches to develop the athletes in terms of physical profile and team load management.
The team load management have been one of the major concern for the coaches in the last decades. Furthermore, novel technologies, as GPS has been one of the most used ways to assess physica l demands in team sports. This technology is used to measure distance travelled and speed, however, alone may not accurately measure short duration movements (Luteberget, Holme & Spencer 2017). Recently, inertial measurements analysis (IMA) concept has been included in the GPS units. IMA uses an accelerometer and gyroscope information to create non-gravity vector. The creation of tri-axial accelerations parameters that disregard gravity, provide a platform to develop algorithms to detect sport specific micro-movements. This means data obtained measures actual athlete movement to give a greater insight into training and game demands and does not require GPS (Sprint help documents, Catapult Sprint software 5.1.7 - Team Sports: Soccer, Melbour ne , Australia).
4 Regarding the internal load method, the RPE was used
to collect the data. This tool is a cheaper but also a reliable way for measuring the internal workload. Therefore, physical activity intensity level is based on the physical sensations a person experiences during physical activity, including increased heart rate, increased breathing rate, increased sweating, and muscle fatigue. Despite its subjective character, a person's exertion rating may provide a fairly good estimate of the actual heart rate during physical activity using the Borg Rating of Perceived Exertion Scale (Borg, 1982). The load associated with the game and training load of the session is expressed in arbitrary units (Borresen & Lambert, 2009). Overall the rating perceived by the athletes can give an insight to the coaches about the training intensity throughout the weeks, between session types as well as specific positions on the pitch.
Research aims
Thus, the overall aim was to establish the typical load of elite Lithuania 1st division football players within game and training sessions. A current limitation in literature there is no universa l method to quantify training load within individual or team sports, or across varying modes of exercise. In this sense, to best of our knowledge this approach has never been done.
The specific aims outcomes were (i) examine the relationships between internal and external workload in the neuromuscular properties of hamstring muscles in football players (Passive Stiffness, Ratio Hamstring/Quadriceps’s and RFD of both muscles), (ii) Quantify the physical loads inside a professional football team - comparison of different training formats assessed in official matches as well as daily practice during the in- season period, and lastly (iii) Describe the physical demands of professional players by their position using GPS parameters as well as the Ratio of Perceived Exertion.
Figure 1. .Rating Perceived Exertion Scale
(Foster et al., 2001) _ Very Hard _ _ Maximal 7 8 9 10 Rest Very, very easy
Easy Moderate Somewhat hard Hard 1 2 3 4 5 6
Rating number Rating description
5
Methods Sample
Data was collected from elite football players (n=11) from one club which competes in A Lyga (Lithuania 1st division) during the in-season period which means with official champions hip matches. Their mean age, height, body mass and body fat were 23.8 ± 1.7 years, 181 ± 0.1 cm, 76.1 ± 6.5kg and 9.0 ±3.2% respectively. Throughout the study these eleven players were monitored with GPS units from OptimEye S5 (Catapult Sports, Australia). Inclusion criteria were being selected according to the degree of importance. First of all, were chosen players that did not have any injuries in the previous season. Moreover, preference was given to the head coach to have the right to choose among players. The coach preference was according with the predictability of each player's playing time. Finally,
was considered the player position to have homogeneous group (2 central-backs; 2 full-central-backs; 4 midfielders; 2 wingers and 1 forward). The player positions were grouped by defenders, midfielders and forwards as done in other research (Di Salvo et.al 2007). Corroborating with same authors, defenders were composed by the central defenders and external defenders, midfielders were composed by the central
midfielders while forwards were composed by the external midfielders and forwards.
Figure 2. Techno-tactical assignment to positional roles (Di Salvo
6 Participants received written and oral explanations of all procedures, regarding the risks that may be involved and clearly explained that they had the right to refuse or give up from the study without any loss. In the laboratory environment all measurements and tests were supervised and handle d by highly qualified professional’s technicians/researchers with considerable years of experience at Lithuania Sports University – Institute of Sport Science and Innovations. It provided written consent before the study protocol began according to the recommendations of the Declaration of Helsinki (World Medical Association, 2013) and was followed the guidelines stated by the local Institutional Research Committee.
Procedures
The study began in the laboratory of the LSU - Institute of Sport Science and Innovations, where the players were evaluated Using Biodex System 3 isokinetic dynamometer (Drouin, Valovich-mcLeod, Shultz, Gansneder & Perrin 2004). Subjects performed three different types of protocols , namely, hamstring passive stiffness, isokinetic unilateral strength and isokinetic eccentric hamstring strength. The purpose of the research data collected was to calculate passive stiffness, ratio of strength between hamstring/quadriceps and ratio of force development only for the dominant limb.
All tests in the laboratory were performed at the same time (middle of the morning) to avoid the effects of circadian rhythm. The procedure began with a 10-min warm-up on a Monark cycle ergometer with moderate pace following 5 min of dynamic stretching such as walking lunges, squats, and heel-toe-walks concentrated on lower limbs (Rahnama & Bambaecichi, 2005). After the installation on the dynamometer, the subjects familiarized themselves with the movements by performing each movement prior to start the real data collection. Additionally, and even before the warm-up each player was prepared with specific electrodes just for the dominant limb namely in the bicep femoris (hamstring), rectos femoris (quadriceps) and two others placed on the knee joint by a member of the research team who was not known to the players.
7
Passive Hamstring Stretch Protocol
In the hamstring passive stiffness, the players were seated on a Biodex System 3 isokinetic dynamometer (Biodex Medical Systems, Inc., Shipley, NY, USA) chair apparatus with no shoes and the hip flexion approximately 120° and the shank at 50° below the horizontal.
The pelvis and both thighs were stabilised with velcro straps. The axis of rotation was fixed at the knee joint and the lever arm pad was attached proximal to the malleolus. In this position, the dynamometer passively extended the knee at 5°/s to the end of maximum discomfort without feeling any pain. Passive stiffness is calculated using the slope of the last third part of the TRxROM, due the results was considered 90% of the ROMmax (figure 3) reached during the pre-test of that session. To this end, the TRxROM curve is divided into 3 parts, and the slope of the third part of this curve is used in the analysis. Measurements is only accepted if the knee flexor muscle activity was less than 5% of EMG max (Whatman, Knappstein, & Hume, 2006) which is determined during maximum isometric strength test by a mean peak of a root mean squared (RMS). Three passive maximum knee extension ROM, peak torque, and stiffness measures have to be averaged for further analysis.
8
Isokinetic unilateral protocol
The isokinetic quadriceps and hamstring torque were measured at 60°/s and 180°/s of knee flexion and extension. The players performed maximal strength at each knee flexion/extension angle with 60 seconds of pause in between. Encouragement through verbal coaching and visual feedback was given to all subjects during the tests.
Data collected was mainly highlighted for these parameters:
1. Peak torque, represented by the muscle strength capabilities;
2. Average Power, represents how quickly a muscle can produce force to move the limb at the beginning of the range of motion;
3. Acceleration/Deceleration, time to go from zero speed to the beginning of isokinetic movement and time to go from Isokinetic speed to zero speed, respectively it is an indicative of a muscle's neuromuscular capability to eccentrically control the limb at the end of the range of motion.
4. Agonist/Antagonist Ratio, the reciprocal muscle group ratio. Excessive imbalances may predispose a joint to injury;
According to the values exported through Biodex it was calculated the ratio between hamstrings and quadriceps as well as the ratio of force development from both group of muscles. As did by several authors (Croisier, Ganteaume, Binet, Genty, & Ferret, 2008) the ratio between hamstring and quadriceps were made by dividing the absolute peak torque (Nm) achieved and comparison led to the determination of asymmetries expressed in percentage form multiplying by 100 (%). On the other hand, the ratio of force development (RFD) were calculated from the peak torque, the maximum capability to produce force divided by time (s) that the subject took to achieve his high strength - RFD [N·s-1] = Change in Force [N] / Change in Time [s] (Maffiuletti, Aagaard, Blazevich, Folland, Tillin, and Duchateau, 2016)
Each subject performs three repetitions for 60º and 180º velocities where it was always considered for all calculations the maximum torque that the subjects were able to perform during the measurements.
9
Period and Data Collected
The retest of the protocol aforementioned was done after 4 weeks where the same players measured in the laboratory were monitored daily with GPS (external load) and asked about their sensations (RPE). After this period were examined a possible relationship between the loads collected and the neuromuscular properties of quadriceps and hamstring muscles.
Regarding the physical demands were considered to describe training sessions type, as recovery, technical and tactical, physical and official matches alongside this period. The training sessions type were indicated and registered by experts who have an extensive experience in the training process.
Furthermore, since the group of players were distributed homogeneous the physical demands required for each player positions according to their specificities (defenders, midfielders and forwards) were also evaluated.
In total 39 files were registered for daily trainings and matches (4 recovery training sessions, 19 technical tactical, 9 physical and 7 matches although 3 were unofficial). Breaking down by positions (mean and standard deviation), defenders participated in 18±2.9 trainings, midfielders 19±2 and forwards 21 ±1 daily training sessions. Considering all matches, defenders, midfielders and forwards were selected in average for 4.5 ± 1.0, 4.3±0.5 and 5±1 respectively.
GPS analysis
Regarding the workload, players were monitored daily in terms of external load, each player was fitted with an IMU (OptimEye S5, Catapult Sports, Australia) containing an accelerometer, gyroscope, and magnetometer, all collecting data at 100 Hz. The unit was located between the shoulder blades in a custom-made vest (Catapult Sports, Australia) worn under the player’s match jersey. To ensure a minimal effect on match performance. The data collection was monitored in real time using Catapult Sprint (version 5.1.4, Catapult Sports, 2014) and exported to be analysed. In this research, only the indoor mode was used, therefore the activities that were part of the study were player load, jumps, as well as acceleration and decelerations.
Briefly, Player Load is an accelerometer-based measurement of external physical loading of team-sport athletes. Player Load is defined as an instantaneous rate of change of acceleration divided by
10 a scaling factor and is expressed as the square root of the sum of the squared instantaneous rate of change in acceleration in each of the 3 vectors (x, y, and z axes) divided by 100 (Boyd, Ball & Aughey, 2011). Jumps events were counted and splited by period base on intensity rating of low (0-20 cm), moderate (20-40 cm) and high (40+cm).
Accelerations and decelerations events were defined as total, low, moderate and high acceleration (Total ACC, >1ms ̄²; Low ACC, 1–2ms ̄²; Moderate ACC,2–3ms ̄²; High ACC, >3ms ̄²) and deceleration (Total DEC, <−1ms ̄²; Low DEC, −1 to −2ms ̄²; Moderate DEC, −2 to −3ms ̄²; High DEC, <−3ms ̄²) during training and competitive games. The current classifications were chosen as appropriate arbitrary demarcations during match play based on previous data (unpublishe d). Although maximal accelerations may be as high as 6ms ̄². (Akenhead, Hayes, Thompson & French, 2013).
RPE analysis
Players completed an individual training diary where it was subjectively recorded their mean intensity using the Rating Perceived Exertion (RPE) using the Borg 1–10 scale (Borg, 1982). All players were familiar with the RPE scale and had previous experience rating the perceived exertion of training drills and small-sided games. This formed the session RPE score [RPE x session time (min)], which was used to calculate a subjective estimate of session load (Foster et al., 2001).
11
Research Overview
This study used an observational research design. Data regarding different parameters were collect between February and March, over a period of 4 weeks during 2018 in elite Lithuania divis ion with football players.
Sample
11 elite Lithuania division football players
Sample
11 elite Lithuania division football players
Sample
11 elite Lithuania division football players
Sample
11 elite Lithuania division football players
Sample
11 elite Lithuania division football players
Sample
11 elite Lithuania division football players
Sample
11 elite Lithuania division football players
Sample
11 elite Lithuania division football players In accordance with Declaration
of Helsinki
In accordance with Declaration of Helsinki
In accordance with Declaration of Helsinki
In accordance with Declaration of Helsinki
In accordance with Declaration of Helsinki
In accordance with Declaration of Helsinki
In accordance with Declaration of Helsinki
(i) Examine the relationships between loads in the neuromuscular properties of hamstring muscles in football players (Passive Stiffness, Ratio Hamstring/Quadriceps’s and RFD of both muscles).
Examine the relationships between loads in the neuromuscular properties of quadriceps and hamstring muscles in football players (Passive Stiffness, Ratio Hamstring/Quadriceps’s and RFD of both muscles).
(i) Examine the relationships between loads in the neuromuscular properties of hamstring muscles in football players (Passive Stiffness, Ratio Hamstring/Quadriceps’s and RFD of both muscles).
(ii) Quantify the physical loads inside a professional football team - comparison of different training formats assessed in official matches as well as daily practice during the in- season period.
Quantified the physical loads of elite football players considering a typical in-season being assess in official matches as well as daily practice.
(ii) Quantify the physical loads inside a professional football team - comparison of different training formats assessed in official matches as well as daily practice
(iii) Describe the physical demands of professional players by their position using GPS parameters as well as the Ratio of Perceived Exertion.
Describe the physical demands of professional players by position on the field during training and competition using GPS parameters as well as the Ratio of Perceived Exertion.
(iii) Describe the physical demands of professional players by their position on the field during training and competition using GPS parameters as well as the Ratio of Perceived Exertion.
Describe the physical demands of professional players by position on the
Research Aims Additional Aims Aim Additional Aims Aim Additional Aims Aim Additional Aims
12
Statistical and Data Analysis
In the first step the data was analysed using IBM SPSS Statistics version 22, descriptive analysis was performed using mean ± SD. Significance test was used to investigate differences, and statistical significance was accepted at p<0.05 level. All players agreed to participate in the study and there were no drop outs during the study period. The Shapiro-Wilk was considered to test normality; the test rejects the hypothesis of normality when the p-value is less than or equal to 0.05. These guidelines were assumed for all aims.
Following these procedures, to assess the mean significant difference between pre and post-test regarding different parameters as passive stiffness, ROM, passive torque, ratio H/Q, ratio of force development and peak during isokinetic tests was run a parametric Paired T test whenever the data was normal distributed and the Wilcoxon - non parametric test .The relationship between loads and muscles properties was used the Pearson or Spearman tests, whenever the data was normally distributed or not normal distributed, respectively (aim one). Consider the effect size, and in particularly just for this statistical test was assumed the following correlation coefficient thresholds interpreted as, <0.1, trivial; 0.11-0.3, small; 0.31-0.5, moderate; 0.51-0.7, large; 0.71-0.9 very large and 0.91-1.00 almost perfect
Furthermore, to compare the means between training sessions types as well as position regarding the physical loads were run a statistical multiple comparison using one-way independent measure Anova to explore this difference. Bonferroni homogeneous subsets were used to describe post-hoc results. Man-Whitney U non- parametric test was performed singularly whenever the data was not normally distributed (aim two and three).
Magnitude-based inferences (MBI) approach was employed aiming to avoid the shortcomings of research approaches supported by the null-hypothesis significance testing (Batterham & Hopkins , 2006). MBI was used to assess the chances of true differences (i.e., greater than the smallest worthwhile change). The smallest worthwhile change was calculated as 0.20 times between subjects SD. Quantitative chances of real differences in variables were assessed qualitatively as <1%, almost certainly not; <5%, very unlikely; <25% unlike ly, probably not; 25% to 75%, possibly, possibly not; >75%, likely, probably; >95% very likely; >99.5%, almost certainly (Hopkins, 2006). If the chances of a variable having higher and lower differences were >5%, the true effect was deemed to be unclear. Otherwise, was interpreted that change as the observed
13 chance. Thresholds for effect size (ES) statistics were interpreted as <0.2, trivial; 0.2 to 0.6, small; 0.6 to 1.2, moderate; 1.2 to 2.0, large; >2.0, very large (Hopkins, Marshall, Batterham & Hannin, 2009). Differences in means were also expressed in percentage units with 90% confident intervals. Statistical analyses were computed on customized spreadsheet to compare means between two groups (Hopkins, 2007) and analysis of post-only crossover trial (Hopkins, 2006).
14
Results
In the next chapter will be describe all the results obtained through the data collected on the laboratory as well as on the field. As mentioned previously this research was spread by different aims that will be presented below.
(i) Examine the relationships between loads in the neuromuscular properties of quadriceps and hamstring muscles in football players (Passive Stiffness, Ratio Hamstring/Quadriceps’s and RFD of both muscles).
Individual differences and mean changes between pre-and post-tests are reported in table 1 regarding different laboratory measurements with information including p-value statistica l difference, standardized differences, effect sizes and practical inferences.
Table 1. Hamstring Stress Relaxation Protocol (Mean ± SD), P - value, Difference in means (90 % Confidence
Intervals), Effect Size of Cohen's d and Magnitude Base Inferences - Uncertainty in true differences (% chances)
Passive stiffness increased in the post test for the hamstring muscle while ROM and peak torque were equal.
Passive Hamstring Stretching
Pre Pos p-value Difference in means
(%; ± 90%CL)
Effect Size MBI
Passive Stiffness 1.63 ± 0.41 1.90 ± 0.36 0.002 22.28 ± 15.58 0.74
(moderate)
(97/3/0) very likely +ive
ROM 92.20 ± 7.39 92.50 ± 5.10 0.841 1.50 ± 4.53 0.17 (trivial)
(46/43/11) unclear; get more
data
Passive Torque 61.21 ± 14.72 61.16 ± 12.99 0.986 3.87 ± 12.06 0.14 (trivial)
(40/52/9) unclear; get more
data
15 Furthermore, figure 5 shows the individual differences and mean changes in the strength imbalances between flexors and extensors.
None statistical differences were found between pre and post-tests for isokinetic quadriceps and hamstring torques measured at 60° and 180° of knee flexion and extension. Difference in means % (%; ± 90%CL) = 7.14 ± 9.38, ES = 0.41 (small), MBI = likely positive (76/21/3) were obtaine d at 60º while to 180 º were registered % (%; ± 90%CL) = -0.23 ± 12.3, ES = 0,02 (trivial), MBI = unclear get more data (35/28/37).
** ** ** ** ** ** ** **
Figure 5. Pre and Post Isokinetic Unilateral Protocol Outcomes. Percentage variations ( %) are expressed as mean ± SD. Linear lines represents the individual changes while dashed black lines represents group mean changes. The differences in means (%); ±90% CL (confidence limits) are represented by a scale of 25%-75% possibly (*); 75-95%, likely (**); 95-99%, very likely (#) and >99%, most likely (##).
16
Figure 6. Represents graphically the fluctuations in terms of Ratio of force Development alongside the different
measurements at 60º doing the comparison at the same period between maximum strength produced by the flexors and extensors. Percentage variations ( %) are expressed as mean ± SD. The differences in means (%); ±90% CL (confidence limits) are represented by a scale of 25%-75% possibly (*); 75-95%, likely (**); 95-99%, very likely (#) and >99%, most likely (##).
Table 2. Isokinetic Unilateral Extensio/Flexion 60 DEG/SEC (Mean ± SD, P - value, Difference in means (90 %
Confidence Intervals), Effect Size of Cohen's d and Magnitude Base Inferences - Uncertainty in true differences (% chances).
Moreover, table 2 shows the results obtained at 60º/SEC in the same protocol that was calculated the RFD as well as exported the meaningful values achieved as the peak torque (strenght produced) by the quadriciptes and hamstrings.
Isokinetic Unilateral Extension/Flexion 60 DEG/SEC
Pre Pos p-value
Mean Difference (90
% of CI)
Effect Size MBI
Extension - Quadriciptes
RFD Extension 390.68 ± 99.96 416.16 ±
101.16
0.388 4.28 ± 18.66 0.14 (trivial) (43/40/16) unclear; get more data
Peak Torque 249.50 ± 47.18 234.29 ± 44.95
0.053 -10.90 ± 6.19 0.89 (moderate)
(0/4/96) very likely +ive
Flexion - Hamstrings
RFD Flexion 523 ± 126.43 508.22 ±
138.83
0.770 2.37 ± 25.59 0.09 (trivial) (41/30/29) unclear; get more data
Peak Torque 136.19 ± 19.86 131,60 ± 19.89
0.143 -1.73 ± 5.98 0.11 (trivial) (9/57/35) unclear, get more data
Significance between pre and post at p < 0.05
* * * * * * * * * # # * # # * # # * #
17 In figure 6 shows that statistical significant (p=0.006) were found between pre-tests regarding the ratio force development, difference in means % (%; ± 90%CL) = 13.43 ± 20.58, ES = 0.43 (small), MBI = possibly positive (97/3/0). None differences were found in pos tests (p=0.063), difference in means % (%; ± 90%CL) = 11.63 ± 28.00, ES = 0,37 (small), MBI = unclear get more data (64/24/13).
Table 3. Isokinetic Unilateral Extension/Flexion 180 DEC/SEC. Mean ± SD, P - value, Difference in means (90 % Confidence Intervals), Effect Size of Cohen's d and Magnitude Base Inferences - Uncertainty in true differences (% chances).
In the same line table 3 shows the results obtained at 180º for the same outcomes, RFD, Peak torque and anatomical position.
Isokinetic Unilateral Extension/Flexion 180 DEG/SEC
Pre Pos p-value
Mean Difference (95
% of CI)
Effect Size MBI
Extension – Quadriciptes RFD Extension 698.49 ± 115.14 786,45 ± 223,50 0.286 19.35 ± 34.67 1.02 (moderate) (81/9/10) unclear get; more data
Peak Torque 187.03 ± 26.47 194.70 ± 49. 34
0.520 6.00 ± 14.82 0.37 (small) (63/23/13) unclear get; more data
Flexion – Hamstrings
RFD Flexion 1043 ± 234.69 1021.57 ±
183.74
0.691 6.40 ± 15.41 0.25 (small) (57/34/10) unclear get; more data
Peak Torque 125.06 ± 16.76 121.59 ± 17.18
0.458 1.47 ± 10.46 0.10 (trivial) (40/27/33) unclear get; more data
18
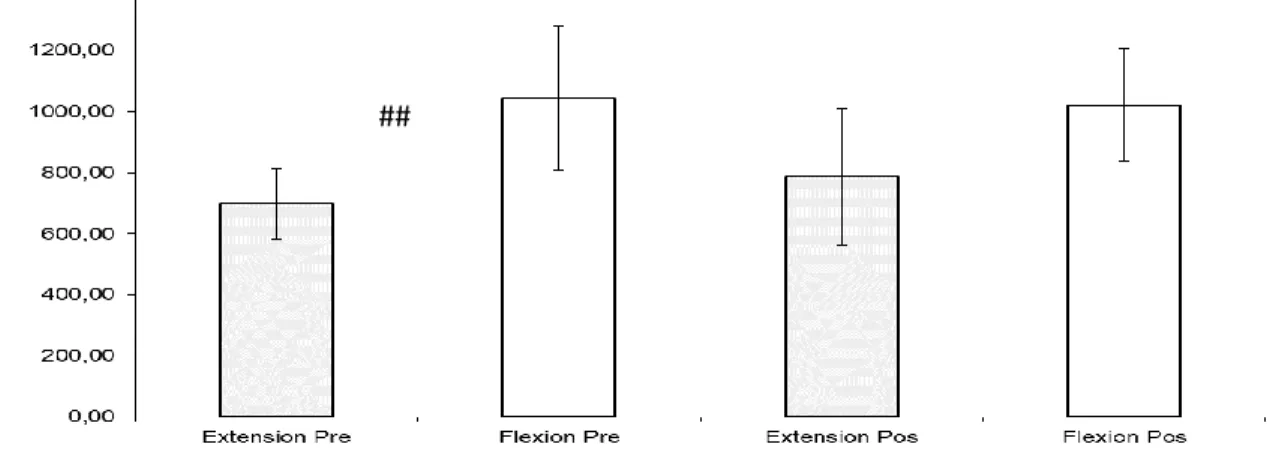
Figure 7. Represents graphically the fluctuations in terms of Ratio of force Development alongside the different
measurements at 180º doing the comparison at the same period between maximum strength produced by the flexors and extensors. Percentage variations ( %) are expressed as mean ± SD. The differences in means (%); ±90% CL (confidence limits) are represented by a scale of 25%-75% possibly (*); 75-95%, likely (**); 95-99%, very likely (#) and >99%, most likely (##)
In figure 7, statistical significant (p=0.003) were found between pre-tests regarding the ratio force development, difference in means % (%; ± 90%CL) = 32.20 ± 10.31, ES = 1.62 (large), MBI = most likely positive (100/0/0). Moreover, in the pos tests (p=0.007), difference in means % (%; ± 90%CL) = 18.03 ± 15.10, ES = 0.96 (moderate), MBI = unclear get more data (86/8/6).
Table 4. Correlation between difference in passive stiffness and total loads
Statistical significant at p < 0.05; r= pearson correlation coefficient Effect Size (Interpretation), 0.1 trivial; 0.11-0.3 small; 0.31-0.5 moderate; 0.51-0.7 large; 0-71-0.9 very large, 0.91-1.00 almost perfect.
Table 4 represents the correlationship between the workloads effects on the hamstring passive stiffness.
Physical Outcomes Correlation
Player Load p= 0,160 ; r= -0,454 (moderate)
Acc Low p=0,005; r= -0,773 (very large) **
Acc Moderate p=0,011; r=-0,728 (very large) **
Acc High p=0,236; r=-0,390 (moderate)
Dc Low p=0,201; r= -0,418 (moderate)
Dc Moderate p=0,196; r= -0,422 (moderate)
Dc High p= 0,122; r= -0,494 (moderate)
Low Jumps p=0,272; r= -0,364 (moderate)
Moderate Jumps p= 0,192; r= -0,426 (moderate)
High Jumps p=0,051; r= - 0,600 (large)
## ## ## ## ## ## ## ##
19
Figure 11. Correlation between differences obtained from the pre to the pos test and low accelerations.
Figure 9. Correlation between differences obtained from the pre to the pos test and moderate accelerations. Figure 8. Correlation between differences obtained from the pre to the pos test and low accelerations.
Figure 8 and 9 present the negative correlationship between the differences of pre and post passive stiffness with low and moderate accelerations events, respectively.
p=0.005; r = -0.773 -0,30 -0,20 -0,10 0,00 0,10 0,20 0,30 0,40 0,50 0,60 0,70 400,00 500,00 600,00 700,00 800,00 900,00 1000,00 1100,00 1200,00 1300,00 1400,00
Total Low Accelerations (events)
Correlations Passive Stiffness and Low Accelerations
D iffe re n c e s P re & P o st P a ss iv e S ti ffn e ss (N m .d e g ) -0,30 -0,20 -0,10 0,00 0,10 0,20 0,30 0,40 0,50 0,60 0,70 200,00 250,00 300,00 350,00 400,00 450,00 500,00 550,00 600,00 D if fe re n c es P re & P o st P as si ve S ti ff n e ss ( N m .d e g )
Total Moderate Accelerations (events)
Correlations Passive Stiffness and Moderate Accelerations
p=0.011; r= -0.728 p=0.005; r= -0.773
20
(ii) Quantify the physical loads inside a professional football team - comparison of different training formats assessed in official matches as well as daily practice during the in-season period.
Figure 10 above presents the mean total loads obtained after 4 weeks consider the Player Load (16289.68 ± 2802.72) and RPE (11878.09 ± 1496,84) in arbitrary units. Those two parameters were major consider for daily monitoring the loads and were statistical significant (p<0.001), difference in means % (%; ± 90%CL) = -21.11 ± 9.94 ES = 0.78 (moderate), MBI = very likely positive (0/1/99).
Figure 10. Player Load and RPE (Mean total loads SD) measured alongside 4 weeks, including training diaries and
21 In figure 11 are reported the total number of events divided by level of intensities, low, moderate and high accelerations and decelerations. Jumps were also reported in terms of intensity but considering the height, low, moderate and high. The relative values (%) of these outcomes were 64.09 25.33 % low accelerations, 22.1522.54 % moderate accelerations and 13.7627.12 % high accelerations. Consider decelerations obtained, low 64.8727.12 %, moderate 23.2129.23 % and high 11.9233.24 %. Lastly, low jumps 44.16 61.71 %, moderate 40.93 41.94 % and high 14.91 49.19 %.
AU – Arbitrary Units; Ev - Number of Events . Statistical significant at p < 0.05.a Significantly different compared with the Matches. b Significantly different compared with Technical &
Tactical. c Significantly different compared with the Physical. d Significantly different compared with Recovery.
The table 5 displays the statistical differences in terms of physical outcomes, namely player load, RPE, total acceleration, total decelerations and jumps for each of the training ses
Table 5. Internal and external load (Mean ± SD) during different session type in comparison to matches.
Physical Outcomes Matches (a) Technical & Tactical (b)
Physical (c) Recovery (d)
Player Load (AU) 887.86 ± 163.179
604.16 ± 71.35 ac 750.06 ± 97.09 a 390.51 c 135,70 abc
RPE Load(AU) 824.02 ± 154.89 363.13 ± 64.44 ac 620.38 ± 85.32 a 189.84 ± 88.72 abc
Total Accelarations (Ev) 79.97 ± 18.35 64.13 ± 10.04 ac 73.02 ± 10.93 11.25 ± 8,83 abc Total Decelarations (Ev) 114.93 ± 23.19 86.64 ± 22.83 a 90.95 ± 27.74 a 10.64 ± 7.61 abc
Total Jumps (Ev) 20.49 ± 20.58 11.92 ± 4.15 c 24.44 ± 7.13 a 8.39 ±12.76 abc
0 200 400 600 800 1000 1200 1400 1600 1800 2000
Acc Low Acc Moderate Acc High Dc Low Dc Moderate Dc High Low JumpsModerate JumpsHigh Jumps
E
ve
n
ts
Figure 11. Accelerations (Acc), Decelerations (DC) and Jumps (mean total Events SD) measured alongside 4 weeks,
including training diaries and matches. .
22 E ac h g ra p h h as t w o t y p e o f tr ai n in g f o rm at s d e sc ri b e d o n t h e t o p a n d b o tt o m . V al u e s ar e h ig h e r w h e n e ve r th e m e an a n d s ta n d ar d d e vi at io n a re n e ar b y o f o n e o f th e se e x tr e m it ie s. T h e d if fe re n c es i n m e an s (% ); ± 9 0 % C L ( c o n fi d e n c e l im it s) a re r e p re se n te d b y a s c al e o f 2 5 % -7 5 % p o ss ib ly ( * ); 7 5 -9 5 % , l ik e ly ( * * ); 9 5 -9 9 % , v e ry l ik e ly ( # ) an d > 9 9 % , m o st li k e ly ( # # ). T h re sh o ld s fo r e ff e ct s iz e ( E S ) st at is ti c s w e re i n te rp re te d a s < 0 .2 , t ri vi al ; 0 .2 t o 0 .6 , s m al l; 0 .6 t o 1 .2 , m o d e ra te ; 1 .2 t o 2 .0 , l ar g e ; > 2 .0 , v e ry l ar g e. F ig u r e 12 . S ta n d e rd iz e d ( C o h e n 's d ) d if fe re n c e s b e tw e e n m at c h e s an d t h e r e m ai n in g t ra in in g s e ss io n s fo rm at s (r e co ve ry , t ac ti c al a n d p h y si c al ). M agn it ude B as ed Inf er enc es B et w ee n T rai ni ng Se ss ion F or m at s
23
(iii) Describe the physical demands of professional players by position using GPS parameters as well as the Ratio of Perceived Exertion.
AU - Arbitrary Units; Ev - Number of Events; (a) - Defenders; (b) - Midfielders; (c) - Forwards
Statistical significant at p < 0.05. a Significantly different compared with the Defenders. b Significantly different compared with Midfielders. c
Significantly different compared with the Forwards
.
The table 6 displays the statistical differences in terms of physical outcomes, namely, player load, RPE, acceleration, decelerations and jumps divided by level of intensities for different player positions on the field (defenders, midfielders and forwards).
Table 6. Characteristics of internal and external load (Mean ± SD) at different levels of intensities for different
player positions on the field: defenders, midfielders and forwards.
Physical Outcomes Players Position
Team Mean Defenders (a) Midfielders (b) Forwards (c)
Player Load (AU) 16289.68 ± 2802.73 15858,94 ± 3548.74 15237.20 ± 2034.34 18267.33 ± 1953.63
RPE Load (AU) 11878.09 ± 1496.84
11112.25 ± 495.28 11741.25 ± 2134.72
13081.67 ± 640.75
Acc Low (Ev) 1027.41 ± 261.40 1139.92 ± 171.98 773.72 ± 156.55 a 1215.67 ± 188.56 Acc Moderate (Ev) 355.12 ± 89.94 366.19 ± 91.28 291.89 ± 64.76 424.67 ± 64.10
Acc High (Ev) 220.65 ± 49.73 212.18 ± 51.83 199.36 ± 49.88 260.33 ± 28.19 DC Low (Ev) 1394.21 ± 378.15 1420.35 ± 231.14 1222.22 ± 357.73 1588.67 ± 465.94 DC Moderate (Ev) 498.81 ± 145.78 489.75 ± 83.81 430.47 ± 166.35 602.00 ± 138.44
DC High (Ev) 256.08 ± 85.11 262.26 ±70.22 208.95 ± 78.03 310.67 ± 84.47 Low Jumps (Ev) 158.22 ± 97.64 195.46 ± 144.40 99.14 ± 35.40 187.33 ± 48.13 Moderate Jumps (Ev) 146.66 ± 61.51 158.96 ±37.45 83.36 ±17.42 a 214.67 ± 27.15 High Jumps (Ev) 53.44 ± 26.28 58.17 ± 26.73 40.28 ±27.55 64.67 ± 21.04
24 F ig u r e 13 . S ta n d e rd iz e d ( C o h e n 's d ) d if fe re n c e s b e tw e e n p la y e r p o si ti o n ( d e fe n d e r, m id fi el d e rs a n d f o rw ar d s) E ac h g ra p h h as t w o t y p e o f tr ai n in g f o rm at s d e sc ri b e d o n t h e t o p a n d b o tt o m . V al u e s ar e h ig h e r w h e n e ve r th e m e an a n d s ta n d ar d d e vi at io n a re n e ar b y o f o n e o f th e se e x tr e m it ie s. T h e d if fe re n c es i n m e an s (% ); ± 9 0 % C L ( c o n fi d e n c e l im it s) a re r e p re se n te d b y a s c al e o f 2 5 % -7 5 % p o ss ib ly ( * ); 7 5 -9 5 % , l ik e ly ( * * ); 9 5 -9 9 % , v e ry l ik e ly ( # ) an d > 9 9 % , m o st li k e ly ( # # ). T h re sh o ld s fo r e ff e ct s iz e ( E S ) st at is ti c s w e re i n te rp re te d a s < 0 .2 , t ri vi al ; 0 .2 t o 0 .6 , s m al l; 0 .6 t o 1 .2 , m o d e ra te ; 1 .2 t o 2 .0 , l ar g e ; > 2 .0 , v e ry l ar g e. M agn it ude B as ed Inf er enc es B et w ee n P lay er P os it ions
25
Discussion
The main aim of this master thesis was to examine the relationships between internal and external workload in the neuromuscular and mechanical properties of hamstring muscles in football players. First it will be discussed the loads that were monitored daily during four weeks. This previous knowledge could highlight why the neuromuscular strength as well as mechanical properties of the muscles might have changed.
Starting to look for the total player load (external load) and RPE (internal load) significant differences outcomes were found. In fact, player load was moderate very likely higher than RPE. These findings are not in line with most of the studies that report RPE as being considered a good indicator of global internal and external loads of training (Impellizzeri, Rampinini, Coutts, Sassi & Marcora, 2004; Kelly, Strudwick, Atkinson, Drust & Gregson, 2016). RPE training load against other forms of internal load (such as heart rate and blood lactate), external load measures as global positioning systems (GPS) and accelerometers have been highly correlated (Scott, Black, Quinn & Coutts, 2013).
As the acceleration, deceleration and jumps are currently not fully understood in football players, additionally this study aimed to profile markers of these sort of loads throughout four weeks, including training sessions and matches. Beyond that it was described the same loads by position on the pitch.
Overall looking just for the raw data over the four weeks, low accelerations and decelerations had higher amount of loads than in comparison with moderate and high intensities. In detail, the total results showed that more events while decelerating (total decelerations = 2149.09) than accelerating (total accelerations = 1603.18), and this can highlight the importance of teaching the player how to decelerate. To best of our knowledge any previous studies followed these workloads continuously during training and matches without interruptions. Nevertheless, other studies did the comparison over several official matches. Dalen, Jorgen, Gertjan, Havard, and Ulrik (2016), found that accelerations contributed to 7-10% of the total player load for all player positions, whereas decelerations contributed to 5-7%. Therefore, quantification of the acceleration and deceleration demands may provide a further information into the characteristics of football that could inform
26 Sports Scientists and Strength and Conditioning coaches when seeking to improve training specificity and minimize the effects of fatigue (Russell et al., 2016). Another research with a similar approach was found that time-dependent reductions in distances covered suggest that acceleration and deceleration capability are acutely compromised during match play (Akenhead, Hayes, Thompson & French, 2013). The same authors found that 18% of total distance covered have been whilst accelerating or decelerating at the current data highlights the importance of both eccentric and concentric conditioning to football performance.
Moreover, the same workloads were investigated by sessions, namely player load, RPE, total accelerations and decelerations showed that matches had significant higher loads in comparison with other training session formats. Therefore, matches presented higher number of events for the loads significantly greater. moderate to large differences, likely to most likely probability to be greater. Similar studies regarding the player load monitoring and RPE shows that this sor t of physical performance is more elicited during competition. Henderson, Cook, Kidgell & Gastin (2015) found that typically higher physical loads are involved in the match environment, for both external (GPS) and internal (Session-RPE) load parameters, compared to the in-season training environment, in this research seen as other training formats. On the other hand, it’s important to state that jumps happened not so often, but they are crucial and part of physical demands of a football player. In elite football players coaching and fitness staff generally view the game as the most physically demanding session of the weekly cycle (Rogalski, Dawson, Heasman & Gabbett, 2013) as obtained in this study.
Physical sessions were the unique format that might present similar physical demands in some parameters that are applied during match environment. Acceleration did not present any statistical difference, trivial and unclear data results were found in comparison with matches. Since, sprinting ability is an integral component of successful performance in a variety of sports and the ability to accelerate in soccer underlies successful game play (Turner et al., 2011) these results might allow coaches to develop and consider these specific loads under similar conditions that occur during matches with physical training session.
On the other hand, jumps were statistically different (p=0.001) and moderate likel y higher in physical session than in official matches. These results suggest that physical formats elicited more strength, power and reactive strength then matches.
27 Lastly, recovery sessions had the lower number of events in terms of accelerations (11.25 ± 8.83), decelerations (10.64 ± 7.61) and jumps (8.39 ±12.76), these results were also significantly lower with the remaining sessions. Typically, training sessions early in the week are lower in intensity as players recover from the game, and training sessions later in the week are lower in volume as the players prepare for the game (Henderson, Cook, Kidgell & Gastin, 2015).
Furthermore, physical parameters obtained different outcomes for specific player positions. It was made the comparison between defenders, midfielders and forwards involved in this research. To best of our knowledge few studies have used acceleration, decelerations and jumps as base of comparison between player positions. However, it has been argued that the workload can be underestimated, especially at lower speeds, since it does not account for additional energy spent when accelerating or decelerating (Akenhead, et al 2013).
Some differences were found between defenders and midfielders. Low accelerations presented statistical greater number of events in defenders (p < 0.029), and the differences obtained are very likely to increase. In longitudinal research where it was monitored throughout four seasons and made the same comparison, acceleration did not get any statistical difference among the players positions (Wisbey, Montgomery, Pyne, & Rattray, 2010).
These findings suggest that defenders might need to have quicker actions in small distances. While midfielders are normally occupying zones that need a rapid decision to reach a successful performance. Di Salvo and colleagues (2007) found that this player position covered long distances during matches. Interestingly, midfielders had lower values in all physical parameters in comparison with the average of the team, this may suggest that midfielder’s actions where not only in less amount but also at low intensities. In moderate jumps were also found statistical differences (p<0.024), large and very likely results. These could inform coaches that central back or full back need to develop this capability within this jump intensity.
Curiously, no statistical difference was found between defenders and forwards. Although, jumps were moderate and 75-95% likely to be greater for forwards players. Outdoor physical parameters could help have better idea in the comparison of these two player positions and this can be seen as a limitation of this study.