CERN-PH-EP/2012-124 2013/01/28
CMS-BPH-11-007
Measurement of the
Λ
bcross section and the
Λ
bto
Λ
bratio
with J/ψ
Λ decays in pp collisions at
√
s
=
7 TeV
The CMS Collaboration
∗Abstract
TheΛbdifferential production cross section and the cross-section ratio σ(Λb)/σ(Λb)
are measured as functions of transverse momentum pΛb
T and rapidity|yΛb|in pp
colli-sions at√s=7 TeV using data collected by the CMS experiment at the LHC. The
mea-surements are based onΛbdecays reconstructed in the exclusive final state J/ψΛ, with
the subsequent decays J/ψ→µ+µ−andΛ→pπ, using a data sample corresponding
to an integrated luminosity of 1.9 fb−1. The product σ(Λb) × B(Λb → J/ψΛ)versus pΛb
T falls faster than that of b mesons. The measured value of σ(Λb) × B(Λb→J/ψΛ)
for pΛb
T > 10 GeV and |yΛb| < 2.0 is 1.16±0.06±0.12 nb, and the integrated σ(Λb)/σ(Λb) ratio is 1.02±0.07±0.09, where the uncertainties are statistical and
systematic, respectively.
Submitted to Physics Letters B
∗See Appendix A for the list of collaboration members
1
Introduction
Cross sections for b-quark production in high-energy hadronic collisions have been measured at pp colliders at center-of-mass energies from 630 GeV [1] to 1.96 TeV [2–4], in fixed-target p-nucleus collisions with beam energies from 800 to 920 GeV [5], and recently in pp collisions at 7 TeV at the Large Hadron Collider (LHC) [6–13]. As the expected cross sections can be calculated in perturbative quantum chromodynamics (QCD), the comparison between data and predictions provides a critical test of next-to-leading-order (NLO) calculations [14, 15]. Considerable progress has been achieved in understanding heavy-quark production at Teva-tron energies, largely resolving earlier discrepancies in which theoretical predictions were sig-nificantly below observed production rates [15]. However, substantial theoretical uncertain-ties on production cross sections remain due to the dependence on the renormalization and factorization scales. Measurements of b-hadron production at 7 TeV represent a test of the-oretical approaches that aim to describe heavy-flavor production at the new center-of-mass energy [16, 17]. Furthermore, understanding the production rates for b hadrons represents an essential component in accurately estimating heavy-quark backgrounds for various searches,
such as H0→bb and supersymmetric or exotic new physics signatures with b quarks.
This Letter presents the first measurement of the production cross section of a b baryon, Λb,
from fully reconstructed J/ψΛ decays in pp collisions at√s =7 TeV and complements the
mea-surements of B+[6], B0[7], and B0s[9] production cross sections also performed by the Compact Muon Solenoid (CMS) experiment at the LHC [18]. The comparison of baryon production rela-tive to meson production resulting from the same initial b-quark momentum spectrum allows for tests of differences in the hadronization process. Such differences are particularly interest-ing in the context of heavy-baryon production in relativistic heavy-ion collisions, where the medium could significantly enhance the production of heavy baryons relative to mesons [19– 21]. Furthermore, the pp initial state at the LHC allows tests of baryon transport models, which predict rapidity-dependent antibaryon/baryon asymmetries, in contrast to baryon-antibaryon pair production, which typically results in equal yields [22, 23]. Measurements of theΛbtoΛb
cross-section ratio, σ(Λb)/σ(Λb), as functions of pΛb
T and|yΛb|allow for the first test of such
models with heavy-quark baryons at√s =7 TeV.
Events withΛb baryons reconstructed from their decays to the final state J/ψΛ, with J/ψ →
µ+µ− andΛ → pπ, are used to measure the differential cross sections dσ/dpΛTb× B(Λb →
J/ψΛ), dσ/dyΛb× B(Λ
b→J/ψΛ), and σ(Λb)/σ(Λb)with respect to the transverse momentum
pΛb
T and the rapidity |yΛb|, as well as the integrated cross section times branching fraction for
pΛb
T >10 GeV and|yΛb| < 2.0. The cross section times branching fraction is reported instead of
the cross section itself because of the 54% uncertainty onB(Λb→J/ψΛ)[24]. The cross section times branching fraction measurements are averaged over particle and antiparticle states, while the ratio is computed by distinguishing the two states via decays to p or p, respectively.
2
Detector
The data sample used in this analysis was collected by the CMS experiment in 2011 and
cor-responds to an integrated luminosity of 1.86±0.04 fb−1 [25]. A detailed description of the
detector may be found elsewhere [18]. The main detector components used in this analysis are the silicon tracker and the muon detection systems.
The silicon tracker measures charged particles within the pseudorapidity range |η| < 2.5,
counterclock-wise beam direction. It consists of 1440 silicon pixel and 15 148 silicon strip detector modules and is located in the 3.8 T field of the superconducting solenoid. It provides an impact param-eter resolution of about 15 µm and a pT resolution of about 1.5% for particles with transverse
momenta up to 100 GeV. Muons are measured in the pseudorapidity range|η| < 2.4, with
de-tection planes made using three technologies: drift tubes, cathode strip chambers, and resistive plate chambers. Events are recorded with a two-level trigger system. The first level is com-posed of custom hardware processors and uses information from the calorimeters and muon systems to select the most interesting events. The high-level trigger processor farm further decreases the event rate from about 100 kHz to around 350 Hz before data storage.
3
Event selection
Early data taking conditions in 2011 utilized a loose dimuon trigger with the following require-ments. Events are selected requiring two oppositely charged muons with dimuon transverse momentum greater than 6.9 GeV. Displaced muon pairs from long-lived b-hadron decays are preferentially selected by further requiring a transverse separation from the mean pp collision position (”beamspot”) greater than three times its uncertainty, where the uncertainty incorpo-rates the vertex and beamspot measurements. Also required at the trigger level are a dimuon vertex fit confidence level larger than 0.5% and cos α > 0.9, where α is defined as the angle in the plane transverse to the beams between the dimuon momentum and the vector from
the beamspot to the dimuon vertex. The dimuon invariant mass mµ+µ− is required to satisfy
2.9<mµ+µ− <3.3 GeV. For the later 46% of the dataset, the trigger was tightened by increasing
the dimuon vertex fit confidence level threshold to 10% and imposing kinematic requirements of pµT > 3.5 GeV and|ηµ| <2.2 for each of the muons. The remaining 2011 data were recorded
with even tighter triggers and are not used in the analysis.
Muon candidates are fully reconstructed by combining information from the silicon tracker [26] and muon detectors, and are required to be within the kinematic acceptance region of pTµ >
3.5 GeV and |ηµ| < 2.2. Muon candidates are further required to have a track χ2 per degree
of freedom<1.8, at least 11 silicon tracker hits, at least two hits in the pixel system, and to be matched to at least one track segment in the muon system. Multiple muon candidates are not allowed to share the same muon track segments [27].
Opposite-sign muon pairs are fit to a common vertex to form J/ψ candidates, which are required to be within 150 MeV of the world-average J/ψ mass [24]. The J/ψ candidates are also required to have pT greater than 7 GeV, a dimuon vertex fit confidence level larger than 0.5%, cos α >
0.95, and a transverse separation of the vertex from the beamspot greater than three times its uncertainty.
The Λ candidates are formed by fitting oppositely charged tracks to a common vertex. Each
track is required to have at least 6 hits in the silicon tracker, a χ2 per degree of freedom <5, and a transverse impact parameter with respect to the beamspot greater than 0.5 times its un-certainty. The proton candidate, identified as the higher-momentum track, is required to have pT > 1.0 GeV. Misassignment of the correct proton track is found to be negligible from
sim-ulation. The reconstructed Λ decay vertex must have a χ2 per degree of freedom <7 and a
transverse separation from the beamspot at least five times larger than its uncertainty. The
in-variant mass mpπ is required to be within 8 MeV of the world-averageΛ mass [24]. Candidates
are rejected if mπ+π− is within 20 MeV of the world-average K0S mass [24].
The Λb candidates are formed by combining a J/ψ candidate with a Λ candidate. A
masses of the J/ψ and Λ candidates constrained to their world-average values [24]. The Λb
vertex fit confidence level is required to be greater than 1% and the reconstructed Λb mass
must satisfy 5.2 < mJ/ψΛ < 6.0 GeV. Multiple Λbcandidates are found in less than 1% of the events with at least one candidate passing all selection criteria. In those cases, only the can-didate with the highest Λbvertex fit confidence level is retained. The mJ/ψΛ distributions for
selectedΛbandΛbcandidates are shown in Fig. 1.
(GeV) Λ Ψ J/ m 5.3 5.4 5.5 5.6 5.7 5.8 5.9 Events / ( 0.02 GeV ) 0 100 200 300 400 500 CMS = 7 TeV s -1 L = 1.9 fb only b Λ (GeV) Λ Ψ J/ m 5.3 5.4 5.5 5.6 5.7 5.8 5.9 Events / ( 0.02 GeV ) 0 50 100 150 200 250 300 350 400 450 CMS = 7 TeV s -1 L = 1.9 fb only b Λ
Figure 1: Fit results for the mJ/ψΛdistribution forΛb(left) andΛb(right) for pΛTb >10 GeV and
|yΛb| < 2.0, where the dashed line shows the background fit function, the solid line shows the sum of signal and background, and the points indicate the data.
4
Efficiency determination
The efficiency for triggering on and reconstructingΛb baryons is computed with a
combina-tion of techniques using the data and large samples of fully simulated Monte Carlo (MC)
sig-nal events generated with PYTHIA 6.422 [28], decayed byEVTGEN [29], and simulated using
GEANT4 [30]. The efficiency is factorized according to
e= A ·eµtrig1 ·etrigµ2 ·erecoµ1 ·eµreco2 ·eµµtrig·eΛselb, (1)
where each term is described below. The trigger (eµi
trig) and muon-reconstruction efficiencies
(eµi
reco) are obtained from a large sample of inclusive J/ψ → µ+µ−decays in data using a
”tag-and-probe” technique similar to that described in Ref. [31], where one muon is identified with stringent quality requirements and the second muon is identified using information either ex-clusively from the tracker (to measure the trigger and offline muon-identification efficiencies) or from the muon system (to measure the trigger and offline tracking efficiencies). While, in
principle, the inclusive J/ψ → µ+µ− sample can include signal events, which could bias the
measurement, in practice the fraction is negligibly small and provides an unbiased measure-ment of the muon efficiencies.
For the portion of the trigger efficiency that depends on single-muon requirements (eµi
trig), the
efficiency for a given Λb event is computed as the product of the two single-muon
other are up to 30% lower than for events where the muons bend away from each other for certain portions of the detector. This inefficiency arises when the muon trajectories cross in the muon system, and one of the candidates is rejected because of shared hits. To account for this effect, the trigger efficiencies for muons that bend toward and away from each other are com-puted separately in data and the appropriate efficiency is applied to each class of signal events. This procedure naturally accounts for the correlations between the two single-muon efficien-cies, as confirmed in simulation. The portions of the trigger efficiency that depend on dimuon quantities (eµµtrig) are measured from an inclusive J/ψ sample collected with triggers where only single-muon requirements are applied.
The probabilities for the muons to lie within the dimuon kinematic acceptance region (A) and
for the Λb and Λb candidates to pass the selection requirements (eΛselb) are determined from
the simulated events. To minimize the effect of the PYTHIA modeling of the pΛb
T and |yΛb|
distributions on the acceptance and efficiency calculations, the simulated events are reweighted to match the kinematic distributions observed in the data. The simulated events used for the efficiency calculations have also been reweighted to match the measured distribution of the number of pp interactions per event (pileup). On average, there are six pileup interactions in the data sample used in this analysis. The efficiencies for hadron track reconstruction [32],Λb reconstruction [33], and fulfilling the vertex quality requirements are found to be consistent between data and simulation.
The total efficiency of this selection, defined as the fraction ofΛb → J/ψΛ with J/ψ → µ+µ−
andΛ→pπ decays produced with pΛb
T >10 GeV and|yΛb| <2.0 that pass all criteria, is 0.73%.
The efficiency ranges from 0.3% for pΛb
T 10–13 GeV to 4.0% for p
Λb
T > 28 GeV, with the largest
losses due to theΛ reconstruction (10–16% efficiency), the dimuon kinematic acceptance (12–
63%), and the displaced dimuon trigger requirements (33–56%). The efficiencies in bins of pΛb
T
and|yΛb|are shown in Table 1.
To measure the ratio of antiparticle to particle cross sections σ(Λb)/σ(Λb), only the ratio of theΛbandΛbdetection efficiencies is needed. Many of the efficiency contributions cancel in
the ratio, including all the J/ψ and µ efficiencies since the particle and antiparticle states are indistinguishable. However, theΛ and Λ reconstruction efficiencies differ because of different interaction cross sections with the detector material; the p are more likely to suffer a nuclear interaction and be lost, resulting in an efficiency that is on average 13% lower forΛbthan for
Λb, as shown in Table 2. The ratio of the Λb andΛb selection efficiencies is calculated from
simulation as described above for the combined sample, where the simulation modeling of the detector interactions is validated by comparing the number of hits reconstructed on tracks with that observed in data. The uncertainty on the amount of detector material and the appropri-ateness of simulated interaction cross sections are considered as systematic uncertainties, as described in Section 7.
5
Fitting procedure
The backgrounds are dominated by nonprompt J/ψ production from b hadrons. The dimuon invariant-mass distribution in data confirms that the contamination from events containing a misidentified J/ψ is negligible after all selection criteria have been applied. Background events are distinguished from signal by their reconstructed mJ/ψΛdistribution, which is found to be in
good agreement between data away from the signal peak and simulated b→J/ψX events. The
Λb proper decay length distribution in data confirms that the background events arise from
and background. The measured mpπ distribution shows a purity of 77% genuineΛ events after
applying the full selection criteria, while the mπ+π− distribution confirms that more than 99.9%
of the K0Sbackground is rejected by the kaon mass-window veto.
The Λb yields are extracted from unbinned extended maximum-likelihood fits to the mJ/ψΛ
distribution in bins of pΛb
T and |yΛb| defined in Table 1. In each bin, the signal is described
by a double-Gaussian function with resolution parameters fixed to values found when fitting simulated signal events and means set to a common value left free in the fit. The background shape is modeled with a third-order polynomial, whose parameters are left free to float inde-pendently in each bin. The ratio of antiparticle to particle yields is obtained by simultaneously fitting theΛb andΛbmass distributions, with resolution parameters fixed from the fit to the
combinedΛbandΛbsimulated sample and common mean allowed to float. The background
shapes are fit with separate third-order polynomials, whose parameters are left free in the fit. The signal mass resolution varies as a function of |yΛb|, ranging from a mean of 11 MeV for centralΛbto 27 MeV for forwardΛbevents.
6
Results
The fitted signal yields in each bin of pΛb
T and|yΛb|are summarized in Table 1. Figure 1 shows
the fits to the mJ/ψΛdistributions forΛbandΛbcandidates in the inclusive sample with pΛTb >
10 GeV and |yΛb| < 2.0. The total number of signal events extracted from an inclusive fit is 1252±42, where the uncertainty is statistical only.
TheΛbdifferential cross section times branching fraction is calculated in bins of pΛb
T as dσ(pp→ΛbX) dpΛb T × B(Λb→J/ψΛ) = nsig 2·e· B · L ·∆pTΛb , (2)
and similarly for |yΛb|, where n
sig is the fitted number of signal events in the given bin, e
is the average efficiency for signal Λb and Λb baryons to pass all the selection criteria, L is
the integrated luminosity, ∆pΛb
T is the bin size, and B is the product of branching fractions
B(J/ψ → µ+µ−) = (5.93±0.06) ×10−2andB(Λ→ pπ) =0.639±0.005 [24]. The additional
factor of two in the denominator accounts for our choice of quoting the cross section for Λb
production only, while nsigincludes bothΛbandΛb. The efficiencies are calculated separately
for each bin, always considering only baryons produced with |yΛb| < 2.0 for pΛb
T bins and
pΛb
T > 10 GeV for|yΛb|bins, and taking into account bin-to-bin migrations (0–2%) because of
the finite resolution on the measured pΛb
T and|yΛb|. Equal production ofΛbandΛbis assumed
for the efficiency, as predicted byPYTHIAand as is consistent with our measurement.
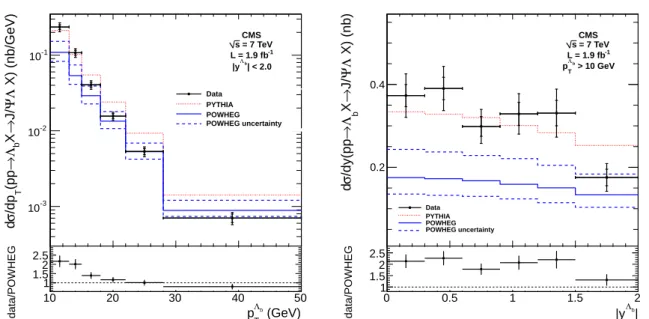
The measured differential cross sections times branching fraction versus pΛb
T and |yΛb| are
shown in Fig. 2 and Table 1. They are compared to predictions from the NLO MC generator
POWHEG 1.0 with the hvq package [34, 35] using a b-quark mass mb = 4.75 GeV,
renormaliza-tion and factorizarenormaliza-tion scales µ =
q
m2b+p2T, CTEQ6M parton distribution functions [36], and
PYTHIA 6.422 [28] for the parton hadronization. The uncertainty on the predicted cross
sec-tion is calculated by varying the renormalizasec-tion and factorizasec-tion scales by factors of two and, independently, mbby±0.25 GeV. The largest variation in each direction is taken as the
uncer-tainty. The data are also compared to the PYTHIA 6.422 prediction, using a b-quark mass of
4.80 GeV, CTEQ6L1 parton distribution functions, and the Z2 tune [37] to simulate the
Table 1: Λb+ Λbsignal yield nsig, efficiency e, and measured differential cross sections times
branching fraction dσ/dpΛb
T × B(Λb → J/ψΛ)and dσ/dyΛb× B(Λb → J/ψΛ), compared to
thePOWHEG [34, 35] and PYTHIA [28] predictions. The uncertainties on the signal yields are statistical only, while those on the efficiencies are systematic. The uncertainties in the measured cross sections are statistical and systematic, respectively, excluding the common luminosity
(2.2%) and branching fraction (1.3%) uncertainties. ThePOWHEGandPYTHIApredictions also
have uncertainties of 54% due toB(Λb→J/ψΛ), which are not shown.
pΛb
T nsig e dσ/dpΛTb× B(Λb →J/ψΛ) POWHEG PYTHIA
(GeV) events (%) (pb/GeV) (pb/GeV) (pb/GeV)
10−13 293±22 0.29±0.03 240±20±30 110+−4030 210 13−15 240±18 0.79±0.08 108±8±12 54+−2112 102 15−18 265±19 1.54±0.16 41±3±4 29+−106 55 18−22 207±16 2.34±0.23 15.6±1.2±1.6 13.4+−4.52.7 24.0 22−28 145±14 3.21±0.34 5.3±0.5±0.6 5.3+−1.61.1 9.3 28−50 87±11 3.96±0.50 0.70±0.09±0.09 0.89+−0.320.15 1.42 |yΛb| n sig e dσ/dyΛb× B(Λ b→J/ψΛ) POWHEG PYTHIA events (%) (pb) (pb) (pb) 0.0−0.3 233±17 0.74±0.09 370±30±50 180+−7040 330 0.3−0.6 256±18 0.77±0.09 390±30±50 170+−6040 330 0.6−0.9 206±16 0.81±0.09 300±20±30 170+−6040 320 0.9−1.2 196±17 0.70±0.08 330±30±40 160+−6040 300 1.2−1.5 189±17 0.67±0.09 330±30±50 150+−5040 280 1.5−2.0 162±18 0.65±0.09 180±20±30 130+−5030 250
The measured pT spectrum falls faster than predicted byPOWHEG andPYTHIA, while the |y|
spectrum shape is in agreement with the predictions within uncertainties, as illustrated in the
data-to-POWHEG ratio plots shown in the lower panels of Fig. 2. The integrated cross section
σ(pp → ΛbX) × B(Λb → J/ψΛ) for pΛTb > 10 GeV and |yΛb| < 2.0, calculated as the sum
over all pT bins, is 1.16±0.06±0.12 nb, where the first uncertainty is statistical, and the
sec-ond is systematic. For the total cross section result, the highest pΛb
T bin is fit without an upper
bound and has a yield of 97.0±13.2 events. The total cross section measurement is in good
agreement with the prediction from PYTHIA of 1.19±0.64 nb and higher than the prediction
from POWHEG of 0.63+−0.410.37nb, where the uncertainties are dominated by the 54% uncertainty
onB(Λb→J/ψΛ)[24].
This result can be compared to previous CMS measurements of B+[6], B0 [7], and B0s [9] pro-duction at√s = 7 TeV. To facilitate the comparison, the B+ and B0 results are taken for the
range pBT > 10 GeV. Simulated events are generated with MC@NLO [38] with mb = 4.75 GeV
and CTEQ6M parton distribution functions to determine the fraction of B+, B0, and B0s events within the pBT and |yB| ranges used for their respective measurements with the pT > 10 GeV
and|y| < 2.0 requirements used in this analysis. Scaling by the appropriate ratio and using the world-average values ofB(Λb →J/ψΛ) = (5.7±3.1) ×10−4andB(B0
s → J/ψφ) = (1.4±
0.5) ×10−3 [24], we determine the following cross sections for pBT > 10 GeV and |yB| < 2.0: σ(pp → B+X) = 6.7±1.0 µb; σ(pp → B0X) = 6.7±0.8 µb; σ(pp → B0sX) = 2.5±1.0 µb
(GeV) b Λ T p 10 20 30 40 50 X) (nb/GeV) Λ Ψ J/ → Xb Λ → (pp T /dp σ d -3 10 -2 10 -1 10 CMS = 7 TeV s -1 L = 1.9 fb | < 2.0 b Λ |y Data PYTHIA POWHEG POWHEG uncertainty (GeV) b Λ T p 10 20 30 40 50 data/POWHEG 1 1.52 2.5 | b Λ |y 0 0.5 1 1.5 2 X) (nb) Λ Ψ J/ → X b Λ → /dy(pp σ d 0.2 0.4 CMS = 7 TeV s -1 L = 1.9 fb > 10 GeV b Λ T p Data PYTHIA POWHEG POWHEG uncertainty | b Λ |y 0 0.5 1 1.5 2 data/POWHEG 1 1.52 2.5
Figure 2: Upper: Measured differential cross sections times branching fraction dσ/dpΛb
T ×
B(Λb→J/ψΛ)(left) and dσ/dyΛb× B(Λ
b →J/ψΛ)(right) compared to the theoretical
predic-tions fromPYTHIAandPOWHEG. The inner error bars correspond to the statistical uncertainties
and the outer ones represent the uncorrelated systematic uncertainties added in quadrature to
the statistical uncertainties. The dashed lines show the uncertainties on thePOWHEG
predic-tions. Overall uncertainties of 2.2% for the luminosity and 1.3% for the J/ψ → µ+µ− and
Λ → pπ branching fractions for the data are not shown, nor is the 54% uncertainty due to
B(Λb → J/ψΛ)for the PYTHIA andPOWHEG predictions. Lower: The ratio of the measured
values to thePOWHEGpredictions. The error bars include the statistical and uncorrelated
sys-tematic uncertainties on the data and the shape-only uncertainties on thePOWHEGpredictions.
statistical and systematic components. No uncertainty has been included for the phase-space extrapolation based onMC@NLO[38]. The large systematic uncertainties for σ(pp→B0sX)and
σ(pp → ΛbX)are dominated by the poorly known branching fractions B(Λb → J/ψΛ) and
B(B0s →J/ψφ), respectively. The ratios among the four results are in good agreement with the world-average b-quark fragmentation results [24].
The world-average b-quark fragmentation results assume that the fractions are the same for b jets originating from Z decays at LEP and directly from pp collisions at the Tevatron. However,
measurements of fΛbperformed at LEP [39, 40] and at the Tevatron [41] show discrepancies. A
recent result [42] from the LHCb Collaboration measures a strong pTdependence of the ratio of
Λbproduction to B-meson production, fΛb/(fu+ fd), with fΛb ≡ B(b→ Λb)and fq ≡ B(b→ Bq). Larger fΛbvalues are observed at lower pT, which suggests that the discrepancy observed
between the LEP and Tevatron data may be due to the lower pTof theΛbbaryons produced at
the Tevatron.
A comparison of this and previous CMS results for b-hadron production versus pTis shown in
the left plot of Fig. 3, where the data are fit to the Tsallis function [43], 1 N dN dpT =C pT 1+ q p2 T+m2−m nT −n . (3)
Here C is a normalization parameter, T and n are shape parameters, m is the mass of the b hadron and N is the b-hadron yield. The statistical and bin-to-bin systematic uncertainties are
used in the fits. The T parameter represents the inverse slope parameter of an exponential, which dominates at low pT. Since our data do not constrain that region well, T is fixed to the
mean value found from fitting the B+and B0 distributions, where the pT threshold is lowest.
The result of T = 1.10 GeV is used to obtain the following values of the n parameter, which
controls the power-law behavior at high pT: n(B+) = 5.5±0.3, n(B0) = 5.8±0.3, n(B0s) =
6.6±0.4, and n(Λb) =7.6±0.4. The larger n value forΛbindicates a more steeply falling pT
distribution than observed for the mesons, also suggesting that the production ofΛbbaryons,
relative to B mesons, varies as a function of pT, with a larger Λb/B ratio at lower transverse
momentum. The right plot of Fig. 3 shows the pΛb
T spectrum shape compared to B+ and B0,
where the distributions are normalized to the common bin with pT= 10−13 GeV.
(GeV) T b-hadron p 10 20 30 40 50 b/GeV) µ b-hadron X) ( → (pp T /dp σ d -3 10 -2 10 -1 10 1 10 = 7 TeV s CMS + (|yB+| < 2.4) B Tsallis fit + B | < 2.2) 0 B (|y 0 B Tsallis fit 0 B | < 2.4) s 0 B (|y s 0 B Tsallis fit s 0 B | < 2.0) b Λ (|y b Λ Tsallis fit b Λ (GeV) T b-hadron p 10 20 30 40 50 (10-13 GeV)) T /dp σ )/(d T /dp σ (d -2 10 -1 10 1 | < 2.4) + B (|y + B | < 2.2) 0 B (|y 0 B | < 2.0) b Λ (|y b Λ = 7 TeV s CMS
Figure 3: Comparison of production rates for B+[6], B0[7], B0s [9], andΛbversus pT. The left
plot shows the absolute comparison, where the inner error bars correspond to the total bin-to-bin uncertainties, while the outer error bars represent the total bin-to-bin-to-bin-to-bin and normalization uncertainties added in quadrature. Fits to the Tsallis function [43] for each distribution are
also shown.The overall uncertainties for B0s andΛb are dominated by large uncertainties on
B(B0s →J/ψφ)andB(Λb→J/ψΛ), respectively. The right plot shows a shape-only comparison where the data are normalized to the 10−13 GeV bin in pT and the error bars show the
bin-to-bin uncertainties only. B0
sis omitted because the 10−13 GeV bin is not available for the common
normalization.
The ratio σ(Λb)/σ(Λb)is calculated in bins of pΛb
T or|yΛb|as σ(Λb)/σ(Λb) = nΛb sig nΛb sig ×e(Λb) e(Λb) , (4) where nΛb
sigand nΛsigb are the antiparticle and particle yields in a given bin, and e(Λb)and e(Λb)
are the particle and antiparticle efficiencies for a given bin, always considering only baryons produced with|yΛb| <2.0 for pΛb
T bins and pΛTb >10 GeV for|yΛb|bins. The results versus pΛTb
and|yΛb|are shown in Fig. 4 and Table 2. The ratio σ(Λ
b)/σ(Λb)is found to be consistent with
unity and constant as a function of both pΛb
T and|yΛb|, within the uncertainties, as predicted
pseudorapidities is observed within the available statistical precision for the kinematic regime investigated. The integrated σ(Λb)/σ(Λb)for pΛb
T > 10 GeV and|yΛb| < 2.0 is 1.02±0.07±
0.09, where the first uncertainty is statistical and the second is systematic.
(GeV) b Λ T p 10 20 30 40 50 ) b Λ ( σ ) / b Λ ( σ 0 0.5 1 1.5 2 Data PYTHIA POWHEG POWHEG uncertainty = 7 TeV s CMS -1 L = 1.9 fb | < 2.0 b Λ |y | b Λ |y 0 0.5 1 1.5 2 ) b Λ ( σ ) / b Λ ( σ 0 0.5 1 1.5 2 Data PYTHIA POWHEG POWHEG uncertainty = 7 TeV s CMS -1 L = 1.9 fb > 10 GeV b Λ T p
Figure 4: Measured σ(Λb)/σ(Λb)(points) versus pΛb
T (left) and|yΛb|(right), compared to the
theoretical predictions fromPYTHIA(red dashed line) andPOWHEG(blue solid line). The inner
error bars correspond to the statistical uncertainties, and the outer error bars represent the uncorrelated systematic uncertainties added in quadrature to the statistical uncertainties. The
dashed blue lines show the uncertainties of thePOWHEGpredictions.
7
Systematic uncertainties
The cross section is affected by systematic uncertainties on the signal yields and efficiencies that are uncorrelated bin-to-bin and can affect the shapes of the distributions, and by the uncertain-ties on branching fractions and integrated luminosity, which are common to all bins and only affect the overall normalization. The uncertainties on the signal yields arise from the following sources:
• Signal shape uncertainty (1–6%): evaluated from the variations when floating the
means of the two Gaussians (set to a common value) in data or by using a single Gaussian shape.
• Background shape uncertainty (1–2%): evaluated from the variation when using a
second-order polynomial, exponential, or third-order polynomial fit in the restricted range 5.4–6.0 GeV.
• Final-state radiation (0–1%): evaluated by removing it from the simulation and
tak-ing half of the difference in the results.
The uncertainties on the efficiencies arise from the following sources:
• Pion/proton/Λ reconstruction efficiency uncertainty (8%): evaluated by varying the
simulated detector material [44], alignment, and beamspot position, and by varying the reconstruction cuts, by using different event simulations, and comparing the measuredΛ lifetime [33], which is sensitive to the efficiency correction, to the
world-Table 2: Uncorrected signal yield ratio nΛb
sig/nΛsigb, efficiency ratio e(Λb)/e(Λb), and
efficiency-corrected ratio σ(Λb)/σ(Λb), compared to thePOWHEG [34, 35] and PYTHIA[28] predictions for the corrected ratio. The uncertainties in the corrected ratio are statistical and systematic, respectively. The uncertainties on the uncorrected yield ratio are statistical only and on the efficiency ratio are systematic only.
Uncorrected Data POWHEG PYTHIA
pΛb
T (GeV) nΛsigb/nΛsigb e(Λb)/e(Λb) σ(Λb)/σ(Λb) σ(Λb)/σ(Λb) σ(Λb)/σ(Λb)
10–13 0.96±0.14 0.84±0.09 1.14±0.17±0.12 0.98+−0.020.01 0.99 13–15 0.76±0.11 0.79±0.09 0.96±0.14±0.10 0.98+−0.020.01 0.98 15–18 0.89±0.13 0.90±0.09 0.98±0.14±0.09 1.01+−0.010.05 0.99 18–22 0.73±0.12 0.95±0.08 0.77±0.12±0.07 0.97+−0.050.02 0.99 22–28 1.26±0.24 0.94±0.10 1.33±0.26±0.14 0.99+−0.020.03 0.99 28–50 0.99±0.25 0.72±0.08 1.37±0.35±0.14 0.96+−0.060.04 0.97
Uncorrected Data POWHEG PYTHIA
|yΛb| nΛb sig/nΛsigb e(Λb)/e(Λb) σ(Λb)/σ(Λb) σ(Λb)/σ(Λb) σ(Λb)/σ(Λb) 0.0–0.3 0.71±0.10 0.79±0.08 0.89±0.13±0.09 0.98+−0.020.01 0.99 0.3–0.6 0.92±0.13 0.90±0.08 1.02±0.14±0.09 1.01+−0.010.05 0.98 0.6–0.9 1.16±0.18 0.88±0.09 1.32±0.21±0.13 0.97+−0.050.02 0.97 0.9–1.2 0.99±0.17 0.85±0.09 1.16±0.20±0.12 0.98+−0.030.02 1.00 1.2–1.5 0.92±0.17 0.82±0.11 1.11±0.20±0.15 0.99+−0.020.01 1.00 1.5–2.0 0.66±0.16 0.99±0.11 0.67±0.16±0.08 0.98+−0.030.02 0.98
average value [24].
• Tag-and-probe statistical uncertainties (4–6%): evaluated by propagating statistical
uncertainties from the data-driven determination of the single-muon efficiencies.
• Tag-and-probe systematic uncertainties (1–7%): evaluated as the difference between
the true efficiency in simulation and the efficiency calculated with the tag-and-probe procedure applied to simulated events.
• Statistical precision of the simulated event samples (3–4%): calculated for the dimuon acceptance and reconstruction efficiencies.
• Simulation modeling of theΛbkinematic distributions (0–5%): evaluated as half of
the difference due to the kinematic reweighting.
• GEANT4 p cross section (1–4%): evaluated by considering an alternative cross
sec-tion model in GEANT4 (CHIPS) [30] for p cross sections for interacting with material in the detector [45] and taking the difference in the efficiency as a systematic uncer-tainty.
• UnknownΛbpolarization (1–4%): evaluated by generating samples of events with
theΛbspin fully aligned or anti-aligned with the normal to the plane defined by the
Λbmomentum and the pp beam direction in the laboratory frame and taking the
average difference in the efficiency when compared to the nominal analysis, which is performed with unpolarized simulated events.
• Pileup (0–4%): evaluated by varying the number of pileup interactions in simulated
events by the uncertainty of the measured pileup interaction distribution.
• Muon kinematics (0–2%): evaluated as the difference in the simulated efficiency
when reweighting the muon pT to match the distribution measured with muons
from the inclusive J/ψ sample used in the tag-and-probe measurements.
• Effect of events migrating between pTand y bins due to resolution (0–1%): evaluated
as half of the correction deduced from simulated events.
The bin-to-bin systematic uncertainty is computed as the sum in quadrature of the individual uncertainties and is summarized in Table 1. In addition, there are normalization uncertainties
of 2.2% from the luminosity measurement [25] and of 1.3% from the J/ψ → µ+µ− andΛ →
pπ branching fractions [24]. For the total cross section result computed from the sum of pT
bins, only the signal and background shapes, and the tag-and-probe and simulation statistical uncertainties are treated as uncorrelated. As bin-to-bin correlations cannot be ruled out for the remaining sources of systematic uncertainty, the contribution in each pTbin is added linearly
to compute the sum to ensure that the uncertainty is not underestimated.
Many of these systematic effects cancel in the σ(Λb)/σ(Λb)ratio measurement. The remaining
uncertainties are from the signal shape (2–8%), background shape (1–3%), GEANT4 p cross
section (1–7%), variation of detector material (5%), and statistical precision of the simulated samples (6–8%), which are evaluated as described above. The total systematic uncertainty is computed as the quadrature sum of the individual uncertainties and is summarized in Table 2.
8
Conclusions
In summary, the first measurements of the differential cross sections times branching fraction dσ/dpΛb
T × B(Λb→J/ψΛ)and dσ/dyΛb× B(Λb →J/ψΛ)forΛbbaryons produced in pp
col-lisions at√s =7 TeV have been presented. The measurements are given for pΛb
|yΛb| <2.0. The pΛb
T distribution falls faster than both the measured pTspectra from b mesons
and the predicted spectra from the NLO MCPOWHEGand the leading-order MCPYTHIA. The
total cross section and rapidity distribution are consistent with both predictions within large uncertainties. The measured σ(Λb)/σ(Λb)ratio is consistent with unity and constant as a func-tion of both pΛb
T and|yΛb|.
Acknowledgments
We congratulate our colleagues in the CERN accelerator departments for the excellent perfor-mance of the LHC machine. We thank the technical and administrative staff at CERN and other CMS institutes, and acknowledge support from: FMSR (Austria); FNRS and FWO (Belgium); CNPq, CAPES, FAPERJ, and FAPESP (Brazil); MES (Bulgaria); CERN; CAS, MoST, and NSFC (China); COLCIENCIAS (Colombia); MSES (Croatia); RPF (Cyprus); MoER, SF0690030s09 and ERDF (Estonia); Academy of Finland, MEC, and HIP (Finland); CEA and CNRS/IN2P3 (France); BMBF, DFG, and HGF (Germany); GSRT (Greece); OTKA and NKTH (Hungary); DAE and DST (India); IPM (Iran); SFI (Ireland); INFN (Italy); NRF and WCU (Korea); LAS (Lithuania); CIN-VESTAV, CONACYT, SEP, and UASLP-FAI (Mexico); MSI (New Zealand); PAEC (Pakistan); MSHE and NSC (Poland); FCT (Portugal); JINR (Armenia, Belarus, Georgia, Ukraine, Uzbek-istan); MON, RosAtom, RAS and RFBR (Russia); MSTD (Serbia); MICINN and CPAN (Spain); Swiss Funding Agencies (Switzerland); NSC (Taipei); TUBITAK and TAEK (Turkey); STFC (United Kingdom); DOE and NSF (USA). Individuals have received support from the Marie-Curie programme and the European Research Council (European Union); the Leventis Foun-dation; the A. P. Sloan FounFoun-dation; the Alexander von Humboldt FounFoun-dation; the Belgian Fed-eral Science Policy Office; the Fonds pour la Formation `a la Recherche dans l’Industrie et dans l’Agriculture (FRIA-Belgium); the Agentschap voor Innovatie door Wetenschap en Technologie (IWT-Belgium); the Council of Science and Industrial Research, India; and the HOMING PLUS programme of Foundation for Polish Science, cofinanced from European Union, Regional De-velopment Fund.
References
[1] UA1 Collaboration, “Measurement of the bottom quark production cross section in proton-antiproton collisions at√s =0.63 TeV”, Phys. Lett. B 213 (1988) 405,
doi:10.1016/0370-2693(88)91785-6.
[2] CDF Collaboration, “Measurement of the B Meson Differential Cross Section dσ/dpTin
p ¯p Collisions at√s=1.8 TeV”, Phys. Rev. Lett. 75 (1995) 1451,
doi:10.1103/PhysRevLett.75.1451.
[3] CDF Collaboration, “Measurement of the B√ +production cross section in p ¯p collisions at
s =1960 GeV”, Phys. Rev. D 75 (2007) 012010,
doi:10.1103/PhysRevD.75.012010.
[4] D0 Collaboration, “Inclusive µ and b-Quark Production Cross Sections in p ¯p Collisions at√
s =1.8 TeV”, Phys. Rev. Lett. 74 (1995) 3548, doi:10.1103/PhysRevLett.74.3548.
[5] HERA-B Collaboration, “Investigation of heavy-quark production in proton-nucleus collisions with the HERA-B detector”, Phys. Atom. Nucl. 72 (2009) 675,
[6] CMS Collaboration, “Measurement of the B√ +Production Cross Section in pp Collisions at s =7 TeV”, Phys. Rev. Lett. 106 (2011) 112001,
doi:10.1103/PhysRevLett.106.112001.
[7] CMS Collaboration, “Measurement of the B√ 0Production Cross Section in pp Collisions at
s =7 TeV”, Phys. Rev. Lett. 106 (2011) 252001, doi:10.1103/PhysRevLett.106.252001.
[8] CMS Collaboration, “Inclusive b-hadron production cross section with muons in pp
collisions at√s=7 TeV”, JHEP 03 (2011) 090, doi:10.1007/JHEP03(2011)090.
[9] CMS Collaboration, “Measurement of the B0s Production Cross Section with B0s →J/ψφ Decays in pp Collisions at√s=7 TeV”, Phys. Rev. D 84 (2011) 052008,
doi:10.1103/PhysRevD.84.052008.
[10] LHCb Collaboration, “Measurement of σ(pp→bbX)at√s=7 TeV in the forward
region”, Phys. Lett. B 694 (2010) 209, doi:10.1016/j.physletb.2010.10.010.
[11] CMS Collaboration, “Inclusive b-jet production in pp collisions at√s =7 TeV”, JHEP 04
(2012) 84, doi:10.1007/JHEP04(2012)084, arXiv:1202.4617.
[12] ATLAS Collaboration, “Measurement of the inclusive and dijet cross-sections of b-jets in pp collisions at√s =7 TeV with the ATLAS detector”, Eur. Phys. J. C 71 (2011) 1846,
doi:10.1140/epjc/s10052-011-1846-4.
[13] CMS Collaboration, “Measurement of the cross section for production of b¯b X, decaying
to muons in pp collisions at√s=7 TeV”, (2012). arXiv:1203.3458. Submitted to
JHEP.
[14] P. Nason, S. Dawson, and R. K. Ellis, “The total cross section for the production of heavy quarks in hadronic collisions”, Nucl. Phys. B 303 (1988) 607,
doi:10.1016/0550-3213(88)90422-1.
[15] M. Cacciari et al., “QCD analysis of first b cross section data at 1.96 TeV”, JHEP 07 (2004) 033, doi:10.1088/1126-6708/2004/07/033.
[16] M. Cacciari, M. Greco, and P. Nason, “The pTspectrum in heavy-flavour
hadroproduction”, JHEP 05 (1998) 007, doi:10.1088/1126-6708/1998/05/007. [17] B. A. Kniehl and G. Kramer, “Finite-mass effects on inclusive B-meson hadroproduction”,
Phys. Rev. D 77 (2008) 014011, doi:10.1103/PhysRevD.77.014011.
[18] CMS Collaboration, “The CMS experiment at the CERN LHC”, JINST 3 (2008) S08004, doi:10.1088/1748-0221/3/08/S08004.
[19] S. H. Lee et al., “ΛcEnhancement from Strongly Coupled Quark-Gluon Plasma”, Phys.
Rev. Lett. 100 (2008) 222301, doi:10.1103/PhysRevLett.100.222301.
[20] Y. Oh et al., “Heavy baryon/meson ratios in relativistic heavy ion collisions”, Phys. Rev. C 79 (2009) 044905, doi:10.1103/PhysRevC.79.044905.
[21] A. Ayala et al., “Heavy flavor nuclear modification factor: more baryons than mesons less energy loss”, (2011). arXiv:1110.4587.
[22] G. H. Arakelyan et al., “Midrapidity Production of Secondaries in pp Collisions at RHIC and LHC Energies in the Quark-Gluon String Model”, Eur. Phys. J. C 54 (2008) 577, doi:10.1140/epjc/s10052-008-0554-1.
[23] C. Merino, C. Pajares, and Y. M. Shabelski, “Particle Production in the Central Region at LHC Energies”, (2011). arXiv:1105.6026.
[24] Particle Data Group Collaboration, “Review of Particle Physics”, J. Phys. G 37 (2010) 075021, doi:10.1088/0954-3899/37/7A/075021.
[25] CMS Collaboration, “Absolute Calibration of the Luminosity Measurement at CMS: Winter 2012 Update”, CMS Physics Analysis Summary CMS-PAS-SMP-12-008, (2012). [26] CMS Collaboration, “CMS tracking performance results from early LHC operation”, Eur.
Phys. J. C 70 (2010) 1165, doi:10.1140/epjc/s10052-010-1491-3.
[27] CMS Collaboration, “Performance of muon identification in pp collisions at√s = 7 TeV”,
CMS Physics Analysis Summary CMS-PAS-MUO-10-002, (2010).
[28] T. Sj ¨ostrand, S. Mrenna and P. Skands, “PYTHIA6.4 physics and manual”, JHEP 05 (2006)
026, doi:10.1088/1126-6708/2006/05/026.
[29] D. J. Lange, “TheEVTGENparticle decay simulation package”, Nucl. Instrum. Meth. A
462(2001) 152, doi:10.1016/S0168-9002(01)00089-4.
[30] GEANT4 Collaboration, “GEANT4—a simulation toolkit”, Nucl. Instrum. Meth. A 506 (2003) 250, doi:10.1016/S0168-9002(03)01368-8.
[31] CMS Collaboration, “Prompt and non-prompt J/ψ production in pp collisions at√
s =7 TeV”, Eur. Phys. J. C 71 (2011) 1575,
doi:10.1140/epjc/s10052-011-1575-8.
[32] CMS Collaboration, “Measurement of Tracking Efficiency”, CMS Physics Analysis Summary CMS-PAS-TRK-10-002, (2010).
[33] CMS Collaboration, “Strange particle production in pp collisions at√s=0.9 and 7 TeV”,
JHEP 05 (2011) 064, doi:10.1007/JHEP05(2011)064.
[34] S. Alioli et al., “A general framework for implementing NLO calculations in shower Monte Carlo programs: the POWHEG BOX”, JHEP 06 (2010) 043,
doi:10.1007/JHEP06(2010)043.
[35] S. Frixione, P. Nason, and G. Ridolfi, “A Positive-weight next-to-leading-order Monte Carlo for heavy flavour hadroproduction”, JHEP 09 (2007) 126,
doi:10.1088/1126-6708/2007/09/126.
[36] J. Pumplin et al., “New generation of parton distributions with uncertainties from global QCD analysis”, JHEP 07 (2002) 012, doi:10.1088/1126-6708/2002/07/012. [37] R. Field, “Early LHC Underlying Event Data—Findings and Surprises”, (2010).
arXiv:1010.3558. Proceedings of the Hadron Collider Physics Symposium 2010.
[38] S. Frixione, P. Nason, and B. R. Webber, “Matching NLO QCD and parton showers in heavy flavour production”, JHEP 08 (2003) 007,
[39] DELPHI Collaboration, “Lifetime and production rate of beauty baryons from Z decays”, Z. Phys. C 68 (1995) 375, doi:10.1007/BF01620730.
[40] ALEPH Collaboration, “Strange b baryon production and lifetime in Z decays”, Phys. Lett. B 384 (1996) 449, doi:10.1016/0370-2693(96)00925-2.
[41] CDF Collaboration, “Measurement of ratios of fragmentation fractions for bottom hadrons in pp collisions at√s=1.96 TeV”, Phys. Rev. D 77 (2008) 072003,
doi:10.1103/PhysRevD.77.072003.
[42] LHCb Collaboration, “Measurement of b hadron production fractions in 7 TeV pp collisions”, Phys. Rev. D 85 (2012) 032008, doi:10.1103/PhysRevD.85.032008. [43] C. Tsallis, “Possible Generalization of Boltzmann-Gibbs Statistics”, J. Stat. Phys. 52 (1988)
479, doi:10.1007/BF01016429.
[44] CMS Collaboration, “Altered scenarios of the CMS Tracker material for systematic uncertainties studies”, CMS Note CMS-Note-10-010, (2010).
[45] ALICE Collaboration, “Midrapidity antiproton-to-proton ratio in pp collisions at√
s =0.9 and 7 TeV measured by the ALICE experiment”, Phys. Rev. Lett. 105 (2010)
A
The CMS Collaboration
Yerevan Physics Institute, Yerevan, Armenia
S. Chatrchyan, V. Khachatryan, A.M. Sirunyan, A. Tumasyan
Institut f ¨ur Hochenergiephysik der OeAW, Wien, Austria
W. Adam, T. Bergauer, M. Dragicevic, J. Er ¨o, C. Fabjan, M. Friedl, R. Fr ¨uhwirth, V.M. Ghete, J. Hammer, N. H ¨ormann, J. Hrubec, M. Jeitler, W. Kiesenhofer, V. Kn ¨unz, M. Krammer, D. Liko, I. Mikulec, M. Pernicka†, B. Rahbaran, C. Rohringer, H. Rohringer, R. Sch ¨ofbeck, J. Strauss, A. Taurok, P. Wagner, W. Waltenberger, G. Walzel, E. Widl, C.-E. Wulz
National Centre for Particle and High Energy Physics, Minsk, Belarus
V. Mossolov, N. Shumeiko, J. Suarez Gonzalez
Universiteit Antwerpen, Antwerpen, Belgium
S. Bansal, T. Cornelis, E.A. De Wolf, X. Janssen, S. Luyckx, T. Maes, L. Mucibello, S. Ochesanu, B. Roland, R. Rougny, M. Selvaggi, Z. Staykova, H. Van Haevermaet, P. Van Mechelen, N. Van Remortel, A. Van Spilbeeck
Vrije Universiteit Brussel, Brussel, Belgium
F. Blekman, S. Blyweert, J. D’Hondt, R. Gonzalez Suarez, A. Kalogeropoulos, M. Maes, A. Olbrechts, W. Van Doninck, P. Van Mulders, G.P. Van Onsem, I. Villella
Universit´e Libre de Bruxelles, Bruxelles, Belgium
O. Charaf, B. Clerbaux, G. De Lentdecker, V. Dero, A.P.R. Gay, T. Hreus, A. L´eonard, P.E. Marage, T. Reis, L. Thomas, C. Vander Velde, P. Vanlaer, J. Wang
Ghent University, Ghent, Belgium
V. Adler, K. Beernaert, A. Cimmino, S. Costantini, G. Garcia, M. Grunewald, B. Klein, J. Lellouch, A. Marinov, J. Mccartin, A.A. Ocampo Rios, D. Ryckbosch, N. Strobbe, F. Thyssen, M. Tytgat, L. Vanelderen, P. Verwilligen, S. Walsh, E. Yazgan, N. Zaganidis
Universit´e Catholique de Louvain, Louvain-la-Neuve, Belgium
S. Basegmez, G. Bruno, R. Castello, L. Ceard, C. Delaere, T. du Pree, D. Favart, L. Forthomme,
A. Giammanco1, J. Hollar, V. Lemaitre, J. Liao, O. Militaru, C. Nuttens, D. Pagano, A. Pin,
K. Piotrzkowski, N. Schul, J.M. Vizan Garcia
Universit´e de Mons, Mons, Belgium
N. Beliy, T. Caebergs, E. Daubie, G.H. Hammad
Centro Brasileiro de Pesquisas Fisicas, Rio de Janeiro, Brazil
G.A. Alves, M. Correa Martins Junior, D. De Jesus Damiao, T. Martins, M.E. Pol, M.H.G. Souza
Universidade do Estado do Rio de Janeiro, Rio de Janeiro, Brazil
W.L. Ald´a J ´unior, W. Carvalho, A. Cust ´odio, E.M. Da Costa, C. De Oliveira Martins, S. Fonseca De Souza, D. Matos Figueiredo, L. Mundim, H. Nogima, V. Oguri, W.L. Prado Da Silva, A. Santoro, L. Soares Jorge, A. Sznajder
Instituto de Fisica Teorica, Universidade Estadual Paulista, Sao Paulo, Brazil
C.A. Bernardes2, F.A. Dias3, T.R. Fernandez Perez Tomei, E. M. Gregores2, C. Lagana,
F. Marinho, P.G. Mercadante2, S.F. Novaes, Sandra S. Padula
Institute for Nuclear Research and Nuclear Energy, Sofia, Bulgaria
V. Genchev4, P. Iaydjiev4, S. Piperov, M. Rodozov, S. Stoykova, G. Sultanov, V. Tcholakov,
University of Sofia, Sofia, Bulgaria
A. Dimitrov, R. Hadjiiska, V. Kozhuharov, L. Litov, B. Pavlov, P. Petkov
Institute of High Energy Physics, Beijing, China
J.G. Bian, G.M. Chen, H.S. Chen, C.H. Jiang, D. Liang, S. Liang, X. Meng, J. Tao, J. Wang, X. Wang, Z. Wang, H. Xiao, M. Xu, J. Zang, Z. Zhang
State Key Lab. of Nucl. Phys. and Tech., Peking University, Beijing, China
C. Asawatangtrakuldee, Y. Ban, S. Guo, Y. Guo, W. Li, S. Liu, Y. Mao, S.J. Qian, H. Teng, S. Wang, B. Zhu, W. Zou
Universidad de Los Andes, Bogota, Colombia
C. Avila, J.P. Gomez, B. Gomez Moreno, A.F. Osorio Oliveros, J.C. Sanabria
Technical University of Split, Split, Croatia
N. Godinovic, D. Lelas, R. Plestina5, D. Polic, I. Puljak4
University of Split, Split, Croatia
Z. Antunovic, M. Kovac
Institute Rudjer Boskovic, Zagreb, Croatia
V. Brigljevic, S. Duric, K. Kadija, J. Luetic, S. Morovic
University of Cyprus, Nicosia, Cyprus
A. Attikis, M. Galanti, G. Mavromanolakis, J. Mousa, C. Nicolaou, F. Ptochos, P.A. Razis
Charles University, Prague, Czech Republic
M. Finger, M. Finger Jr.
Academy of Scientific Research and Technology of the Arab Republic of Egypt, Egyptian Network of High Energy Physics, Cairo, Egypt
Y. Assran6, S. Elgammal7, A. Ellithi Kamel8, S. Khalil7, M.A. Mahmoud9, A. Radi10,11
National Institute of Chemical Physics and Biophysics, Tallinn, Estonia
M. Kadastik, M. M ¨untel, M. Raidal, L. Rebane, A. Tiko
Department of Physics, University of Helsinki, Helsinki, Finland
V. Azzolini, P. Eerola, G. Fedi, M. Voutilainen
Helsinki Institute of Physics, Helsinki, Finland
J. H¨ark ¨onen, A. Heikkinen, V. Karim¨aki, R. Kinnunen, M.J. Kortelainen, T. Lamp´en, K. Lassila-Perini, S. Lehti, T. Lind´en, P. Luukka, T. M¨aenp¨a¨a, T. Peltola, E. Tuominen, J. Tuominiemi, E. Tuovinen, D. Ungaro, L. Wendland
Lappeenranta University of Technology, Lappeenranta, Finland
K. Banzuzi, A. Korpela, T. Tuuva
DSM/IRFU, CEA/Saclay, Gif-sur-Yvette, France
M. Besancon, S. Choudhury, M. Dejardin, D. Denegri, B. Fabbro, J.L. Faure, F. Ferri, S. Ganjour, A. Givernaud, P. Gras, G. Hamel de Monchenault, P. Jarry, E. Locci, J. Malcles, L. Millischer, A. Nayak, J. Rander, A. Rosowsky, I. Shreyber, M. Titov
Laboratoire Leprince-Ringuet, Ecole Polytechnique, IN2P3-CNRS, Palaiseau, France
S. Baffioni, F. Beaudette, L. Benhabib, L. Bianchini, M. Bluj12, C. Broutin, P. Busson, C. Charlot, N. Daci, T. Dahms, L. Dobrzynski, R. Granier de Cassagnac, M. Haguenauer, P. Min´e, C. Mironov, C. Ochando, P. Paganini, D. Sabes, R. Salerno, Y. Sirois, C. Veelken, A. Zabi
Institut Pluridisciplinaire Hubert Curien, Universit´e de Strasbourg, Universit´e de Haute Alsace Mulhouse, CNRS/IN2P3, Strasbourg, France
J.-L. Agram13, J. Andrea, D. Bloch, D. Bodin, J.-M. Brom, M. Cardaci, E.C. Chabert, C. Collard, E. Conte13, F. Drouhin13, C. Ferro, J.-C. Fontaine13, D. Gel´e, U. Goerlach, P. Juillot, M. Karim13,
A.-C. Le Bihan, P. Van Hove
Centre de Calcul de l’Institut National de Physique Nucleaire et de Physique des Particules (IN2P3), Villeurbanne, France
F. Fassi, D. Mercier
Universit´e de Lyon, Universit´e Claude Bernard Lyon 1, CNRS-IN2P3, Institut de Physique Nucl´eaire de Lyon, Villeurbanne, France
S. Beauceron, N. Beaupere, O. Bondu, G. Boudoul, H. Brun, J. Chasserat, R. Chierici4,
D. Contardo, P. Depasse, H. El Mamouni, J. Fay, S. Gascon, M. Gouzevitch, B. Ille, T. Kurca, M. Lethuillier, L. Mirabito, S. Perries, V. Sordini, S. Tosi, Y. Tschudi, P. Verdier, S. Viret
Institute of High Energy Physics and Informatization, Tbilisi State University, Tbilisi, Georgia
Z. Tsamalaidze14
RWTH Aachen University, I. Physikalisches Institut, Aachen, Germany
G. Anagnostou, S. Beranek, M. Edelhoff, L. Feld, N. Heracleous, O. Hindrichs, R. Jussen, K. Klein, J. Merz, A. Ostapchuk, A. Perieanu, F. Raupach, J. Sammet, S. Schael, D. Sprenger,
H. Weber, B. Wittmer, V. Zhukov15
RWTH Aachen University, III. Physikalisches Institut A, Aachen, Germany
M. Ata, J. Caudron, E. Dietz-Laursonn, M. Erdmann, A. G ¨uth, T. Hebbeker, C. Heidemann, K. Hoepfner, D. Klingebiel, P. Kreuzer, J. Lingemann, C. Magass, M. Merschmeyer, A. Meyer, M. Olschewski, P. Papacz, H. Pieta, H. Reithler, S.A. Schmitz, L. Sonnenschein, J. Steggemann, D. Teyssier, M. Weber
RWTH Aachen University, III. Physikalisches Institut B, Aachen, Germany
M. Bontenackels, V. Cherepanov, M. Davids, G. Fl ¨ugge, H. Geenen, M. Geisler, W. Haj Ahmad, F. Hoehle, B. Kargoll, T. Kress, Y. Kuessel, A. Linn, A. Nowack, L. Perchalla, O. Pooth, J. Rennefeld, P. Sauerland, A. Stahl
Deutsches Elektronen-Synchrotron, Hamburg, Germany
M. Aldaya Martin, J. Behr, W. Behrenhoff, U. Behrens, M. Bergholz16, A. Bethani, K. Borras,
A. Burgmeier, A. Cakir, L. Calligaris, A. Campbell, E. Castro, F. Costanza, D. Dammann, G. Eckerlin, D. Eckstein, D. Fischer, G. Flucke, A. Geiser, I. Glushkov, S. Habib, J. Hauk, H. Jung4, M. Kasemann, P. Katsas, C. Kleinwort, H. Kluge, A. Knutsson, M. Kr¨amer, D. Kr ¨ucker,
E. Kuznetsova, W. Lange, W. Lohmann16, B. Lutz, R. Mankel, I. Marfin, M. Marienfeld,
I.-A. Melzer-Pellmann, A.B. Meyer, J. Mnich, A. Mussgiller, S. Naumann-Emme, J. Olzem, H. Perrey, A. Petrukhin, D. Pitzl, A. Raspereza, P.M. Ribeiro Cipriano, C. Riedl, M. Rosin,
J. Salfeld-Nebgen, R. Schmidt16, T. Schoerner-Sadenius, N. Sen, A. Spiridonov, M. Stein,
R. Walsh, C. Wissing
University of Hamburg, Hamburg, Germany
C. Autermann, V. Blobel, S. Bobrovskyi, J. Draeger, H. Enderle, J. Erfle, U. Gebbert, M. G ¨orner, T. Hermanns, R.S. H ¨oing, K. Kaschube, G. Kaussen, H. Kirschenmann, R. Klanner, J. Lange, B. Mura, F. Nowak, T. Peiffer, N. Pietsch, C. Sander, H. Schettler, P. Schleper, E. Schlieckau, A. Schmidt, M. Schr ¨oder, T. Schum, H. Stadie, G. Steinbr ¨uck, J. Thomsen
Institut f ¨ur Experimentelle Kernphysik, Karlsruhe, Germany
C. Barth, J. Berger, T. Chwalek, W. De Boer, A. Dierlamm, M. Feindt, M. Guthoff4, C. Hackstein,
F. Hartmann, M. Heinrich, H. Held, K.H. Hoffmann, S. Honc, I. Katkov15, J.R. Komaragiri,
D. Martschei, S. Mueller, Th. M ¨uller, M. Niegel, A. N ¨urnberg, O. Oberst, A. Oehler, J. Ott, G. Quast, K. Rabbertz, F. Ratnikov, N. Ratnikova, S. R ¨ocker, A. Scheurer, F.-P. Schilling, G. Schott, H.J. Simonis, F.M. Stober, D. Troendle, R. Ulrich, J. Wagner-Kuhr, T. Weiler, M. Zeise
Institute of Nuclear Physics ”Demokritos”, Aghia Paraskevi, Greece
G. Daskalakis, T. Geralis, S. Kesisoglou, A. Kyriakis, D. Loukas, I. Manolakos, A. Markou, C. Markou, C. Mavrommatis, E. Ntomari
University of Athens, Athens, Greece
L. Gouskos, T.J. Mertzimekis, A. Panagiotou, N. Saoulidou
University of Io´annina, Io´annina, Greece
I. Evangelou, C. Foudas4, P. Kokkas, N. Manthos, I. Papadopoulos, V. Patras
KFKI Research Institute for Particle and Nuclear Physics, Budapest, Hungary
G. Bencze, C. Hajdu4, P. Hidas, D. Horvath17, K. Krajczar18, B. Radics, F. Sikler4, V. Veszpremi,
G. Vesztergombi18
Institute of Nuclear Research ATOMKI, Debrecen, Hungary
N. Beni, S. Czellar, J. Molnar, J. Palinkas, Z. Szillasi
University of Debrecen, Debrecen, Hungary
J. Karancsi, P. Raics, Z.L. Trocsanyi, B. Ujvari
Panjab University, Chandigarh, India
S.B. Beri, V. Bhatnagar, N. Dhingra, R. Gupta, M. Jindal, M. Kaur, J.M. Kohli, M.Z. Mehta, N. Nishu, L.K. Saini, A. Sharma, J. Singh
University of Delhi, Delhi, India
S. Ahuja, A. Bhardwaj, B.C. Choudhary, A. Kumar, A. Kumar, S. Malhotra, M. Naimuddin, K. Ranjan, V. Sharma, R.K. Shivpuri
Saha Institute of Nuclear Physics, Kolkata, India
S. Banerjee, S. Bhattacharya, S. Dutta, B. Gomber, Sa. Jain, Sh. Jain, R. Khurana, S. Sarkar, M. Sharan
Bhabha Atomic Research Centre, Mumbai, India
A. Abdulsalam, R.K. Choudhury, D. Dutta, S. Kailas, V. Kumar, P. Mehta, A.K. Mohanty4,
L.M. Pant, P. Shukla
Tata Institute of Fundamental Research - EHEP, Mumbai, India
T. Aziz, S. Ganguly, M. Guchait19, M. Maity20, G. Majumder, K. Mazumdar, G.B. Mohanty,
B. Parida, K. Sudhakar, N. Wickramage
Tata Institute of Fundamental Research - HECR, Mumbai, India
S. Banerjee, S. Dugad
Institute for Research in Fundamental Sciences (IPM), Tehran, Iran
H. Arfaei, H. Bakhshiansohi21, S.M. Etesami22, A. Fahim21, M. Hashemi, H. Hesari, A. Jafari21,
M. Khakzad, A. Mohammadi23, M. Mohammadi Najafabadi, S. Paktinat Mehdiabadi,
INFN Sezione di Baria, Universit`a di Barib, Politecnico di Baric, Bari, Italy
M. Abbresciaa,b, L. Barbonea,b, C. Calabriaa,b,4, S.S. Chhibraa,b, A. Colaleoa, D. Creanzaa,c, N. De Filippisa,c,4, M. De Palmaa,b, L. Fiorea, G. Iasellia,c, L. Lusitoa,b, G. Maggia,c, M. Maggia, B. Marangellia,b, S. Mya,c, S. Nuzzoa,b, N. Pacificoa,b, A. Pompilia,b, G. Pugliesea,c,
G. Selvaggia,b, L. Silvestrisa, G. Singha,b, G. Zitoa
INFN Sezione di Bolognaa, Universit`a di Bolognab, Bologna, Italy
G. Abbiendia, A.C. Benvenutia, D. Bonacorsia,b, S. Braibant-Giacomellia,b, L. Brigliadoria,b, P. Capiluppia,b, A. Castroa,b, F.R. Cavalloa, M. Cuffiania,b, G.M. Dallavallea, F. Fabbria, A. Fanfania,b, D. Fasanellaa,b,4, P. Giacomellia, C. Grandia, L. Guiducci, S. Marcellinia, G. Masettia, M. Meneghellia,b,4, A. Montanaria, F.L. Navarriaa,b, F. Odoricia, A. Perrottaa, F. Primaveraa,b, A.M. Rossia,b, T. Rovellia,b, G. Sirolia,b, R. Travaglinia,b
INFN Sezione di Cataniaa, Universit`a di Cataniab, Catania, Italy
S. Albergoa,b, G. Cappelloa,b, M. Chiorbolia,b, S. Costaa,b, R. Potenzaa,b, A. Tricomia,b, C. Tuvea,b
INFN Sezione di Firenzea, Universit`a di Firenzeb, Firenze, Italy
G. Barbaglia, V. Ciullia,b, C. Civininia, R. D’Alessandroa,b, E. Focardia,b, S. Frosalia,b, E. Galloa, S. Gonzia,b, M. Meschinia, S. Paolettia, G. Sguazzonia, A. Tropianoa,4
INFN Laboratori Nazionali di Frascati, Frascati, Italy
L. Benussi, S. Bianco, S. Colafranceschi25, F. Fabbri, D. Piccolo
INFN Sezione di Genova, Genova, Italy
P. Fabbricatore, R. Musenich
INFN Sezione di Milano-Bicoccaa, Universit`a di Milano-Bicoccab, Milano, Italy
A. Benagliaa,b,4, F. De Guioa,b, L. Di Matteoa,b,4, S. Fiorendia,b, S. Gennaia,4, A. Ghezzia,b, S. Malvezzia, R.A. Manzonia,b, A. Martellia,b, A. Massironia,b,4, D. Menascea, L. Moronia, M. Paganonia,b, D. Pedrinia, S. Ragazzia,b, N. Redaellia, S. Salaa, T. Tabarelli de Fatisa,b
INFN Sezione di Napolia, Universit`a di Napoli ”Federico II”b, Napoli, Italy
S. Buontempoa, C.A. Carrillo Montoyaa,4, N. Cavalloa,26, A. De Cosaa,b,4, O. Doganguna,b, F. Fabozzia,26, A.O.M. Iorioa,4, L. Listaa, S. Meolaa,27, M. Merolaa,b, P. Paoluccia,4
INFN Sezione di Padovaa, Universit`a di Padovab, Universit`a di Trento (Trento)c, Padova, Italy
P. Azzia, N. Bacchettaa,4, P. Bellana,b, D. Biselloa,b, A. Brancaa,4, R. Carlina,b, P. Checchiaa, T. Dorigoa, U. Dossellia, F. Gasparinia,b, A. Gozzelinoa, K. Kanishcheva,c, S. Lacapraraa, I. Lazzizzeraa,c, M. Margonia,b, A.T. Meneguzzoa,b, M. Nespoloa,4, L. Perrozzia, N. Pozzobona,b, P. Ronchesea,b, F. Simonettoa,b, E. Torassaa, M. Tosia,b,4, S. Vaninia,b, P. Zottoa,b
INFN Sezione di Paviaa, Universit`a di Paviab, Pavia, Italy
M. Gabusia,b, S.P. Rattia,b, C. Riccardia,b, P. Torrea,b, P. Vituloa,b
INFN Sezione di Perugiaa, Universit`a di Perugiab, Perugia, Italy
M. Biasinia,b, G.M. Bileia, L. Fan `oa,b, P. Laricciaa,b, A. Lucaronia,b,4, G. Mantovania,b, M. Menichellia, A. Nappia,b, F. Romeoa,b, A. Saha, A. Santocchiaa,b, S. Taronia,b,4
INFN Sezione di Pisaa, Universit`a di Pisab, Scuola Normale Superiore di Pisac, Pisa, Italy
P. Azzurria,c, G. Bagliesia, T. Boccalia, G. Broccoloa,c, R. Castaldia, R.T. D’Agnoloa,c, R. Dell’Orsoa, F. Fioria,b,4, L. Fo`aa,c, A. Giassia, A. Kraana, F. Ligabuea,c, T. Lomtadzea, L. Martinia,28, A. Messineoa,b, F. Pallaa, F. Palmonaria, A. Rizzia,b, A.T. Serbana,29, P. Spagnoloa, P. Squillaciotia,4, R. Tenchinia, G. Tonellia,b,4, A. Venturia,4, P.G. Verdinia
INFN Sezione di Romaa, Universit`a di Roma ”La Sapienza”b, Roma, Italy
L. Baronea,b, F. Cavallaria, D. Del Rea,b,4, M. Diemoza, M. Grassia,b,4, E. Longoa,b, P. Meridiania,4, F. Michelia,b, S. Nourbakhsha,b, G. Organtinia,b, R. Paramattia, S. Rahatloua,b, M. Sigamania, L. Soffia,b
INFN Sezione di Torino a, Universit`a di Torino b, Universit`a del Piemonte Orientale (No-vara)c, Torino, Italy
N. Amapanea,b, R. Arcidiaconoa,c, S. Argiroa,b, M. Arneodoa,c, C. Biinoa, C. Bottaa,b, N. Cartigliaa, M. Costaa,b, P. De Remigisa, N. Demariaa, A. Grazianoa,b, C. Mariottia,4, S. Masellia, E. Migliorea,b, V. Monacoa,b, M. Musicha,4, M.M. Obertinoa,c, N. Pastronea, M. Pelliccionia, A. Potenzaa,b, A. Romeroa,b, M. Ruspaa,c, R. Sacchia,b, A. Solanoa,b, A. Staianoa, A. Vilela Pereiraa
INFN Sezione di Triestea, Universit`a di Triesteb, Trieste, Italy
S. Belfortea, F. Cossuttia, G. Della Riccaa,b, B. Gobboa, M. Maronea,b,4, D. Montaninoa,b,4, A. Penzoa, A. Schizzia,b
Kangwon National University, Chunchon, Korea
S.G. Heo, T.Y. Kim, S.K. Nam
Kyungpook National University, Daegu, Korea
S. Chang, J. Chung, D.H. Kim, G.N. Kim, D.J. Kong, H. Park, S.R. Ro, D.C. Son, T. Son
Chonnam National University, Institute for Universe and Elementary Particles, Kwangju, Korea
J.Y. Kim, Zero J. Kim, S. Song
Konkuk University, Seoul, Korea
H.Y. Jo
Korea University, Seoul, Korea
S. Choi, D. Gyun, B. Hong, M. Jo, H. Kim, T.J. Kim, K.S. Lee, D.H. Moon, S.K. Park, E. Seo
University of Seoul, Seoul, Korea
M. Choi, S. Kang, H. Kim, J.H. Kim, C. Park, I.C. Park, S. Park, G. Ryu
Sungkyunkwan University, Suwon, Korea
Y. Cho, Y. Choi, Y.K. Choi, J. Goh, M.S. Kim, E. Kwon, B. Lee, J. Lee, S. Lee, H. Seo, I. Yu
Vilnius University, Vilnius, Lithuania
M.J. Bilinskas, I. Grigelionis, M. Janulis, A. Juodagalvis
Centro de Investigacion y de Estudios Avanzados del IPN, Mexico City, Mexico
H. Castilla-Valdez, E. De La Cruz-Burelo, I. Heredia-de La Cruz, R. Lopez-Fernandez, R. Maga ˜na Villalba, J. Mart´ınez-Ortega, A. S´anchez-Hern´andez, L.M. Villasenor-Cendejas
Universidad Iberoamericana, Mexico City, Mexico
S. Carrillo Moreno, F. Vazquez Valencia
Benemerita Universidad Autonoma de Puebla, Puebla, Mexico
H.A. Salazar Ibarguen
Universidad Aut ´onoma de San Luis Potos´ı, San Luis Potos´ı, Mexico
E. Casimiro Linares, A. Morelos Pineda, M.A. Reyes-Santos
University of Auckland, Auckland, New Zealand
University of Canterbury, Christchurch, New Zealand
A.J. Bell, P.H. Butler, R. Doesburg, S. Reucroft, H. Silverwood
National Centre for Physics, Quaid-I-Azam University, Islamabad, Pakistan
M. Ahmad, M.I. Asghar, H.R. Hoorani, S. Khalid, W.A. Khan, T. Khurshid, S. Qazi, M.A. Shah, M. Shoaib
Institute of Experimental Physics, Faculty of Physics, University of Warsaw, Warsaw, Poland
G. Brona, K. Bunkowski, M. Cwiok, W. Dominik, K. Doroba, A. Kalinowski, M. Konecki, J. Krolikowski
Soltan Institute for Nuclear Studies, Warsaw, Poland
H. Bialkowska, B. Boimska, T. Frueboes, R. Gokieli, M. G ´orski, M. Kazana, K. Nawrocki, K. Romanowska-Rybinska, M. Szleper, G. Wrochna, P. Zalewski
Laborat ´orio de Instrumenta¸c˜ao e F´ısica Experimental de Part´ıculas, Lisboa, Portugal
N. Almeida, P. Bargassa, A. David, P. Faccioli, P.G. Ferreira Parracho, M. Gallinaro, J. Seixas, J. Varela, P. Vischia
Joint Institute for Nuclear Research, Dubna, Russia
I. Belotelov, P. Bunin, M. Gavrilenko, I. Golutvin, I. Gorbunov, A. Kamenev, V. Karjavin, G. Kozlov, A. Lanev, A. Malakhov, P. Moisenz, V. Palichik, V. Perelygin, S. Shmatov, V. Smirnov, A. Volodko, A. Zarubin
Petersburg Nuclear Physics Institute, Gatchina (St Petersburg), Russia
S. Evstyukhin, V. Golovtsov, Y. Ivanov, V. Kim, P. Levchenko, V. Murzin, V. Oreshkin, I. Smirnov, V. Sulimov, L. Uvarov, S. Vavilov, A. Vorobyev, An. Vorobyev
Institute for Nuclear Research, Moscow, Russia
Yu. Andreev, A. Dermenev, S. Gninenko, N. Golubev, M. Kirsanov, N. Krasnikov, V. Matveev, A. Pashenkov, D. Tlisov, A. Toropin
Institute for Theoretical and Experimental Physics, Moscow, Russia
V. Epshteyn, M. Erofeeva, V. Gavrilov, M. Kossov4, N. Lychkovskaya, V. Popov, G. Safronov,
S. Semenov, V. Stolin, E. Vlasov, A. Zhokin
Moscow State University, Moscow, Russia
A. Belyaev, E. Boos, M. Dubinin3, L. Dudko, A. Ershov, A. Gribushin, V. Klyukhin, O. Kodolova,
I. Lokhtin, A. Markina, S. Obraztsov, M. Perfilov, S. Petrushanko, A. Popov, L. Sarycheva†,
V. Savrin, A. Snigirev
P.N. Lebedev Physical Institute, Moscow, Russia
V. Andreev, M. Azarkin, I. Dremin, M. Kirakosyan, A. Leonidov, G. Mesyats, S.V. Rusakov, A. Vinogradov
State Research Center of Russian Federation, Institute for High Energy Physics, Protvino, Russia
I. Azhgirey, I. Bayshev, S. Bitioukov, V. Grishin4, V. Kachanov, D. Konstantinov, A. Korablev, V. Krychkine, V. Petrov, R. Ryutin, A. Sobol, L. Tourtchanovitch, S. Troshin, N. Tyurin, A. Uzunian, A. Volkov
University of Belgrade, Faculty of Physics and Vinca Institute of Nuclear Sciences, Belgrade, Serbia

![Table 1: Λ b + Λ b signal yield n sig , efficiency e, and measured differential cross sections times branching fraction dσ/dp T Λ b × B ( Λ b → J/ ψ Λ ) and dσ/dy Λ b × B ( Λ b → J/ ψ Λ ) , compared to the POWHEG [34, 35] and PYTHIA [28] predictions](https://thumb-eu.123doks.com/thumbv2/123dok_br/15728905.1071274/8.892.108.788.336.710/efficiency-measured-differential-sections-branching-fraction-compared-predictions.webp)
![Figure 3: Comparison of production rates for B + [6], B 0 [7], B 0 s [9], and Λ b versus p T](https://thumb-eu.123doks.com/thumbv2/123dok_br/15728905.1071274/10.892.133.773.394.690/figure-comparison-production-rates-b-b-λ-versus.webp)

![Table 2: Uncorrected signal yield ratio n Λ sig b /n Λ sig b , efficiency ratio e ( Λ b ) /e ( Λ b ) , and efficiency- efficiency-corrected ratio σ ( Λ b ) /σ ( Λ b ) , compared to the POWHEG [34, 35] and PYTHIA [28] predictions for the corrected ratio](https://thumb-eu.123doks.com/thumbv2/123dok_br/15728905.1071274/12.892.108.791.533.925/uncorrected-efficiency-efficiency-efficiency-corrected-compared-predictions-corrected.webp)
