UNIVERSIDADE DE ÉVORA
DEPARTAMENTO DE ECONOMIA
DOCUMENTO DE TRABALHO Nº 2006/02
Ferbuary
In Search for Determinants of Intra-Industry Trade within an
Enlarged Europe
*José Caetano
Universidade de Évora, Departamento de Economia Aurora Galego
Universidade de Évora, Departamento de Economia
*
A previous version of this paper was presented in the “First Iberian international Business Conference”, Porto, September 2005.
UNIVERSIDADE DE ÉVORA DEPARTAMENTO DE ECONOMIA
Largo dos Colegiais, 2 – 7000-803 Évora – Portugal Tel.: +351 266 740 894 Fax: +351 266 742 494 www.decon.uevora.pt wp.economia@uevora.pt
Resumo/Abstract:
Most trade between the European Union (EU) and the Central and Eastern European Countries (CEEC) is inter-industrial in nature, based on comparative advantages. However, recent studies have uncovered structural changes in the nature of trade, the most unexpected being the rapid increase in Intra-industry trade (IIT).
In this paper we characterise the dynamics of the CEEC-EU trade using several methodologies that evaluate the type of trade and price-quality ranges. The analysis confirms that there was a significant decline in inter-industrial trade and an increasing specialisation in vertical IIT. Moreover, we found substantial differences in the unit values of exported and imported goods, which suggest that the increasing weight of IIT in the EU-CEEC trade does not result from the factorial contents convergence of the traded goods. Therefore, these trends indicate the emergence of a new division of labour in the enlarged EU. Using a panel data approach we also identify the determinants of vertical and horizontal IIT. The results allow us to conclude that there are some differences in the determinants of these types of trade, although both seem to have a statistically significant relationship with country’s size and Foreign Direct Investment flows
Palavras-chave/Keywords: Intra-industry Trade, European Union enlargement, panel data Classificação JEL/JEL Classification: F14,F15
I. Introduction
Over the last decade, after the centrally planned economic regimes’ disintegration and the European Agreements, the intensity and nature of trade between Central and Eastern European Countries (CEEC) and the European Union (EU) have changed considerably. The subsequent political and economical opening and the perspective of these countries becoming members of the EU spurred foreign direct investment (FDI) flows, thus stimulating economic restructuring and industrial modernisation. In fact, western firms’ have increasingly located productive units in the new EU members in order to ensure access to the emergent domestic markets and to take advantage of lower production costs. Following these firms’ strategies, throughout the transition process profound changes have taken place in the intensity, composition and nature of trade between the incumbent and the old EU members.
In spite of the fact that inter-industry trade still prevails, reflecting the traditional theories based on factor endowments and the classical pattern of comparative advantages between countries with asymmetrical development levels, recent theoretical and empirical research points to structural adjustments in the nature of trade. Several determinants have been suggested to explain the increase of IIT between the EU and CEEC, such as economies of scale, product differentiation and international fragmentation of production. Furthermore, the intensity of FDI flows and multinationals’ strategies seem to influence the nature of trade. Additionally, empirical research has uncovered an increase on vertical differentiation (VIIT), reflecting the two-way trade of goods in different quality ranges. Nevertheless, trade of horizontally differentiated products (HIIT) is becoming more significant in some of the most developed new members.
According to the literature, the determinants and the effects of trade flows depend on the nature of the trade and the type of products differentiation. This issue is crucial on the evaluation of the adjustment costs associated with changes in the trade patterns, especially after the removal of trade barriers. In fact, the more similar the production and trade patterns of integrating countries, the smaller the adjustment costs will be.So, lower adjustment costs are expected in countries with a high level of IIT, especially when horizontal differentiation prevails.
The main objectives of this paper are to characterise the major trends on the nature of the EU-CEEC trade as well as to identify the determinants of the different types of intra-community trade. We will use several methodologies to evaluate the type of trade and the quality range of the traded goods. In order to obtain more accurate results we will employ data from COMEXT (EUROSTAT) with a high level of desegregation (5 digits - SITC classification).
The structure of the paper is as follows. The next section reviews the theoretical foundations of IIT and some results of empirical research are presented. This is followed by an analysis on the developments on the intensity of HIIT and VIIT by countries, taking into consideration the quality ranges on trade. Particular attention is given to the comparison of the CEEC with the Iberian countries. With the purpose of identifying the determinants of IIT in the CEEC-EU trade, we will follow a panel data approach, regressing the types of IIT on several possible explanatory variables. We will conclude the paper referring to the expected impacts within in an enlarged Union, particularly on the possible adjustment costs for the several countries involved.
II. Brief Survey of the Literature on Intra-industry-trade
During the 60’s, several empirical studies revealed that a substantial share of trade consists of similar products, thereby suggesting that trade patterns might seem at odds with the traditional theories of factor endowments. This phenomenon, known as ITT, brought about an intense discussion, as some authors stated that these results were purely due to an insufficient desegregation of the data and others believed that a new set of theoretical answers was necessary. Following these developments, the conceptual and methodological framework regarding IIT went through significant changes. Not surprisingly, several different approaches to this phenomenon coexist today.
Basically, the first models focused on studying correlation relationships between IIT values and economic similarity or industries’ characteristics. Variables related to economic similarity seemed to be statistically more significant in explaining IIT values. Helpman (1987), considered elements of monopolistic competition and found evidence that, for OECD countries, between 1956 and 1981, total GDP and GDP per capita had
statistically significant positive effects on IIT, therefore concluding that the results supported the monopolistic competition theory. However, Hummels and Levinsohon (1995) questioned these findings, suggesting that, when explaining bilateral IIT, one should not forget the importance of the idiosyncratic elements specific to country-pairs.
Other developments have focused on researching the nature of IIT. According to Helpman and Krugman (1985), IIT takes place in both horizontally and vertically differentiated products (trade in goods with similar quality - varieties - and trade in goods of different quality levels, respectively). For that reason, one may establish a link between inter-industry trade and comparative advantage and, also, between IIT and non-competitive markets. So, IIT based on horizontally differentiated products (HIIT) is explained by economies of scale and imperfectly competitive markets. The models of IIT based on vertically differentiated products (VIIT) consider comparative advantage as determinant of this type of trade. For example, Falvey (1981) and Falvey and Kierzkowski (1987) built a model in which differences in factor endowments between countries explain IIT. They assumed that capital intensity used in the productive process is greater for higher qualities of differentiated products. On the other hand, Greenaway and Milner (1986) mentioned the significance of human capital for producing high quality varieties of differentiated goods. In a similar model, Flam and Helpman (1987) stressed the importance of technological and income differences between countries in explaining IIT flows.
Even though most IIT models do not consider differences in labour productivity explicitly, these are somehow embedded. In fact, it is often mentioned that, when countries have similar factor endowments, economic integration will boost HIIT flows and, in the long term, will promote income and productivity catching-up1. However, if IIT flows assume a vertical nature, the production of lower quality goods may be transferred towards lower income countries and the production of higher quality goods towards higher income countries. Therefore, in the case of dissimilarity in factor endowments and technological capacity between the countries involved in an economic integration process, an increase in VIIT flows may be related to difficulties in income and productivity convergence.
1
If we focus specifically on relationship between the EU-15 and the CEEC, most of trade flows still seem to be of inter-industrial nature (Caetano et al., 2002). However, recent studies point to deep structural changes in EU15-CEEC trade. The outstanding growth of IIT between these countries is in fact a bit surprising: “In contrast to the initial expectation of the specialization of the CEEC´s on the labour and the resource intensive products (…), the growth of IIT is one of the most important features in the development of East-West trade” (Fidrmuc and Djablik, 2003). Empirical research have identified the growing importance of IIT in the EU-CEEC trade and suggested several determinants for it. For example, in an early study Hoekman and Djankov (1996), identify high growth in IIT in the EU-CEEC trade and refer economic growth and exports’ performance as determinants, while Aturupane et al. (1999) refer to scale economies, labour intensity of production and product differentiation.
According to Kaminski (2001), IIT between the EU and CEEC is somehow the result of the reorganization and fragmentation of productive processes in multinational corporations. The gradual trade liberalization promoted by the European Agreements and the Outward Processing Trade regimes has reinforced the incentives for European firms to change their production and logistic strategies. New location advantages in the CEEC and access to these emergent markets arose as important aspects to bear in mind.
Some of these determinants, have underpinned a number of theoretical developments and empirical analysis so as to establish a link between the nature of the productive process in different industries and trade patterns. For instance, according to Freudenberg and Lemoine (1999), most of IIT in the EU-CEEC relationship involves vertically differentiated goods and CEEC export mainly lower quality products.
Also, using specific variables for industries, Aturupane et al. (1999) found that there was evidence of a positive relation between the volume of VIIT and economies of scale, labour intensity of production and FDI flows. As for HIIT, a positive relation between FDI flows, industry concentration and product differentiation was found, together with a negative relation with economies of scale and labour intensity of production. Overall, industry-specific variables seem to play a more important role in explaining trade of vertically differentiated products than country-specific variables.
Including FDI flows as a regressor opens a whole new window of perspectives for understanding the relation between trade structures and productivity convergence. In fact, FDI in the CEEC has grown together with the intensification and transformation of trade patterns and its role in technology transfer has been extensively documented (Gabrisch and Segnana, 2003). According to Damijan et al. (2001), productivity has grown more swiftly in CEEC located firms with foreign capital, even though there are no records of spillover effects within the industries.
Other studies confirm the positive relation between FDI and VIIT for specific countries and industries2. One important question is whether FDI explains equally vertical and horizontal IIT flows. If it is the case that FDI has a stronger relation with VIIT, the role of FDI in promoting productivity convergence will be small. This is particularly important as FDI flows seem to have failed in promoting significant technological and organisational dissemination effects for domestic firms that resulted in narrow positive externalities between industries.
III. Recent trends on Intra-industry trade between CEEC and EU
To perform a detailed analysis of the intra-industry specialisation pattern in CEEC-EU trade relations, we applied several methodologies to study the nature and types of trade for the period from 1993 to 2001. We focus on the trade of each CEEC to the EU and also on the trade of the Iberian countries to the rest of EU, due to the importance that the recent EU enlargement may have for these countries. First we will analyse the spatial dimension of IIT by using the Grubel-Lloyd index (1975). This is followed by the use of Abd-El-Rahman (1991) and Freudenberg and Müller (1991) methodologies to identify the types of trade and to study the quality ranges of exports, respectively. The first approach is based on the level of trade overlap and it is considered by some authors as more appropriated to study IIT among countries with similar factor endowments. The results of the IIT indicator3 confirm the increase of this type of trade,
2
See, for example, Hoekman and Djankov (1996) and Fukao et al. (2003).
3
In this paper we analysed IIT from each CEEC and each Iberian country relatively to the EU as a whole and to each of the trade partners, using the Grubel-Lloyd index, which can be seen in appendix. Therefore, we used imports and exports from the EU and each member country to each of the partners. We employed highly disaggregated data (5 digits -SITC classification) from COMEXT (EUROSTAT).
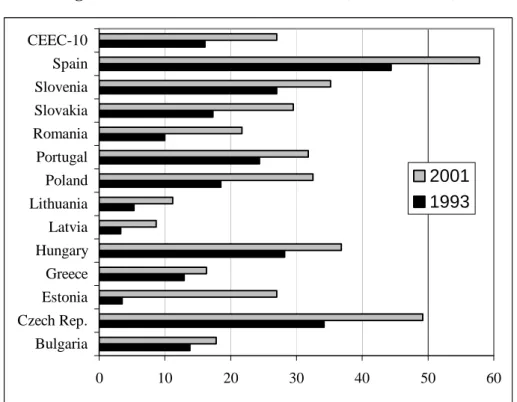
which in 2001 represented about 27% of total CEEC-EU trade, although, this value is still inferior to the one displayed in Intra-UE trade relations. There was a generalised growth on IIT, which lead to a convergence in the values of IIT for the several eastern countries and, in fact, some of them like Czech Republic, Hungary and Slovenia display in 2001 values of IIT that are already higher to those of Portugal and Greece.
Figure 1. IIT with EU for 1993/ 2001 (% total trade)
0 10 20 30 40 50 60 Bulgaria Czech Rep. Estonia Greece Hungary Latvia Lithuania Poland Portugal Romania Slovakia Slovenia Spain CEEC-10 2001 1993
Source: Data base COMEXT – EUROSTAT; authors’ calculations.
Note: Cze (Czech Republic); Hun (Hungary); Slv (Slovenia); Pol (Poland); Slk (Slovakia); Est (Estonia);
Rom (Romania); Bul (Bulgaria); Lit (Lithuania); Lat (Latvia); Spa (Spain); Por (Portugal); Gre (Greece).
When we consider the values of IIT in bilateral terms between the CEEC and the EU members (Caetano et. al., 2002), we conclude that these are clearly higher for geographically close countries (especially for those sharing the same border). In the year 2000 the Czech Republic, Hungary and Slovenia display levels of IIT with Germany and Austria which are clearly higher than those registered among many of the 15 members of the EU at the time. Also Greece and Finland registered values of ITT with some of the CEEC which were higher than those for their relations with the EU members. This confirms the importance of geographic proximity in the intensification of bilateral IIT.
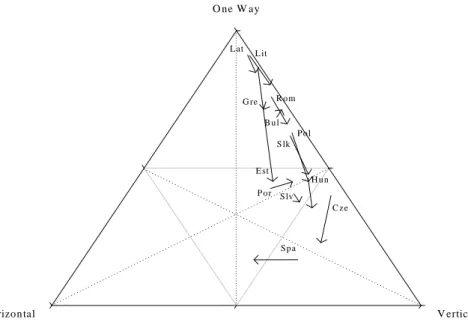
Abd-El-Rahman (1991) developed a methodology that differentiates two types of IIT according to prices in exports and imports. According to this methodology it is possible to distinguish three types of trade: one-way trade, horizontal two-way trade (HIIT) and vertical two-way trade (VIIT)4.
Figure 2. Types of trade between CEEC and EU for 1993/ 2001
Source: Data base COMEXT – EUROSTAT; authors’ calculations.
Note: Cze (Czech Republic); Hun (Hungary); Slv (Slovenia); Pol (Poland); Slk (Slovakia); Est (Estonia);
Rom (Romania); Bul (Bulgaria); Lit (Lithuania); Lat (Latvia); Spa (Spain); Por (Portugal); Gre (Greece).
The results in the case of CEEC-EU trade reveal that although one-way trade (inter-industry trade) still prevails, there was a significant reduction in its share, to the exception of Bulgaria. Nevertheless, in the majority of the new member states the inter-sectoral pattern is still predominant. At the same time, there was an increase in vertical two-way trade in all countries to the exception of Bulgaria, representing about 52% of trade with EU. Finally, horizontal two-way trade is starting to gain some importance, representing in some countries between 10 and 15% in 2001 (particularly in Estonia, Slovenia, Czech Republic and Hungary). On the other hand, the Iberian countries present different trends, while in Portugal VIIT as increased in Spain HIIT has grown.
4
Abd-El-Rahman (1991) methodology can be seen in appendix
V ertical O ne W ay H orizon tal G re P or Sp a E st L at L it Pol C ze S lk H u n R om B u l Slv
Considering the values of IIT and the weight of VIIT on total IIT we get two groups of countries. The first includes Estonia, new member countries of central Europe and Portugal that have a higher level of IIT, particularly in vertically differentiated goods. Nevertheless, in the last few years, in some of these countries HIIT are starting to gain importance. The second group includes Lithuania, Latvia, Bulgaria, Romania and Greece with a value of IIT inferior to 20% of total trade, and almost all VIIT. Therefore, one may conclude that in spite of the increase of IIT in all the countries, the specialisation patterns of the recent entrants in the EU are becoming increasingly heterogeneous, reflecting different factor and technological contents.
The dynamics of these two groups seem to be quite distinct. The most developed countries display better performance in the production of differentiated goods, competing in market segments with prices similar to the ones in Western Europe. This situation may be related with high FDI inflows, higher labour qualification and higher effort in innovation (European Commission, 2004). On the other hand, those countries which reinforced the vertical differentiation pattern, compete in less sophisticated markets and anchor their competitiveness in the production of goods intensive in cheap labour and with low technological contents.
Due to the dynamics of trade flows in the vertically differentiated two-way trade, it is important to identify the market segments where the CEEC exports are positioned when they access the community markets. Thus, we identify the quality ranges of goods, comparing average exports prices with the prices in intra-EU trade. Following previous studies5, we consider unity values as a proxy for quality, in the sense that the price level reflects the quality of the exchange goods. With this aim6, the price-quality structure of all the CEEC and the Iberian countries was examined, with reference to the average unit value of imports and of exports of the EU, respectively.
The situations were typified into three categories: 1) whenever the first is above the second by more than 15%, the flow is considered high quality; 2) If the first is below the second by more than 15%, the flow is classified as low quality; 3) all other cases are considered medium quality.
5
See Fontagné and Freudenberg (1997) and Freudenberg and Lemoine (1999), among others.
6
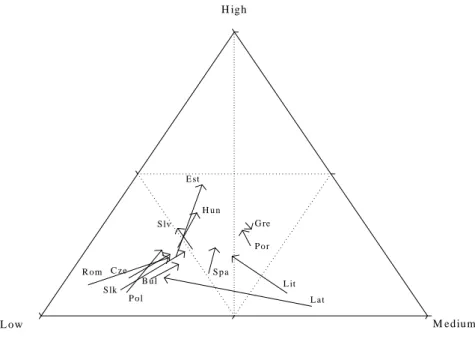
The results allow us to conclude that most of CEEC’ exports to the EU are of low quality products, although a favourable evolution has occurred, decreasing from 70% in 1993 to 56% in 2001. On the contrary, the weight of high quality goods in those countries’ exports is still low, in spite of having almost doubled, from 9,5% to 18,9% during the period. The Iberian countries display a more balanced trade structure which has been more stable along the time. Hence, there was a clear convergence between these two groups of countries, with Estonia, Slovenia and Hungary presenting a higher share of high quality of exports to EU than Portugal and Spain do. The evolution was very similar for the several countries, to the exception of Lithuania and Latvia where the share of low quality goods has increased.
Figure 3. Price-quality ranges of exports to the EU - 1993/ 2001
M ed iu m H ig h L o w G re P o r S p a E st L a t L it P o l C ze S lk H u n R o m B u l S lv
Source: Data base COMEXT – EUROSTAT; authors’ calculations.
Note: Cze (Czech Republic); Hun (Hungary); Slv (Slovenia); Pol (Poland); Slk (Slovakia); Est (Estonia);
Rom (Romania); Bul (Bulgaria); Lit (Lithuania); Lat (Latvia); Spa (Spain); Por (Portugal); Gre (Greece).
Brücker (1998) has detected the same tendencies and according to him the reduction of low range exports in the CEEC is due to the fall of natural resources’ exports and to the increase of exports of goods with higher technological content, whose production and distribution is controlled by multinational firms. Thus, in accordance with Freudenberg and Lemoine (1999), we conclude that the CEEC’ position in terms of price/quality
suggests a clear qualitative labour division between the EU-15 and the new member states, even though increasingly heterogeneous in the both groups of countries.
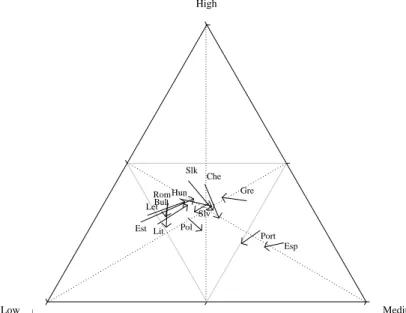
As for imports, it is possible to conclude that there was a convergence along the period, as Iberian countries present a higher share of low quality imports and the CEEC reduced the percentage of this type of imports. We believe that the increasing sophistication of consumption habits in the CEEC, associated with higher economic growth and a gradual increase of purchasing power reflect this tendency. Consequently, there are some suggestions that globalisation and economic liberalisation have induced a faster convergence in consumption patterns and in the production structures.
Figure 4. Price-quality ranges of imports from the EU- 1993/ 2001
Source: Data base COMEXT – EUROSTAT; authors’ calculations.
Note: Cze (Czech Republic); Hun (Hungary); Slv (Slovenia); Pol (Poland); Slk (Slovakia); Est (Estonia);
Rom (Romania); Bul (Bulgaria); Lit (Lithuania); Lat (Latvia); Spa (Spain); Por (Portugal); Gre (Greece).
IV. Econometric approach and analysis of the results
In this section we estimate a gravity-type model in order to identify the main determinants of IIT trade between EU members and CEEC in the period 1993 to 2001. Many previous studies on IIT between CEEC and EU, have not considered the
Média Alta Baixa Gre Port Esp Est Let Lit Pol Che Slk Hun Rom Bul Slv Low High Medium
difference between vertical IIT and horizontal IIT. Several authors (see for example Greenway, Hine and Milner, 1994) have pointed out that this fact may produce unbiased estimates. Therefore, in this paper we estimate different regressions for vertical and horizontal IIT and analysed whether there are differences on the determinants of the two types of IIT.
We consider data on horizontal and vertical IIT between each 24 countries (Belgium and Luxembourg are considered as one) and the EU as a whole for 1993, 1995, 1997 and 2001. As a starting point for the analysis we will consider the explanatory variables proposed by the Helpman (1987) equation for explaining IIT between countries, like economic distance between countries (measure by the absolute value of the difference in GDP per capita) and countries size (measured by the level of GDP).
We also include in the model other explanatory variables, like distance, a dummy indicating if the country is a EU member (EU), foreign direct investment as a percentage of GDP (FDI) and the human development index (HDI). In the case of distance we follow closely Fidrmuc and Djablik (2003) and calculate a weighted-average distance to other countries:
∑
= j j
ij w D
R
Where Dj is the distance in Km for the capital cities of the 14 countries (considering Belgium and Luxemburg as one) and wj is the member country’s share of the EU aggregate output.
Unlike other studies we use panel data techniques to estimate a gravity type model. In fact, it is important to take into consideration possible unobservable country effects which may be correlated with IIT. Among these country effects one may consider national industry policy, managerial know-how and so on. Our full estimated model is therefore: (A) ieut i t it it it a eut it ieut ieut a HDI FDI EU R GDP GDP ED IIT
ε
γ
β
β
β
β
β
β
β
β
+ + + + + + + + + + = ) log( ) log( ) log( ) log( ) log( log ) log( 7 6 5 3 2 1 0where ED stands for economic distance between each country and the EU-15 average. As in this case we are considering trade between each of the EU15 and each of the CEEC with the EU as a whole, GDPi represent the GDP of each country and GDPeu
represent the GDP of the EU-157.
In the previous equation ai represents the country specific effect that is considered to be constant along the years and
ε
ieut is the remainder stochastic disturbance term.γ
t represents several time dummies to take into account possible cycle effects.Helpman and Krugman (1985) model suggests that IIT is positively correlated with countries similarity (measure by the difference in GDP per capita) and the level of GDP of each country and negatively correlated with distance. Therefore we expect
β
1 and4
β to be negative and β2 and
β
3 to be positive. EU participation may as well havesignificant effect on the share of IIT even though it is not clear if it should be positive or negative. Falvey (1981) claims that trade liberalisation as a positive effect on vertical IIT. On the other hand, Krugman (1993) argues that in a free trade area countries may specialise more according to their comparative advantages and therefore its effect in vertical IIT should be negative. Moreover, as the effect of distance might be different for EU member states and countries outside EU, as Fidrmuc and Djablik (2003) points out, we also estimate an alternative specification allowing for that difference.
According to the majority of previous studies, foreign direct investment (FDI) is expected to have a positive effect, both on vertical and horizontal IIT. As for HDI, this index intends to measure countries´ development, taking into consideration several specific factors (like life expectancy, level of education, poverty measures, and so on). We include this variable as a proxy of the standard of living of the countries, which is expected to be positively correlated with IIT and especially with horizontal IIT. In fact, according to economic theory high levels of economic development leads to an increasing demand for variety.
7
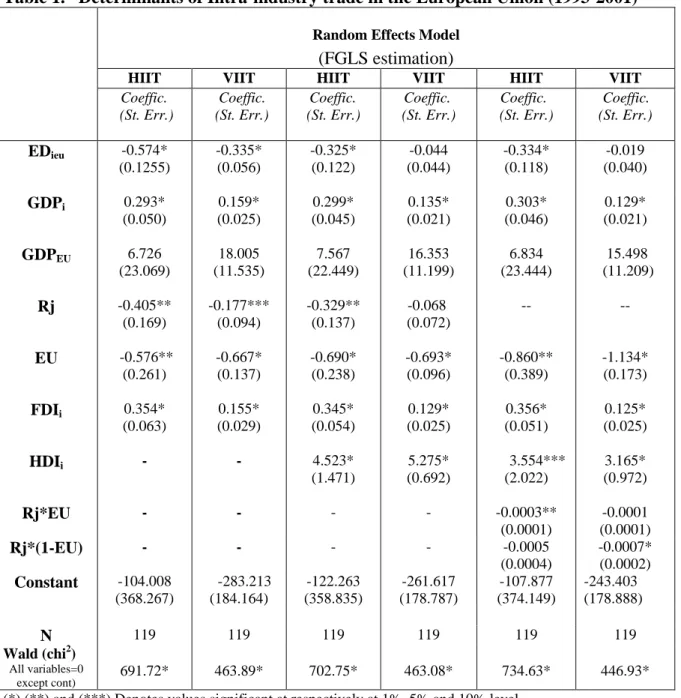
Table 1. Determinants of Intra-industry trade in the European Union (1993-2001)
Random Effects Model (FGLS estimation)
HIIT VIIT HIIT VIIT HIIT VIIT
Coeffic. (St. Err.) Coeffic. (St. Err.) Coeffic. (St. Err.) Coeffic. (St. Err.) Coeffic. (St. Err.) Coeffic. (St. Err.) EDieu -0.574* (0.1255) -0.335* (0.056) -0.325* (0.122) -0.044 (0.044) -0.334* (0.118) -0.019 (0.040) GDPi 0.293* (0.050) 0.159* (0.025) 0.299* (0.045) 0.135* (0.021) 0.303* (0.046) 0.129* (0.021) GDPEU 6.726 (23.069) 18.005 (11.535) 7.567 (22.449) 16.353 (11.199) 6.834 (23.444) 15.498 (11.209) Rj -0.405** (0.169) -0.177*** (0.094) -0.329** (0.137) -0.068 (0.072) -- -- EU -0.576** (0.261) -0.667* (0.137) -0.690* (0.238) -0.693* (0.096) -0.860** (0.389) -1.134* (0.173) FDIi 0.354* (0.063) 0.155* (0.029) 0.345* (0.054) 0.129* (0.025) 0.356* (0.051) 0.125* (0.025) HDIi - - 4.523* (1.471) 5.275* (0.692) 3.554*** (2.022) 3.165* (0.972) Rj*EU - - - - -0.0003** (0.0001) -0.0001 (0.0001) Rj*(1-EU) - - - - -0.0005 (0.0004) -0.0007* (0.0002) Constant -104.008 (368.267) -283.213 (184.164) -122.263 (358.835) -261.617 (178.787) -107.877 (374.149) -243.403 (178.888) N 119 119 119 119 119 119 Wald (chi2) All variables=0 except cont) 691.72* 463.89* 702.75* 463.08* 734.63* 446.93*
(*) (**) and (***) Denotes values significant at respectively at 1%, 5% and 10% level Time dummies were included but not reported.
Equation (A) can be estimated considering a fixed-effects model or a random effects model. If the individual effects (ai) are correlated with the explanatory variables, a fixed-effects model should be adopted, if there is no correlation then we have a random effects model. Hausman tests lead us to conclude that the random effects model is more appropriated. Also, we performed tests for heterocedasticity and reject the hypothesis of homoscedasticity. Therefore, the model was estimated by Feasible GLS, correcting for heteroscedasticity to obtain consistent and efficient estimators. All the estimations can be seen in table 1.
For several variables the estimates are very stable for the different specifications, like GDPEU, GDP and FDI. As expected, the last two variables both have positive and
significant effects on both types of trade. On the contrary, the GDP of EU, although positive it is never significant, which is in accordance with the results of Fidrmuc and Djablik (2003).
As for economic distance between each country and the EU as a whole the results are stable for horizontal IIT but not for vertical IIT. This variable is negatively correlated with IIT, which is according to theory, but for vertical IIT it is only significant for the first specification. In fact, when we include the index of human development economic distance is no longer significant.
Referring to the human capital index it seems that it is more significant for vertical intra-industry trade, but it is positively correlated with both vertical and horizontal IIT. This may indicate that the country’s standard of living is an important determinant, which is according to what was expected.
It is particularly of interest to analyse the results for EU integration and geographical distance, which may be considered as proxies for trade barriers and trade costs. In the first two specifications, EU is negative and significant, although with more evidence for vertical IIT. As for distance the results differ for the two types of IIT. While distance is negative and significant for horizontal IIT does not seem too much significant for vertical IIT. The results for horizontal IIT are therefore more according to Krugman (1993) hypothesis.
In the last specification we consider the possible differences on the effect of geographical distance for EU members and no members. Indeed the results are different for the two types of trade. For Horizontal IIT, distance is only significant for EU members. On the contrary, for vertical IIT distance is mainly important for EU no-members. This means that vertically IIT is mainly a phenomenon related to CEEC-EU trade relations and not to intra-EU relations.
V. Final Remarks
The sectoral pattern of comparative advantages in CEEC-EU trade has undergone profound changes in its intensity and nature, and we may conclude that there are indications of improvement in the economic performance of the new EU member states. Among these indications, we emphasize the expansion of IIT, especially of vertical nature, the emergence of trade flows in similar goods and the progresses in the price-quality range of exports. Nevertheless, despite these changes, there is the persistence of some structural aspects that cause concerns. In fact, there are still important differences between the export prices in CEEC and of intra-EU trade, reflecting the international division of labour in goods of different quality.
Therefore, the increase of VIIT, coincides with the reinforcement of the specialisation pattern of CEEC in trade of low quality goods, although it seems that Hungary, Czech Republic and Slovenia display by now a distinct pattern. There is, consequently, heterogeneity at the country level, suggesting that geographic proximity to the EU and income convergence stimulated product differentiation and the trade of R&D and capital intensive goods. In fact, according to our results, country size (measured by GDP) and income per capita differences are important factors for IIT and especially for horizontal IIT between CEEC and EU. Geographic distance seems to be also an significant determinant, with more evidence for horizontal IIT.
Consequently, the pattern of specialisation in CEEC-EU trade still reflects the strong factor complementarity between the two groups. Indeed, in the CEEC there is a high intensity in low skilled labour and present a high share of capital goods and specialized equipments in their imports. In the old EU members technological processes are intensive in physical and human capital.
On the essence of this structural tendency is FDI, as previous literature and our results highlight. In fact, the strategies of multinational corporations, through intra-firm trade and sub-contracting activities, stimulated segmentation of the productive process in human capital and labour intensive activities, by exploring differences in labour costs.
In this context, the Iberian countries, with similar trade patterns to the CEEC, may experience some negative impacts due to industrial delocalisation. Most of the new EU member states are poorer than Portugal, Spain and Greece were when these countries entered the EEC. However, the CEEC are already more integrated with the EU than those countries were at that time. Given that most trade adjustments have already occurred, and that almost all barriers have been dismantled, the impacts of enlargement on trade should not have generalised effects. Therefore, higher or lower competitive difficulties for some sectors and/or countries will result from internal adjustment dynamics in both transition economies and current EU members.
References
Abd-el-Rahman, K. (1991) “Firms’ Competitive and National Comparative Advantages as Joint Determinants of Trade Composition.”, Weltwirtschaftliches Archiv, 127: 83-97. Abd-El-Rahman, K. (1986) “Réexamen de la définition et de la mesure des échanges croisés de produits similaires entre les nation”, Revue Économique, 1:89-115.
Aturupane, C., Djankov, S. and Hoeckman, B. (1999) “Horizontal and vertical intra-industry trade between Eastern Europe and the European Union”, Weltwirtschfliches Archiv, 135 (1): 62-81.
Boeri, T. and Brucker, H. (2000) “The impact of Eastern enlargement on Employment and Labour Markets in the EU Member States - Final Report”, European Commission.
Caetano, J., Galego, A., Vaz, E., Vieira, C. and Vieira, I. (2002) “The eastward enlargement of the Eurozone: trade and FDI”, Ezoneplus Working Paper 7, Berlin.
Damijan, J., Majcen, B., Rojec, M. and Knell, M. (2001) “The role of FDI, R&D accumulation and trade in transferring technology to transition countries: Evidence from firms panel data for eight transition countries”, Working Paper 10, University of Ljubljana.
European Commission (2004) “Third report on economic and social cohesion”, Brussels, http://europa.eu.int/comm/eurostat/ (accessed in 17/07/2005).
Falvey, R. (1981) “Commercial policy and intra-industry trade”, Journal of International Economics, 11:495-511.
Falvey, R. E. and H. Kierkowski (1987) “Product Quality, Intra-Industry trade and (im)perfect Competition,” in H. Kierkowski, (ed.) Protection and Competition in International Trade, Basil Blackwell, New York, pp.143-161.
Fidrmuc, J. and Djablík, M. (2003) “Intraindustry trade between the EU and the CEEC´s – The importance of FDI in trade structure”, East-West Conference, November 2-4, Vienna.
Flam, H. and E. Helpman, 1987, Vertical Product Differentiation and North-South Trade, American Economic Review 77, 810-822.
Fontagné, L. e Freudenberg, M. (1997) « Intra-industry trade: methodological issues reconsidered”, CEPII Working Paper 1.
Freudenberg, M. and Lemoine, F. (1999) “Central and Eastern European Countries in the international division of labour in Europe”, CEPII Working Paper 5.
Freudenberg, M. and Muller, F. (1991) La structure du commerce extérieur de la RFA et de la France en 1989: une analyse empirique de la structure du commerce et gammes échangées, Université de Paris I Panthéon-Sorbonne.
Fukao, K., Ishido, H. and Ito, K. (2003) “Vertical intra-industry trade and foreign direct investment in East Asia”, Journal of the Japanese and International Economies, 17 (4): 468-506.
Gabrisch, H. and Segnana, M. (2003) “Vertical and horizontal patterns of intra-industry trade between EU and candidate countries”, Final Report of the project “EU Integration
and the Prospects for Catch-Up Development in CEECs. The Determinants of the Productivity Gap”, IWH: Halle (Saale).
Greenway, D., Hine, R. C. and Milner, C. (1994) “Country specific Factors and the Pattern of Horizontal and Vertical Intra-Industry Trade in the U.K.”, Weltwirtschaftliches Archiv, 130 (1):77-100.
Greenway, D. and C. Milner (1986) The Economics of Intra-Industry Trade, Blackwell: Oxford.
Grubel, H. and Lloyd, P. (1975) Intra-industry Trade: the theory and measurement of international trade in differentiated products, McMillan: London.
Helpman, E. (1987) “Imperfect competition and international trade: evidence from fourteen industrial countries”, Journal of the Japanese and International Economies, 1:62-81.
Helpman, E. and Krugman, P. (1985) Market structure and foreign trade, Massachusetts Institute of Technology Press: Cambridge.
Hoekman, B. e Djankov, S. (1996) “Intra-industry trade, foreign direct investment and the reorientation of Eastern European exports”, CEPR Working Paper 1377.
Hummels, D. and Levinsohn, J. (1995) “Monopolistic competition and international trade: reconsidering the evidence”, Quarterly Journal of Economics, 110:799-836.
Kaminski, B. (2001) “How accession to the European Union has affected external trade and foreign direct investment in Central European economies”, World Bank Working Paper 2578.
Krugman, P. (1993) “The current case for industrial policy” in D. Salvatore (ed.) Protectionism and World Welfare, Cambridge University Press: Cambridge.
Krugman, P. (1981) “Intraindustry specialization and the gains from trade”, Journal of Political Economy, 89 (5).
Menon J. and Dixon P. (1997) “Intraindustry versus. Interindustry Trade: Relevance for Adjustment Costs”, Weltwirtshaftliches Archiv , 133 (1):164-69.
Appendix I – Methodology
I.A. Intra-Industry Trade Index (IIT)
Grubel and Lloyd (1975) index, measures the degree of trade overlap in a given product:
(
)
(
)
∑
(
)
∑
∑
∑
+ − − = + + = K k i k i K k i k i k k k i k i k i k i k i M X M X 1 M X M X * GL GLI.B. Types of Trade
Abd-El-Rahman (1986) developed a methodology that distinguishes between two-way trade in similar products; two-way trade in vertically differentiated products and one-way trade. The concept of product is related to its technical characteristics, which may be captured using disaggregated data. Similarity depends on the product unit value, assuming that differences in prices reflect differences in quality. To differentiate IIT with vertical product differentiation from IIT with horizontal product differentiation, the author employs the following reasoning (Fontagné and Freudenberg ,1997):
(
)
(
)
(
k)
i k i k i k i k i k i k i k i k i k i i M X M X M X M X M X GL + − − = + − − + = 1How to define bilateral trade types at product level?
Degree of Overlap between Export and Import values
Similarity of Export and Import Unit Values:
Do export and import unit values differ less than 15% Does the minority flow
represent at least 10% of the majority flow?
Yes
(Horizontal differentiation)
No
(Vertical differentiation)
Yes Two-way trade in similar
products
Two-way trade in vertically differentiated products
No One-way trade
Appendix II -Variables definition and data sources
EDieu- Economic Distance measured by the absolute value of the difference between the
real GDP per capita, between each country and EU.
GDPi- GDP of country i (constant prices)
GDPEU – GDP of EU (constant prices)
Source: Chelem data base HDIi – human development index
Source : United Nations
FDIi – stock of inward foreign direct investment/GDP in country i
Source: FDI- UNCTAD GDP – Chelem data Base Rj – weighted-average distance to other countries
Appendix III - Tables
Table III.A: Horizontal and Vertical IIT and Grubel-Lloyd Index
1993 2001 Variation (1993-2001)
Countries HIIT VIIT GL* HIIT VIIT GL* HIIT VIIT GL*
Áustria 23,6 51,0 47,2 18,6 59,8 51,6 -5,0 8,9 4,4 Bel-Lux 41,7 47,3 58,0 36,1 50,6 64,7 -5,6 3,3 6,7 Bulgaria 2,0 19,5 13,8 2,5 26,5 17,8 0,6 7,0 4,0 Czech Rep. 5,4 49,6 34,2 15,3 61,2 49,2 9,9 11,6 15,1 Denmark 12,7 52,2 40,5 20,0 52,7 47,1 7,3 0,5 6,5 Estonia 0,4 6,5 3,5 17,1 37,0 27,0 16,7 30,5 23,5 Finland 8,4 32,1 24,2 12,7 41,8 33,6 4,3 9,7 9,3 Germany 32,1 60,4 64,6 29,9 60,5 67,6 -2,3 0,1 3,0 France 44,9 47,1 67,5 35,7 52,8 64,3 -9,2 5,7 -3,2 Greece 4,2 15,3 12,9 6,6 21,3 16,3 2,3 6,0 3,4 Hungary 7,2 40,8 28,2 11,9 52,3 36,8 4,7 11,5 8,5 Ireland 12,1 44,5 36,1 5,9 47,4 30,7 -6,1 2,9 -5,4 Italy 15,1 58,0 45,6 16,6 64,1 49,0 1,4 6,0 3,4 Latvia 0,1 6,8 3,3 2,0 12,5 8,7 1,9 5,7 5,4 Lithuania 0,2 6,3 5,3 0,8 18,7 11,2 0,6 12,5 5,8 Netherlands 39,2 50,9 60,6 34,8 54,5 57,1 -4,4 3,7 -3,4 Poland 2,5 26,7 18,5 8,1 46,4 32,5 5,5 19,7 14,0 Portugal 9,0 33,9 24,4 12,9 42,1 31,8 3,9 8,2 7,4 Romania 1,5 13,9 10,0 3,4 30,1 21,7 1,9 16,2 11,7 Slovakia 3,2 25,7 17,3 6,9 45,4 29,5 3,8 19,7 12,2 Slovenia 6,2 40,0 27,0 13,9 47,9 35,2 7,7 7,9 8,2 Spain 22,4 50,7 44,4 36,2 46,0 57,8 13,8 -4,7 13,4 Sweden 17,2 50,6 41,7 24,1 49,3 48,5 6,8 -1,2 6,8 U. Kingdom 23,0 66,4 62,6 22,1 62,3 60,3 -0,9 -4,1 -2,3 EU-15 21,8 47,2 45,0 22,3 50,4 48,6 0,5 3,2 3,6 CEEC-10 2,9 23,6 16,1 8,2 37,8 27,0 5,3 14,2 10,8 EU-25 13,9 37,3 33,0 16,4 45,1 39,6 2,5 7,8 6,6
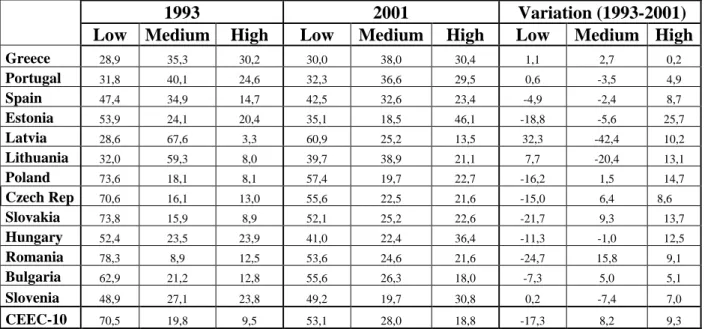
Table III.B: Exports to EU by price-quality ranges
1993 2001 Variation (1993-2001)
Low Medium High Low Medium High Low Medium High
Greece 28,9 35,3 30,2 30,0 38,0 30,4 1,1 2,7 0,2 Portugal 31,8 40,1 24,6 32,3 36,6 29,5 0,6 -3,5 4,9 Spain 47,4 34,9 14,7 42,5 32,6 23,4 -4,9 -2,4 8,7 Estonia 53,9 24,1 20,4 35,1 18,5 46,1 -18,8 -5,6 25,7 Latvia 28,6 67,6 3,3 60,9 25,2 13,5 32,3 -42,4 10,2 Lithuania 32,0 59,3 8,0 39,7 38,9 21,1 7,7 -20,4 13,1 Poland 73,6 18,1 8,1 57,4 19,7 22,7 -16,2 1,5 14,7 Czech Rep 70,6 16,1 13,0 55,6 22,5 21,6 -15,0 6,4 8,6 Slovakia 73,8 15,9 8,9 52,1 25,2 22,6 -21,7 9,3 13,7 Hungary 52,4 23,5 23,9 41,0 22,4 36,4 -11,3 -1,0 12,5 Romania 78,3 8,9 12,5 53,6 24,6 21,6 -24,7 15,8 9,1 Bulgaria 62,9 21,2 12,8 55,6 26,3 18,0 -7,3 5,0 5,1 Slovenia 48,9 27,1 23,8 49,2 19,7 30,8 0,2 -7,4 7,0 CEEC-10 70,5 19,8 9,5 53,1 28,0 18,8 -17,3 8,2 9,3
Imports from EU by price-quality ranges
1993 2001 Variation (1993-2001)
Low Medium High Low Medium High Low Medium High
Greece 18,8 43,0 35,3 25,0 35,6 36,2 6,2 -7,4 1,0 Portugal 20,6 52,5 24,4 28,3 49,7 20,6 7,7 -2,8 -3,8 Spain 14,9 61,8 20,7 21,2 57,3 19,6 6,3 -4,5 -1,1 Estonia 55,3 14,0 28,5 35,7 27,0 36,9 -19,7 13,0 8,4 Latvia 51,3 16,1 30,8 38,9 25,1 35,5 -12,5 9,1 4,7 Lithuania 50,2 20,7 27,3 38,2 26,2 35,1 -12,0 5,5 7,8 Poland 41,2 29,0 29,8 38,8 34,8 25,8 -2,3 5,8 -3,9 Czech Rep 29,5 28,2 41,8 30,9 38,1 30,5 1,4 9,9 -11,3 Slovakia 33,2 22,1 42,6 31,5 35,4 32,8 -1,7 13,3 -9,8 Hungary 39,4 23,7 36,6 31,0 34,0 34,3 -8,3 10,3 -2,3 Romania 43,9 19,3 36,2 49,1 23,6 27,2 5,2 4,2 -9,0 Bulgaria 44,4 19,9 34,6 46,7 21,4 31,5 2,4 1,5 -3,1 Slovenia 32,2 32,5 34,7 37,1 30,3 32,3 4,9 -2,2 -2,4 CEEC-10 41,6 30,6 27,6 38,6 38,0 23,0 -3,0 7,5 -4,5