—
2c02 _ kA2-4 — )604C— .7w,0,00.P1.10
Waste Management 2002
Posters
The effect on the GHG emissions of MSW management practices based on EU legislation targets — a municipal case study
Susana Xara" 1.2, Manuel Fonseca Almeida l , Margarida Silva2, Carlos Costal
1 LEPAE - Laboratbrio de Engenharia de Processos, Ambiente e Energia Faculdade de Engenharia da Universidade do Porto
Rua Dr. Roberto Fries, 4200-465 Porto, Portugal
2Escola Superior de Biotecnologia - Unlversidade CatOlica Portuguesa Rua Dr. Antônio Bernardino de Almeida, 4200-072 Porto, Portugal
*email: sxarapesb.uco.pt
This paper presents a case study developed for a portuguese municipality with the objective of evaluating the influence of the European legislation on municipal solid waste management practices in the greenhouse gas emissions.
Two situations were compared: the first one concerns the situation in 1990 where the MSW was collected, composted and residual waste was landfilled. On the second situation the EU legislation on recycling targets for packaging material and diversion of organic waste from landfills and the inclusion of a mass-burn incineration plant on the management system were taken into account. Greenhouse gas emissions from these two situations were calculated based on a model developed by White et al (1992). Weighting factors for the different gases based on the recommendations of the Intergovernmental Panel on Climate Change were used to aggregate the values calculated from emissions and obtain a simple and comparable result for each situation.
1. Introduction
In developed countries, waste management is governed by legislation. The European Commission recognizes the need of selecting management options taking into account the possible risks to human health and the environment (1). Based on the general legal framework, the community policy on waste is supplemented by a number of more specific directives that may be divided into two groups: (i) directives aimed at reducing the impact of treatment and disposal by setting common technical standards for operation of treatment facilities as the directive on incineration (2000/76/EC) and the landfill directive (99/31/EC); and, (ii) directives on specific waste streams covering both measures of prevention and common rules for separate collection and treatment, in particular the packaging and packaging waste directive (94/62/EC), among others (2).
The landfill directive states that biodegradable municipal solid waste landfilling must be reduced to 75% by 2006 (compared to 1995 levels), dropping to 50% by 2009 and
r Waste Management 2002
P1 10
Posters
.
35% by 2016. Member states that landfill over 80% of their MSW may postpone these
1
targets by a period not exceeding 4 years (3). One of the waste streams that the
European Union gives special attention is packaging. The packaging directive
includes measures aimed at preventing waste generation and increasing the recovery
and recycling of packaging waste. This directive sets three targets. Target 1 requires
Member States to reach a recovery level between 50% and 65% by weight of all
packaging wastes. Recovery covers all kinds of recycling, energy recovery and
composting. For achieving Target 2, Member States must reach a recycling level of
between
25% as a minimum and 45% as a maximum by weight of all packagingwaste. The obligation for Target 3 is reaching a minimum recycling level of 15% on
specific packaging waste materials (4). This legislation resulted in many changes on
the waste management practices in Europe and obviously also in Portugal.
The present case study was developed for the municipality of Porto, the second
largest city of Portugal located in the north of the country on the western coast. In
Portugal, the MSW management is commited to municipalities in some cases
organized in multimunicipal associations for that purpose. MSW generated at the city
of Porto is collected by the municipal services also responsible for its transport to the
treatment units from LIPOR, a company participated by 8 municipalities of Porto
region. Due
tolegislative evolution, some changes have been implemented on MSW
management practices since 1990. This study presents MSW production and
management practices, namelly collection systems and treatment units description,
both on 1990 and 2000. The environmental impact from the management of MSW
collected during 1 year, respectively in 1990 and 2000, is • compared in terms of
energy consumption and greenhouse gases emissions. This evaluation is done in two
steps; first, the model developed by White et al from Procter and Gamble (5) was
used to quantify energy and emissions of carbon dioxide, methane and nitrous oxide,
all gases with greenhouse effect; next, the greenhouse gases emissions were
aggregated using the Global Warming Potentials (GWP) proposed by the
Intergovernmental Panel on Climate Change (6). This aggregation leads to a single
value for the GWP of each situation analyzed, allowing its comparison.
2.
MSW production and management in Porto on 1990 and 2000On 1990, Porto had 302 500 inhabitants and the mean MSW production was 383
kg/person.year. On that time MSW was collected 6 times a week from kerbside where
people put the plastic bags with mixed waste or alternatively on containers near
home. The total amount collected by this way accounted for about 115 000 tons on
that year. There were also 364 glass banks spreaded on the city where people could
bring used glass bottles later transported to a recycling unit. On 1990 collected glass
amounted for 1 050 ton. The treatment methods available on 1990 include
composting, landfilling and recycling the glass. About 70% of the mixed waste
collected was composted and 30% directly landfilled. For calculation purposes, it was
assumed that the fuel consumption on the collection operations was 30 U1000
properties served and that the landfill site was similar to a dump, with neither gas
collection nor lined. The fuel consumption for waste spreading operations was
considered 0.6 Uton of waste. Despite its poor quality all the compost produced at
the composting unit was marketed and the residual waste from sorting operations
was placed on the landfill located 100 m from the composting unit.
On 2000 the situation was quite different from that on 1990, since the inhabitants
were 280 000 and MSW production was on average 518 kg/person.year. The
1990 2000 Waste component
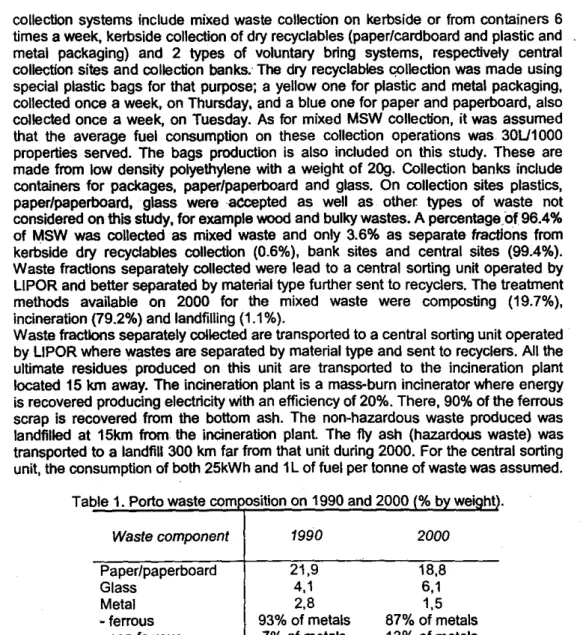
times a week, kerbside collection of dry recyclables (paper/cardboard and plastic and metal packaging) and 2 types of voluntary bring systems, respectively central collection sites and collection banks. The dry recyclables collection was made using special plastic bags for that purpose; a yellow one for plastic and metal packaging, collected once a week, on Thursday, and a blue one for paper and paperboard, also collected once a week, on Tuesday As for mixed MSW collection, it was assumed that the average fuel consumption on these collection operations was 30L11000 properties served. The bags production is also included on this study. These are made from low density polyethylene with a weight of 20g. Collection banks include containers for packages, paper/paperboard and glass. On collection sites plastics, paper/paperboard, glass were accepted as well as other types of waste not considered on this study, for example wood and bulky wastes. A percentage of 96.4% of MSW was collected as mixed waste and only 3.6% as separate fractions from kerbside dry recyclables collection (0.6%), bank sites and central sites (99.4%). Waste fractions separately collected were lead to a central sorting unit operated by LIPOR and better separated by material type further sent to recyclers. The treatment methods available on 2000 for the mixed waste were composting (19.7%), incineration (79.2%) and landfilling (1.1%).
Waste fractions separately collected are transported to a central sorting unit operated by LIPOR where wastes are separated by material type and sent to recyclers. All the ultimate residues produced on this unit are transported to the incineration plant located 15 km away. The incineration plant is a mass-burn incinerator where energy is recovered producing electricity with an efficiency of 20%. There, 90% of the ferrous scrap is recovered from the bottom ash. The non-hazardous waste produced was landfilled at 15km from the incineration plant The fly ash (hazardous waste) was transported to a landfill 300 km far from that unit during 2000. For the central sorting unit, the consumption of both 25kWh and 1L of fuel per tonne of waste was assumed.
Table 1. Porto waste com•osition on 1990 and 2000 % b we ht
21,9 4,1 2,8 93% of metals 7% of metals 8,5 66% of plastics 34% of plastics 3,9 35,6 23,3 18,8 6,1 1,5 87% of metals 13% of metals 12,0 68% of plastics 32% of plastics 2,9 36,8 21,9
The landfill gas was collected with an efficiency of 40% and burned without energy recovery; 70% of the leachate is collected and treated accordingly. The environmental impact from that treatment is not accounted on this study. The diesel consumption for waste spreading operations was considered 0,6L/ton of waste. All the ferrous metals on the waste stream feeding the composting unit were recovered
193 Paper/paperboard Glass Metal - ferrous - non ferrous Plastic - film - rigid Textiles Organics Others
V DI
Waste Management 2002
PostersP1.10
and the compost produced was marketable. The ultimate wastes from the composting unit were incinerated at the incineration plant 15 km away from the composting plant. The waste composition in Porto had changed between 1990 and 2000. The values considered on this study are presented on Table 1 and were obtained from waste characterization procedures carried out by LIPOR (7, 8).
3.
Results and discussion
The results of energy consumption and emissions of carbon dioxide, methane and nitrous oxide, for both the 1990 and 2000 scenarios, are summarized on Table 2. The emissions of the greenhouse gases were aggregated using the Global Warming Potentials weighting factors according to the recommendations of the Intergovernmental Panel on Climate Change (6): 1 for carbon dioxide, 21 for methane and 310 for nitrous oxide. The results obtained are also presented on Table 2.
The energy consumption for 2000 is negative due to the electrical energy recovered at the incineration process. This is a large advantage of the management system used on 2000, contrary to the 1990 one that consumes energy.
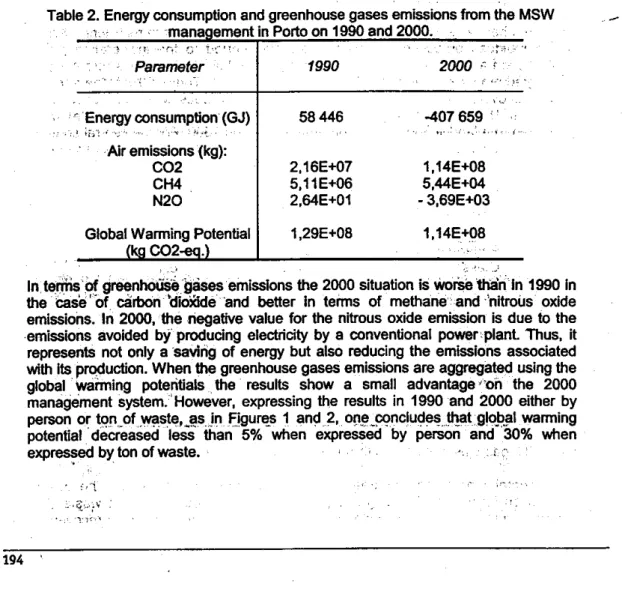
Table 2. Energy consumption and greenhouse gases emissions from the MSW mana ement in Porto on 1990 and 2000.
Parameter
1990
2000
Air emissions (kg):
CO2 2,16E+07 1,14E+08 CH4 5,11E+06 5,44E+04 N20 2,64E+01 - 3,69E+03 Global Waning Potential 1,29E+08 1,14E+08
CO2
In terms of greenhoike gases emissions the 2000 situation is worse than In 1990 In the case t ef carbon
"
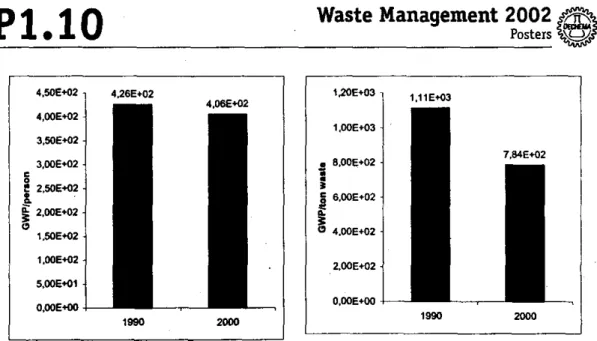
dioxide and better in terms of methane and nitrous oxide emissions. In 2000, the negative value for the nitrous oxide emission is due to the emissions avoided by producing electricity by a conventional power. plant. Thus, it represents not only a saving of energy but also reducing the emissions associated with Its production. When the greenhouse gases emissions are aggregated using the global warming potentials the results show a small advantage '"on the 2000 management system. 'However, expressing the results in 1990 and 2000 either by person or ton of , waste, as in Figures 1 and 2, one concludes that global warming potential decreased less than 5% when expressed by person and 30% when expressed by ton of waste.4,50E+02 4,26E+02 4,00E+02 3,50E+02 4,06E+02 3,00E+02 g 2,50E+02 a: 2,00E+02 1.50E402 1,00E+02 5,00E+01 0,00E+00 1990 2000
P1.10
Waste Management 2002
Posters 1,20E+03 1,11E+03 1,00E+03 7 8,00E+02 7,84E+02 ; 6,00E+02 0 4.00E+02 2,00E+02 0,00E+00 1990 2000Figure 1. Annual contribution to GWP by Figure 2. Annual contribution to GWP by ton person from waste management practices in of waste from waste management practices Porto on 1990 and 2000. in Porto on 1990 and 2000
Conclusions
Some changes on MSW management practices have been implemented in the municipality of Porto from 1990 to 2000 both in terms of collection systems and technologies of treatment In terms of collection, the situation changed from mixed waste collection plus voluntary bring systems for glass to more participated solutions as kerbside collection of dry recyclables on special plastic bags twice a week, collection banks and central collection sites. Conceming the treatment methods available, the main changes include a central sorting unit and an incineration plant The energy consumption and emissions of gases with greenhouse effect for both those years were computed using an existing inventory model.
As far as energy consumption is concerned, the results obtained show a clear advantage of the 2000 management system due to the energy recovered at the incineration plant.
For the global warming potential, results also show a clear advantage for 2000, particularly when GWP values are expressed either by person or by ton of waste, due to the decrease verified on the inhabitants of. the city and the increase on the waste amount produced per person.
References
European Commission, Directorate-General Environment, Nuclear Safety and Civil Protection (2000) "EU focus on waste management", Office for Official Publications of the European Communities, Luxembourg.
Fisher C. (1999) "Waste in The EU at the Turn of the Century", European Topic
Centre on Waste, Copenhagen. •
3. European Communities (1999) "1999/31/EC, EC Landfill Directive", Official Joumal of the European Communities.
VDI
Waste Management 2002
PostersP1.10
EEA (2000) "Environmental signals 2000", European Environment Agency, Copenhagen. •
White et al (1995) integrated Solid Waste Management: A life cycle inventory, Blaclde MP, Glasgow, U.K
IPCC (1996) "Guidelines for National Greenhouse Gas Inventories", volume 3, Intergovernmental Panel for Climate Changes.
LIPOR (2000) "Cademos Tècnicos Lipor n° 1 — A caracterizacao dos residuos sOlidos".
8. Informations obtained from personal contacts with LIPOR. 6. Acknowledgements
This work was only possible with the contribution of FCT — Fundacto pars a Ciéncia e a Tecnologia, research project POCTI/1999/CTA/35616, LIPOR: Eng. Susana Lopes and Eng. Nuno Samos and of the Environmental Division of Porto Municipality: Eng Goreti and Mr. Helder Calado.