i
Qlik Sense Implementation
Juan Manuel López Mora
Dashboard creation and implementation of the test
performance Methodology
Internship report presented as partial requirement for
obtaining the Master’s degree in Information Management
ii
NOVA Information Management School
Instituto Superior de Estatística e Gestão de Informação
Universidade Nova de LisboaQLIIK SENSE IMPLEMENTATION
Dashboard creation and implementation of the test performance Methodology
Juan Manuel Lopez Mora
Internship Report presented as the partial requirement for obtaining a Master's degree in Information Management, Specialization in Knowledge Management and Business Intelligence Advisor / Co‐supervisor: Miguel de Castro Simões Ferreira NetoMay 2020
iii
ABSTRACT
Strategy, Decision, and Governance SDG Group is a multinational company found in Italy in 1991, with offices in Portugal, it has experienced a high and consistent growth based on the performance and quality of their projects, that tailor the client necessities. It has been award as Qlik partner of the year for Europe in the last four years.
The project has two parts the first one is to create a Sales Datamart for the managers of the EMEA Region of a Pharmaceutical company. The dashboard is a web application that uses content from Qlik Business Intelligence Software and displays it in a graphical web interface.
The second part of the internship is the creation and implementation of the Sense Test Performance Methodology, Qlik is a software that runs in memory, and the performance is profoundly affected if proper practices are not applied. In SDG, most experience consultants applied the practices, but knowledge dissemination is reduced to the teams that work together.
The twenty-five consultants that the company has in Lisbon would be involved in the development of the Qlik Sense Test Performance Methodology. Also, a report delivers to the client with the resultant performance of the dashboard.
KEYWORDS
iv
INDEX
1.
Introduction ... 1
1.1. Company Description ... 2
1.2. Problem Definition and Motivation ... 2
1.3. Role in the Project ... 2
1.4. Study Goals ... 3
2.
Literature review ... 4
2.1. Business Intelligence Software ... 4
2.2. Data Warehouse ... 5
2.3. Data mart ... 7
2.4. Schemas ... 7
2.5. Dashboard ... 8
2.5.1.
KPI ... 8
2.5.2.
Types of Performance Dashboards ... 9
2.5.3.
Design of the Dashboard ... 10
2.6. Change Management ... 10
2.7. Memory Performance ... 11
3.
PROJECT METHODOLOGY ... 12
3.1. Schedule ... 13
3.1.1.
Kick OFF ... 13
3.1.2.
Qlik Training ... 13
3.1.3.
Web Dashboard ... 14
3.1.4.
Qlik Test Performance Methodology ... 14
3.1.5.
Deliver the project ... 14
4.
WEB DASHBOARd ... 15
4.1. Architecture for the projects and folder Structure ... 15
4.1.1.
Extraction... 16
4.1.2.
Transform ... 17
4.1.3.
Load ... 17
v
4.2. The Data Model ... 19
4.2.1.
Facts Data ... 20
4.2.2.
Master Data ... 20
4.3. Application ... 21
4.3.1.
KPI ... 23
4.3.2.
Dashboard ... 24
4.3.3.
Geography ... 24
4.3.4.
Therapeutic Area ... 25
4.4. Test ... 26
5.
QLIK TEST Performance Methodology ... 28
5.1. Design of the Methodology ... 28
5.1.1.
Excel Checklist ... 29
5.1.2.
Document Analyzer ... 30
5.1.3.
Scalability Tools ... 31
5.1.4.
Application Performance Presentation ... 32
5.1.5.
Results in an example App ... 33
5.1.6.
Flags ... 33
5.1.7.
Improvements ... 33
5.1.8.
Qlik Sense Performance Methodology Conclusion ... 34
6.
Conclusions ... 36
7.
Limitations and recommendations for future works ... 37
8.
Bibliografia ... 38
Appendix A ... 40
QLIK SENSE Terminology ... 40
Qlik View Data QVD. ... 40
Set Analysis. ... 40
Synthetic Keys in the Data Model ... 40
A.1.4 Link Tables in the Data Model ... 41
A.1.5 Concatenate or No Concatenate in the Data Model ... 41
Appendix B ... 42
Qlik Main Functions ... 42
Mappings ... 42
Hierarchy ... 42
Join 42
Appendix C ... 44
vi
The Qlik Server ... 44
Qlik Management Console ... 44
The Hub ... 45
AppendiX D ... 47
The Memory Load In Qlik ... 47
Symbol Table ... 47
Data Tables ... 47
APPENDIX E ... 48
vii
LIST OF FIGURES
Figure 2.1 – Garner Quadrant, Source (Gartner, 2018). ... 5
Figure 2.2 – Immon DW model, Source (Panoply, 2019). ... 6
Figure 2.3 – Kimball, Source (Panoply, 2019) ... 7
Figure 2.4 – Types of Dashboard, Source (Eckerson,2009) ... 9
Figure 2.5 - Change Management Steps Source (Kotter, 2012) ... 11
Figure 3.1 - SCRUM, SOURCE (Sliger, 2011) ... 13
Figure 3.2 - Project Schedule ... 13
Figure 4.1 – Data Architecture ... 16
Figure 4.2 - Folder Organization ... 16
Figure 4.3 - Metadata Table ... 18
Figure 4.4 - Data Model ... 20
Figure 4.5 - Granularity ... 21
Figure 4.6 - Landing Page ... 22
Figure 4.7 - Horizontal Menu ... 22
Figure 4.8 - Vertical Menu ... 23
Figure 4.9 - KPI example ... 24
Figure 4.10 - Geography Dashboard ... 25
Figure 4.11 - Therapeutic area ... 26
Figure 4.12 Data Robot Log ... 27
Figure 5.1 - Check List Panel ... 29
Figure 5.2 - Document Analyzer ... 30
Figure 5.3 - Optimized variables... 31
Figure A.1 - Synthetic Keys ... 41
Figure C.1 - Qlik Server QMC. ... 45
Figure C.2 - The hub ... 46
Figure D.1 - Data tables. Source (Cronström, 2012). ... 47
viii
LIST OF TABLES
Table 2.1 – Aspects of a KPI Source (Eckerson, 2009). ... 9
Table 3.1 - SCRUM parts ... 12
Table 4.1 - .txt files of a Qlik Sense App ... 17
Table 4.2 - Metadata Fields ... 19
Table 4.3 Benchmark Selection KPI ... 23
Table 4.4 Principal KPI ... 23
Table 5.1 - Scalability Tools result ... 32
Table 5.2 - Results CIE INDEX App ... 34
ix
LIST OF ABBREVIATIONS AND ACRONYMS
Acronym Explanation of acronym
BI
Business Intelligence
CM
Change Management
ETL
Extraction, Transformation, and Loading
KPI
Key Performance Indicator
QMC
Qlik Management Console
QS
Qlik Sense
QVD
QlikView Data file
SDG
Strategy Decision Governance
US
User Story
1
1. INTRODUCTION
Business Intelligence (BI) has been a top priority of IT executives for several years, and the market for related software products continues to proliferate, despite the challenging macroeconomic conditions (Sommer, 2014). With the incrementation of data and analytics insights, the last phrase has more relevance. Still, also, the BI software has evolved to improve the performance with big data and includes analytics.
The Extraction Transform Load ETL process turn raw data into information, Consultant companies like SDG Group help companies in the whole process through the implementation of Analytic Software that allows constructing insights from the data, in the process, the consultants give architecture and analytics solutions.
The projects aim to introduce a Business Intelligence solution by providing a tailored web graphical interface for a Customer in the Pharmaceutical Sector with Emphasis in the EMEA Region. This project enables the possibility to examine different support systems for the Organization to manage data, make decisions, and improve its competitive advantage in the market.
The leading software used during the internship is Qlik that offers governed data discovery and agile analytics. The main advantage of Qlik is the associative engine that will automatically figure out the relationship within the data, as it loads all the information in memory, all the information related to the Qlik Sense software as functions and terminology is explained in the Appendixes.
Besides working on the data model and the dashboards, the Sense Test Performance Methodology
is developed; this is an innovative project for the company; innovation and creativity are depending on Knowledge Management, which is the master’s degree specialization.
The company have been developed in Qlik for more than ten years and has different Managers and senior consultants with an extensive Qlik good practice skill, even though this tacit knowledge is not transmitted to the whole company and is an issue when new consultants start a project, one critical success factor of any consultant firm is the knowledge transmission between is employees, actually transforming tacit knowledge into explicit knowledge is the beginning of a knowledge creation (NONAKA, 2014).
The Sense Test Performance Methodology aims to guarantee the performance of all the Qlik Sense applications that are developing in-house. The main idea is the creation of a user manual that would recompile the tacit and non-tacit knowledge of the consultants, includes the most used memory performance tools on the market, and a final report with the app performance delivers to the client. As the Sense Test Methodology is related to performance, some results contain RAM and CPU usage, these concepts are explaining in the literature review chapter. Appendix E would provide all the information related to Qlik Engine.
2
1.1.
C
OMPANYD
ESCRIPTIONSDG Group is a multinational company found in Italy in 1991, with offices in Portugal. The company has experienced high and consistent growth thanks to the performance and quality of their projects that adapt to the necessities of the client. It has been awarded as Qlik partner of the year for Europe in the last four years.
The Client that the author is assigned during the Internship is Janssen that is the pharmaceutical company of Johnson & Johnson, with over 40,000 employees working on the five continents, around $4.5 billion in research development annually, and a top company in the pharmaceutical sales.
1.2. P
ROBLEMD
EFINITION ANDM
OTIVATIONJanssen pharmaceutical is one of the principal clients of the company and needs a web-based dashboard for the EMEA region. Managers need to assert the right decisions quickly, and for that, they need clear and accurate information, especially the one related to Sales and Expenses.
Companies need information systems that are easy to use, and they do not have to invest in training to be used, that the reason to select a web-based dashboard with the necessary KPI, graphics, and tables. The name of the project is Ensemble and would use Qlik Sense and web front end technologies like Angular and HTML.
SDG is growing and the sophistication and necessities of the clients that follow the trend of Website usage. People want websites that load quickly and without any problems. Surveys conducted by Google indicate that internet users expect websites to load within three to four seconds. If sites take longer than that, users are more likely to turn towards the competition (Wertz, 2017).
A dashboard that the user must wait for more than five seconds may not be used and would finish in a waste of resources for the company that is buying the service and to an unsatisfied customer for SDG. The topic could be solved by implementing good practices and having metrics of the opening and reload times of the app.
To summarize, the project would have two parts, one to develop a data web-based dashboard and the second to ensure the performance of any Qlik sense app developed by SDG. Both parts keep the author highly motivated first because it includes the subject of the master with its specialization, and second the possibility to be an expert in the development and performance of Qlik Sense software.
3 The role in the project would be to be part of the Ensemble Team and worked in all the phases of the projects, that includes the data model construction, The Qlik visualizations, and the Web Site construction. Otherwise, the focus would be in the Business Intelligence area, which is the data model construction and the necessary Qlik Sense objects render on the website.
The author constructs the Sense Test Performance Methodology based on the Ensemble work, research, and capture the knowledge that exists in the company. It is essential to understand the Social Networks to capture the knowledge and adopt a change management methodology to succeed.
1.4. S
TUDYG
OALSThe main goals are to create a performance web-based dashboard that allows the EMEA Managers to make the correct decisions and develop the Sense Test Performance Methodology.
Specific Objectives
▪ Guarantee the veracity of the data extracted and confirmation of the selected metrics. ▪ Facilitate the managerial level of the corporation an effective analysis about the performance
of the company Sales and OPEX operations.
▪ Present a Web based analysis solution that empowers users to access up-to-date data that include all information needed for business analysis in a clean presentation.
▪ Achieve consultants' participation in the Sense Test performance methodology. ▪ Empower the consultants to implement Qlik Sense good practices.
4
2. LITERATURE REVIEW
The main topic during the internship is Business Intelligence (BI), which is a broad category of applications, technologies, and processes for gathering, storing, accessing, and analyzing data to help business users make better decisions (Watson, 2009)
The evolution of the BI system is taking the development of new paradigms and challenges. BI systems differ from earlier forms of Decision Support System in several ways: First, they typically involve systematic integration, aggregation and management of structured and unstructured data in increasingly ‘real-time’ data warehouses, which enable new forms of fact-based Second, BI solutions today deal with very large and increasing amounts of data (‘Big Data’) and can rely on exponentially increasing processing capacities (incl. in-memory technologies) (Wieder, 2015).
2.1. B
USINESSI
NTELLIGENCES
OFTWAREDuring the internship, Qlik Sense was the most used program, especially for Business Intelligence development, an application program interface (API) was used to integrate the data to a web-based report that is named by Qlik as a Mash-Up and use AngularJS, HTML, and CSS. As the web facilitates the navigation for the final user is in high demand for the client even that needs more time to develop.
Qlik offers governed data discovery and agile analytic and BI via its lead product Qlik Sense. The Qlik Analytics Platform supports developers in creating customized applications and for the embedded use case. QlikView continues to be enhanced and makes up a more substantial portion of the company’s installed customer base. At the same time, Qlik Sense now accounts for more than 50 percent of license revenue (Gartner, 2018) Figure 2.1.
5 Figure 2.1 – Garner Quadrant, Source (Gartner, 2018).
For the developer, Qlik has some advantages that are important to be aware. The most significant is that the tables are linked automatically by the name of the field; consequently, it is not necessary to define Primary and Foreign Keys. If two tables have more than one field with the same name, it will generate a Synthetic key, and it is necessary to rename the fields to only have one as key. All the Qlik functionality is explained in Appendixes A, B, and C.
2.2. D
ATAW
AREHOUSEA data warehousing is a technique for collecting and managing data from varied sources to provide meaningful business insights. It is a blend of technologies and components which aids the strategic use of data. There are two main approaches to construction, Immon, and Kimball:
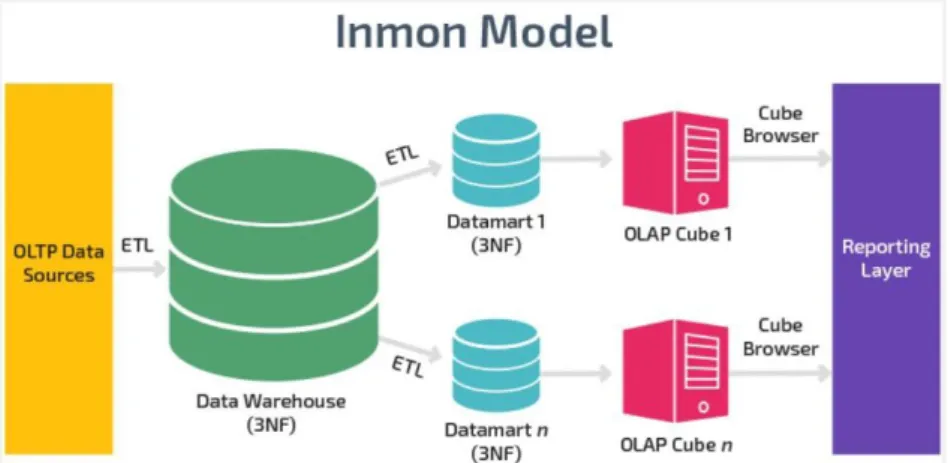
Immon(Top-Down)
The Data Warehouse (DW) is centralized; it starts with its construction, therefore a normalized data model is designed first, then the dimensional data marts, which contain data required for specific business processes or specific departments, are created from the data warehouse. (Sansu, 2012)
6 The DW contains data at an atomic level, and from here, the data marts are created, as is shown in Figure 2.2, according to Immon, this are the Datawarehouse characteristics.
▪ Subject-oriented: The data elements are related to a business subject ▪ Time-variant: The data is added over time
▪ Non-volatile: Data in the data warehouse is never overwritten or deleted. Once committed, the data is static, read-only, and retained for future reporting.
▪ Integrated: The database contains data from all of an organization’s operational applications.
Figure 2.2 – Immon DW model, Source (Panoply, 2019).
Kimball(Bottom-Up )
The model starts the construction from the bottom, in a company the departments or business units, each one according to its necessities constructed the Data Mart and then if it is necessary as the company growths a Data Warehouse that integrated all the Data Marts is constructed.
The approach takes less effort, as is shown in Figure 2.3; otherwise, in the end, the same data could have different values in each department.
7 Figure 2.3 – Kimball, Source (Panoply, 2019)
2.3. D
ATA MARTA data mart is a subset of a data warehouse oriented to a specific business line. Data marts contain repositories of summarized data collected for analysis on a specific section or unit within an organization, for example, the sales department (Panoply, 2019).
The Data Mart typically have few Data Source Sources that are linked to business need; the size is no more than 100 Gigabytes. The advantages are that the departments can access quickly to the information, and the dashboard is constructed according to specific needs.
The data marts are classified as dependent that is the Immon’s model, and it is easier to construct because the data is clean, and the ETL process is basically to select the information that is needed from the central DW, and dependent that is Kimball’s approach and must deal with all the aspect of the ETL process.
2.4. S
CHEMASThe Schema is an essential part of the DW design; according to the information that is needed, a schema would be constructed and would have an influence on the performance and the queries that would be necessary to extract the data. The most used are the Start and Snowflake Schema.
Star Schema
In the Star Schema, the data is organized into Facts and Dimensions. A fact is an event that is counted or measured, such as a sale or log in. A dimension contains reference information about the Fact,
8 such as date, product, or customer (Rouse, 2019). The structure of the Schema Fact data is like a star with a central Fact table that is a link through a key to Dimension tables.
Snowflake Schema
The Snowflake schema is like a Start schema, but with the dimension tables normalized, therefore the schema would have a fact table that is linked to dimensions tables, and this one has links to other tables.
As the Snowflake schema has more tables than the Star, more complex queries are needed to access the data, but the system has less redundancy and is easier to maintain. If a dimension table is big in relatively big in size snowflaking is better as it reduces space (Diffen, 2019).
2.5. D
ASHBOARDA data dashboard is an information management tool that visually tracks, analyzes, and displays Key Performance Indicators, KPI, graphics, or information that is constructed in a visual way that facilitates the comprehensions for the business user and lets them make the right decisions.
One of the key aspects of a dashboard is to construct the story, “when colleagues and senior management are overwhelmed by data and facts without context, you lose, You will need the “what” of your story (the facts and data), but you also need the “who?”, the “how?”, the “why?” and the often missed “so what?”. It’s these story elements that will make your data relevant and tangible for your audience.” (Fink, 2007).
2.5.1. KPI
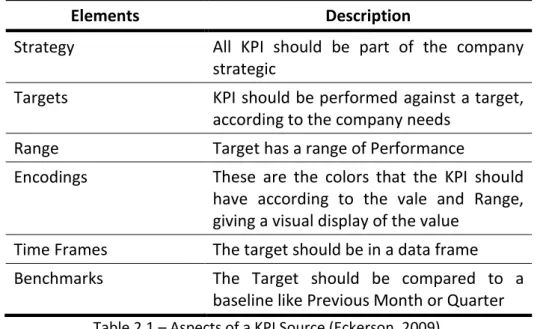
The Key Performance Indicators are the base of the dashboard and are the measures that are important for the business and are aligned with a strategic objective, The only difference between a metric and a KPI is that a KPI embodies a strategic objective and measures performance against a goa (Eckerson, 2009)
A KPI should have the elements that are shown in Table 2.1, to be effective, it is crucial to check that all of the elements are present, the Strategy is the most subjective and depends on the directives of the company.
9
Elements
Description
Strategy
All KPI should be part of the company
strategic
Targets
KPI should be performed against a target,
according to the company needs
Range
Target has a range of Performance
Encodings
These are the colors that the KPI should
have according to the vale and Range,
giving a visual display of the value
Time Frames
The target should be in a data frame
Benchmarks
The Target should be compared to a
baseline like Previous Month or Quarter
Table 2.1 – Aspects of a KPI Source (Eckerson, 2009).There are two kinds of KPI, the Outcomes and the Drivers, the first ones are related to past information like Expenses and the drivers are KPI that impact the Outcomes like in expenses the number of debt negotiations.
2.5.2. Types of Performance Dashboards
One crucial point when a dashboard is designed is to know to whom the dashboard would be delivered, and the information would be different if it is presented to the executive boards, the manager, or the operators. Strategic, Tactical, and Operational are the types of performance dashboards as is shown in Figure 2.4.
10 The strategic dashboard, as the name said is focused on strategy and used by the executives of the company, the information is the data that is summarized, the Outcomes KPI is used to Strategic decisions, and the periodicity is generally quarterly or monthly.
The Tactical dashboards help managers to optimize the performance of the processes, and this dashboard is a mix of the Strategic and the operational. Usually, the mid-lever person must follow the directions of the executives and supervise the persons under its control.
Operational dashboards aim to control processes on an intraday basis and are used for the Staff of the company, the information is detailed, and the most used KPI are the drivers.
Generally, strategic dashboards comprise outcome KPI, operational dashboards show driver KPI and operational metrics, and tactical dashboards have a mix of outcome and driver KPI (Eckerson, 2009).
2.5.3. Design of the Dashboard
The design of the dashboards follows the DAR Concept (Dashboard/Analysis/ Reporting) to develop a clean and somewhat minimal (or necessary) This helps to both increase adoption and understanding of the application and frequently helps performance. The main idea is to have a story that guides the user through the data, in this order of ideas, the first page will be a resume with the principals KPI and primary information, after this detail information of the summary in other sheets and could navigate throughout the dashboard. (QlikView, 2013).
2.6. C
HANGEM
ANAGEMENTThe Sense Test Performance Methodology requires change management as the objective is to introduce the change in the organization routine, and a CM methodology should be followed in order to succeed in the implementation.
11 Figure 2.5 - Change Management Steps Source (Kotter, 2012)
Change at the organizational level needs a commitment with stakeholders on two phases to approach, align key stakeholders, and engage organization based on seven steps (Kotter, 2012). The first step is the one called Understand. In this starting point, it is necessary to talk with the key stakeholders and share information with them in order to align the different goals. After this phase, starts the Enlist step, where there are select people who will be in charge to promote the changes, and that will compose the change team.
The third step is named Envisage, in this case, new visions and missions, but also new strategies are developed, after this, in the Motivate step the senior level must put pressure on the organization staff, they should feel a sense of urgency to change. The three last steps are concentrate on employees; during the fifth one, the Communicate, they are included in the new vision of the company, and in the sixth one, they will operate and Act in terms of produce a real change inside the organization. The last one, the Consolidate step, the organization in the whole undertakes to consolidate gains. All the steps are shown in Figure 2.5
2.7. M
EMORYP
ERFORMANCEThe Qlik performance depends on the RAM. RAM functions as the computer’s short-term or temporary memory. It stores the data inputted into an application. RAM is only responsible for holding data while an application is running. Once the application closes, the data is lost and works in conjunction with the central processing unit (CPU). If RAM is the temporary memory, the CPU is the brain of the computer. The CPU chip retrieves data from the RAM. The chip takes those instructions and begins to move and process data through the motherboard in the correct order to its next designated (Pritchard, 2019).
12
3. PROJECT METHODOLOGY
According to the Project Management Institute, Project management is the application of knowledge, skills, tools, and techniques to project activities to meet the project requirements and a Project is temporary in that it has a defined beginning and end in time, and therefore defined scope and resources (PMI, 2019).
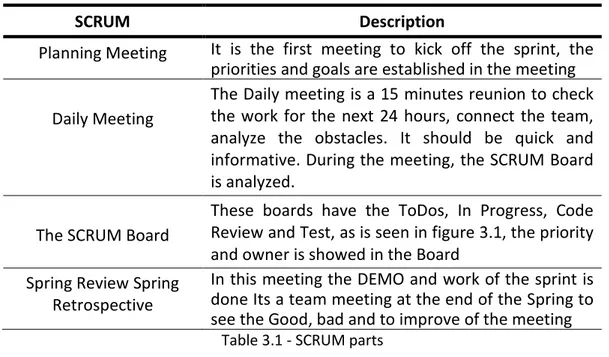
The SCRUM framework was used for effective collaboration, and Scrum is an agile method of iterative and incremental product delivery that uses frequent feedback and collaborative decision making. (Sliger, 2011), all the steps used in the internship are explained in Table 3.1. The principal tool was the Jira Software that is a powerful work management tool for all kinds of use cases, from requirements and test case management to agile software development, with the software the user has access to a Scrum Board (Atlassian, 2019)
SCRUM
Description
Planning Meeting
It is the first meeting to kick off the sprint, the
priorities and goals are established in the meeting
Daily Meeting
The Daily meeting is a 15 minutes reunion to check
the work for the next 24 hours, connect the team,
analyze the obstacles. It should be quick and
informative. During the meeting, the SCRUM Board
is analyzed.
The SCRUM Board
These boards have the ToDos, In Progress, Code
Review and Test, as is seen in figure 3.1, the priority
and owner is showed in the Board
Spring Review Spring
Retrospective
In this meeting the DEMO and work of the sprint is
done Its a team meeting at the end of the Spring to
see the Good, bad and to improve of the meeting
Table 3.1 - SCRUM parts
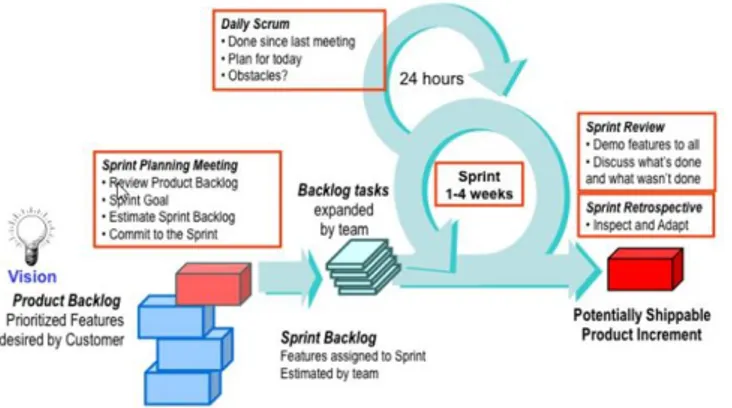
Scrum focuses on planning, committing, and delivering time-boxed chunks of work called sprints, as is shown in Figure 3.1. The development of the web-based dashboard is four sprints, and each sprint is twenty-one days, and five days of User Acceptance Testing UAT. The Senior Consultant does the Backlog, which is the planning of the sprint with the construction of the User Stories.
13 Figure 3.1 - SCRUM, SOURCE (Sliger, 2011)
3.1. S
CHEDULEFigure 3.2 - Project Schedule
3.1.1. Kick OFF
It is the start meeting of the internship were the team that the author will work will be presented, the chronogram as well, and the principal goals.
14 In twenty-one days, the author would be familiarized with Qlik, the primary BI tool that is used during the internship, in Appendix A, B, and C of this document the main topics of the software are Explain.
3.1.3. Web Dashboard
The construction of the dashboard is divided into four sprints, and each one has fifteen working days of development and six days of UAT.
▪ Sprint 1: The goal is to develop the data model according to the business requirements. ▪ Sprint 2: The goal is to finish the development of the data model and start to construct the
KPIs and Objects in Qlik Sense and start the web Front End ▪ Sprint 3: The goal is to finish the Qlik Sense Objects
▪ Sprint 4: the goal is to develop the Web part and test all the data
3.1.4. Qlik Test Performance Methodology
With the good practices of the Ensemble Web Dashboard, research, and knowledge, the Qlik Test performance Methodology will be developed in three sprints.
▪ Sprint 1 and 2: The goal is to document good practices and investigate tools that are useful to measure the performance of a Qlik application
▪ Sprint 3: The goal is to construct and test a methodology that guarantees good practices
3.1.5. Deliver the project
Deliver the manual with the Qlik Test Performance methodology and do a final presentation to the whole company and next steps for the implementation
15
4. WEB DASHBOARD
In this chapter, all the information related to the web dashboard is analyzed; the project needs the construction of a dependent data mart, the data comes from a DW that is powered by Amazon Redshift, and the data Extraction is reduced to the selection of the needed data.
The folder structure and architecture would be analyzed in deep because it is going to be an input for the Qlik Test Sense Methodology, and the company aims to uniform the folder structure of the projects.
The result of all the processes would be a web dashboard that will render the Qlik Sens objects that are known as master items. SDG has a web boilerplate that makes the Angularjs connections with Qlik and brings the master objects with an angular directive. The major part of web development is HTML and CSS.
The project is a web front end located inside the Qlik Server, and the web communicates with the Qlik sense app and parses the complete object, the web is an extension of the Qlik app with the HTML capabilities like responsive menus and easy to use.
4.1. A
RCHITECTURE FOR THE PROJECTS AND FOLDERS
TRUCTUREA business Intelligence solution came from the Data that could be in databases, ERP, CSV, or other formats. The Data that is Streams of raw facts representing events such as business transactions is transformed into information that is meaningful and useful to human beings in the decision process. This Transformation is done structurally through The Extraction, Transform, Load ETL Process.
After the information is debugged, unify, and consoled in a Data Warehouse, that could be used for departments to construct different data marts of the company.
In the internship, The Data comes from different sources; the principal is a DW that is powered by Amazon Redshift, which is a fully managed, petabyte-scale data warehouse service in the cloud, that lets the user make fast queries (Amazon, 2019).
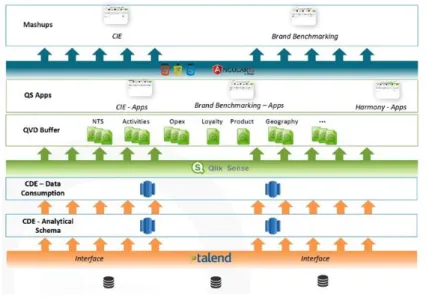
The whole architecture of the projects is explained in Figure 4.1. From bottom-up, first, it shows the data extracted, and the Data warehouse is constructed with the Talend software; another team does this step. Our process consists of the construction of the data mart, from a DW, it follows Immon´s approach, then the Qlik Sense ETL process and app development, finally, the web front end interface that is known as a mash-up.
16 Figure 4.1 – Data Architecture
The Qlik Sense follows the ETL process; mainly, each step of the process creates a Qlik Sense application. The steps are named Layer, so Layer one is the Extract process, Layer two the Transform, and Layer three the Load. The scripts of the application are .txt files that are saved on the server and imported to the Qlik application; it is safer to keep scripts and apply a Git version control system to follow and share the development process.
All these files are organized inside folders in an architecture way that it is understandable and easy to follow or find the files, as we see in Figure 4.2.
Figure 4.2 - Folder Organization
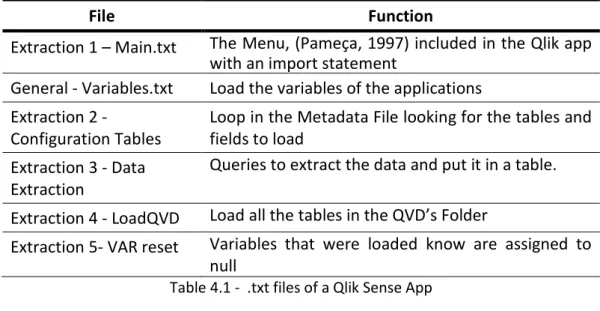
17 The extraction process occurs in Layer one. The required fields are extracted with SQL queries and loaded into the Qlik View Documents QVD. On the Qlik Sense server, the connections to the DW is configured with the respective credentials. The main.txt is the menu of the .txt files. Table 4.1 shows the files used in the extraction process. At the end of this process, the QVDs are loaded and saved.
File
Function
Extraction 1 – Main.txt
The Menu, (Pameça, 1997) included in the Qlik app
with an import statement
General - Variables.txt
Load the variables of the applications
Extraction 2 -
Configuration Tables
Loop in the Metadata File looking for the tables and
fields to load
Extraction 3 - Data
Extraction
Queries to extract the data and put it in a table.
Extraction 4 - LoadQVD
Load all the tables in the QVD’s Folder
Extraction 5- VAR reset
Variables that were loaded know are assigned to
null
Table 4.1 - .txt files of a Qlik Sense App
4.1.2. Transform
In the transformation process, the data is taken from the QVDs of layer one, and the business transformations are applied. In the internship dates transformation, to create the Month Year dimension, and Quarters as numbers in order to compare the values are done in the metadata Excel file.
The process follows the last step logic with a main.txt menu after the process ends; the data is loaded into the QVDs of layer two.
4.1.3. Load
The load is the last step and is the app that the client has access to, in this project is a Web that is in the Qlik Server and connects to a Qlik sense application to get the created objects.
The scripts of the application will construct the data model according to the business requirements. The schema is a start model with a big fact table.
The Data came from layer two, and the data model is constructed. Finally, the final QVD is stored in layer three.
18
4.1.4. Configuration Files
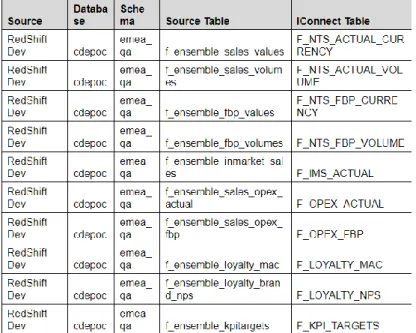
4.1.4.1. The Metadata File.
The Metadata is an Excel file with a dictionary of the Data Warehouse tables used in the project. The system will read the following information:
▪ Tables to be extracted from the data lake ▪ Source fields need to be loaded;
▪ Source Table
This excel file is also used to configure the connection and extraction of the data sources, to manage the transformation of data, and to manage metadata. The main sheet in the Metadata file is the Tables(sys), which has the organization of the source tables to Qlik content, where “Source Table” is the original table.
Some of the information found in this excel is described in the following explanatory Figure 4.3.
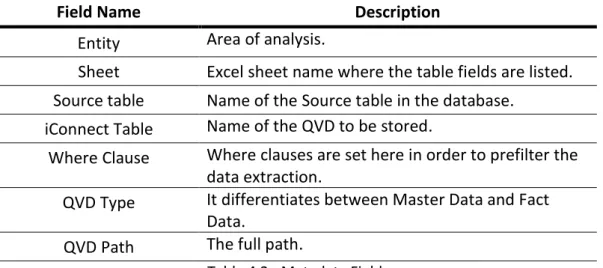
Figure 4.3 - Metadata Table Some of the information found in this excel is described in the table 4.2:
19
Field Name
Description
Entity
Area of analysis.
Sheet
Excel sheet name where the table fields are listed.
Source table
Name of the Source table in the database.
iConnect Table
Name of the QVD to be stored.
Where Clause
Where clauses are set here in order to prefilter the
data extraction.
QVD Type
It differentiates between Master Data and Fact
Data.
QVD Path
The full path.
Table 4.2 - Metadata Fields
4.1.4.2. Variable Configuration
The configuration file Variable Configuration is where variables and (this includes expressions for the applications, calculations, and labels for the main metrics and figures) and variables that control parts of the customized navigation in the dashboard are defined. The system reads the variable name, the value of the variable, and is active or not.
Critical practice is to follow a naming convention for the variables, the names start with a lower-case prefix that indicates the type of contents the variable is holding, and then a descriptive noun for the variable in Camel-Case:
▪ Single values are prefixed with a “v”, for example, vCurrentYear ▪ Expressions are prefixed with an “e”, for example, eSalesAmount
▪ Constants, values that are never meant to be changed, are prefixed with “const”, for example constYes (Bitmetric, 2016)
4.2. T
HED
ATAM
ODELThe design of the data model represents the business needs that the dashboard would require; according to Qlik, the best approach is a Star Schema and is the one that is advised in all the developments. In the internship, the model is a Star Schema with a big fact table that has the majority of data and three Master Tables that are Product, Calendar, and Exchange Rate, as is shown in Figure 4.4.
20 Figure 4.4 - Data Model
4.2.1. Facts Data
Since the fact data is coming from different extractions of the view, all facts data will be loaded independently but concatenated to the Star main table, FACT DATA
4.2.2. Master Data
All master data will be loaded independently but connected to the Star table via a key.
Calendar
The Master Calendar table contains all dates from the natural calendar with different formats (YYYYMM, MMM-YY, etc...).
Product
The Master Product table contains the JnJ products, harmonized names with the Therapeutic Area assigned.
21 The Master Contains table the local currency and the exchange rate
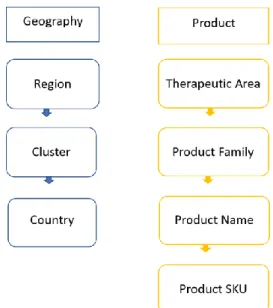
Granularity:
Geography granularity is shown in Figure 4.5, start with the region EMEA, then it has the clusters that include different countries like IBERIA stands for Portugal and Spain, and finally the countries. The user can filter with the grade of detail that considers necessary.
The top hierarchy in products is the Therapeutic area; Jansen has six priorities therapeutics areas, that area Cardiovascular Metabolic disease, Immunology, Infectious Diseases Vaccines, Neuroscience, Oncology, and Pulmonary Hypertension. Then came the Product Family that groups different products, later the product, and finally, the product SKU that has the specific product name and specification as is shown in Figure 4.5.
The Dates the lowest level of granularity is Month, then Quarter and finally Year, also a Month-Year Dimension is created.
Figure 4.5 - Granularity
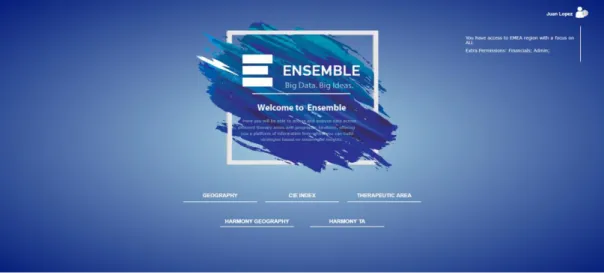
22 The user enters and authenticates in a landing page, to authenticate un app with the credentials made the process, this page works for different applications like Brand Cockpit, Ensemble and CIE Index as is shown in Figure 4.6.
Figure 4.6 - Landing Page
After the user login, it enters the Geography Area site that offers a pleasant, easy-to-use, navigating menu on the left and a vertical menu on top, then the site with vital statistics to the Ensemble Application, displaying information on the top 5 Clusters.
The horizontal menu lets the client navigate to the different sheets of the web mashup, that are Geography, Therapeutic Area, Competitor Analysis and CIE Index, the users can navigate through them like a standard website, Figure 4.7
Figure 4.7 - Horizontal Menu
The vertical menu has a series of toggles that let the user choose between different granularity and range measures, as is shown in Table 4.3 and Figure 4.8,also to filter according to its necessities .
23 Figure 4.8 - Vertical Menu
Menu name
Description
PY
Previous Year.
BP
Business Forecast created at the beginning of the
year.
JU
June Update. Take into account that this data is
available after June. From Jan to June, it is Actual.
After June it is forecast.
NU
November Update. The data is available after
November. From Jan to Nov, it is actual data. After
November, it is forecast.
YTD
Year to date stands for the months of the year until
the current date.
CAL
Calendar, it is a Month date Picker.
Table 4.3 Benchmark Selection KPI4.3.1. KPI
Table 4.4 shows the main KPIs that are used in the project; all of them have a benchmark that the user can select; the default is the Previous Year. The company defines the target, and according to them, the encodings are determined, green, and arrow up if it is improving, amber for neutral, and red and arrow down worst.
KPI Name
Description
OPEX
Stands for Operating Expenses and shows the
expenses according to the selection.
Market Share
It is the portion of the market that the product has.
Evolution Index
It is the share of the sales of the products of the
current year with market sales of the previous year.
Loyalty
It is the current ranking of the product according to
the users.
24 Figure 4.9 shows a KPI example, with all the parts that are Strategy Range, Encodings, Time Frames and Benchmarks,
Figure 4.9 - KPI example
4.3.2. Dashboard
The Dashboard would have information about Sales, Operation Expenses OPEX, and a Loyalty measure that is a survey of the doctor with the pharmaceutical products. The Net Trade Sales that are the gross sales minus the sales allowances, sales discounts and sales returns, in the internship the data was taken from a table a not operation besides aggregating according to the necessities was done.
The Operational Expenses OPEX stands for the costs a company incurs for running their day-to-day operations. These expenses must be ordinary and customary costs for the industry in which the company operates. (ROSS, 2019) The company must monitor and have an acceptable level of expenses.
The loyalty Measure is a rank that is classified through surveys to the doctors about the Janssen products, the information goes until level five, being one the best rank and 5 the worst. Managers monitor any change that represents the acceptance of the products.
The objects were created first in the Qlik Sense App, then are imported trough a configure angular directive. When the chart does not exist in Qlik, like the line chart with two lines, it is necessary to parse the data in a hypercube that represents extractions of the data. Then the graphic is done with a JavaScript graphic library like Picasso. This web development is out of the scope of the report.
4.3.3. Geography
This Site gives information classify by geography, as is shown in Figure 4.10, the web dashboards start showing the information about the Region EMEA and then the top 5 Clusters. The principal objects are:
1. Line Chart, in blue, the current selection, and in gray, the selected benchmark. The bottom of a sales KPI with all the corresponding elements is displayed.
2. Market Share. 3. Loyalty Ranking.
25 Figure 4.10 - Geography Dashboard
4.3.4. Therapeutic Area
The user must select a therapeutic to access the site, after these three KPI are shown, as is seen in Figure 4.11. the main objects are the two-line charts, that show the data according to the selected toggle.
The idea is that the managers can compare the desired Therapeutic are for different countries; the default measures are NTS and Market Share.
26 Figure 4.11 - Therapeutic area
4.4. T
ESTFor a dashboard to be accepted and has utility inside the organization, the data must be accurate; misleading data leads managers to make wrong decisions that involve a high cost for the company. The business owner accepts any US after the tests is approved, the test is an excel sheet that contains the steps to test the data; one example could be:
1. Open the dashboard and select country Spain, Product Darzalex. 2. Check the value of the line chart for the year 2018.
3. Open the Database administrator and write the following query. 4. The Values match
The developer must create a test per US, then do the test and present graphical evidence. The business developer redoes the test and agrees or rejects the development after he accepts it, the US is ready for production.
During the internship, the author investigates Robot Framework that is a generic open-source automation framework for acceptance testing, acceptance test driven development (ATDD), and robotic process automation (RPA) (robotframework, 2019).
The robot can open a website, navigate through them, check for functionalities, also to see the display value on the web, and compare it to a database. The data robot uses Python and the selenium library.
27 The author develops a small data robot in Python program and Selenium library that compares data from the web with data of the database. The results are shown in Figure 4.12.
Figure 4.12 Data Robot Log
The development is a small demo that shows the managers the technology to analyze and decide for future developments. The Data robot has advantages like program the test periodically and gets alerts in case of a mismatch. Also, it is a guarantee that the data is accurate, converting the tool in a win-win situation.
28
5. QLIK TEST PERFORMANCE METHODOLOGY
The second part of the methodology is related to Business Intelligence and Change Management, the goal of change management is to introduce the change on the organization routine, defying the organizational changes required to transform project’s product into benefits.
The Qlik Sense Teste performance Methodology brings quality to the projects and improves the consultant’s skills. One crucial point is that the manager for Janssen is requesting for the Qlik Test Performance Methodology; this gives the project the support to implement the Kotter steps.
Four CM workshops were organized.
1. Present the project to the seniors, managers, and team leaders, all of them agree to collaborate and share knowledge.
2. Present the sketch and get feedback.
3. Show the results in an app and see methods to implement. 4. Demo session with all the consultants/
The managers and team leaders start to transmit a sense of urgency, also the slogan “better developers, the stronger company.”. The idea is that the consultants understand that following the Qlik Test Performance Methodology would lead them to be better professionals and helps the company to a position as a leader in quality.
For Business Intelligence, active research in methods and software that measure the performance is done by the author, the managers and the team leaders want a practical methodology that is easy to implement. The good practice of the Ensemble, the knowledge of the teams, and workshops are the input of the Sense Test Performance Methodology.
5.1. D
ESIGN OF THEM
ETHODOLOGYThe methodology was constructed with the supervision of the Managers and Senior consultants under the SCRUM methodology. First, a manual is constructed with the Folder Structures, the ETL process explained in chapter 4, and the Qlik Engine functionality appendix D.
The Qlik Sense Performance Methodology would have four steps; the idea is that before any app goes to production, the application passed for these steps; if the results are not satisfied, the developers should correct and test it again.
29 • Excel Checklist
• Document Analyzer • Scalability Tool
• Application Performance Presentation
5.1.1. Excel Checklist
An excel file is constructed and delivered to all the company consultants; the file aims to secure the performance of the application. The consultant should answer and add graphical evidence of eighteen items after the questions are answered a table panel, as is shown in Figure 5.1, resume the findings.
The panel would give the team leader insight into the application, to answer all the checklist questions the consultant could use the Document Analyzer that would be explained in the next step. The questions are grouped into three categories.
Figure 5.1 - Check List Panel
▪ 14 Critical issues that profoundly affect the data model like synthetic keys, Tables load without the QVD optimized, circular references, appropriated granularity, Timestamps removed.
▪ 5 High issues: Aggregation variables, the keys with strings, and without Autonumber (), String Comparison, Variable configuration with all the variables.
▪ 8 Medium issues: Time Stamps removed, Set Analysis used where possible, data island avoid.
30
5.1.2. Document Analyzer
The document analyzer is a free application profiling tool for Qlik Sense that can help you identify items such as unused fields, poorly performing expressions and data model problems (WUNDERLICH, 2017) is created by Rob Wunderlich.
A document analyzer is a valuable tool that highlighted where the main flags of the application are, as is shown in Figure 5.2. This tool helps the consultant to get the status of the app. It is easy to install, and as it is a Qlik Sense app is easy to tun also.
Figure 5.2 - Document Analyzer
The calculation times of the document analyzer are not accurate because the app is not running in the server; for this reason, the times would not be taking in the account except to check if it is an outlier.
As is shown Figure 5.2 three crucial flags should be considered 1. Three objects take more time than the rest.
2. Seventy-six fields are not used and take 35 percent of the RAM usage.
3. One hundred ninety-nine variables are not loaded in the back end on the variable configuration file.
31 As the field removal is a business decision and the time to check is short, the Pareto optimal was suggested, which is to take the 20 percent of the number fields that more memory space occupies and check with the business owner if they can be removed.
Most cost resource expressions are related to nested ifs and string comparison issues. The first one is solved with the implementation of a Pick() function, as is shown in Figure 5.3, and the second one, the string is changed for a dummy value.
Figure 5.3 - Optimized variables
The developer team should use the last two steps in conjunction in order to analyze the application and correct possible issues. After this, the team leader should approve, and the app pass to the next step.
The document analyzer is an early victory for the Sense Performance Methodology, which is accessible to users and explains in a secure form the flags of the apps.
5.1.3. Scalability Tools
The Qlik Sense Enterprise Scalability Tools are used to create, run, load, and performance tests towards Qlik Sense Enterprise for Windows, the tool is created by Qlik that offers a guarantee on the results.
The Qlik Sense Scalability Tools is a suite of tools that simulated virtual users against the Qlik sense server, making it possible to tailor the performance of the application. With this application, essential information about the RAM and CPU is retrieved, and compare with the acceptance criteria of the stakeholder, one example of the results is showed in Table 5.1 - Scalability Tools result.
32
KPIs
Median
Average
Maximum
Time to open
application
2 seconds
2 seconds
2 seconds
Initial RAM cost
116 MB
116 MB
116 MB
Response time first
user
3 seconds
29 seconds
857 seconds
Resource
consumption;
CPU
2 cpu seconds
2 cpu seconds
2 cpu seconds
Resource
consumption;
RAM
116 MB
116 MB
116 MB
Table 5.1 - Scalability Tools result
The Scalability tool can do a stress test; the application generates virtual users that simulate the behavior of real users and test the performance of the Qlik Sense Object like graphics that are on the dashboard according to the number of users that the application will have in production.
With this result we can start to analyze which could be the main issues of the application, in Table 5.1, the RAM Consumption is too high, in most cases there is a lot of fields or dimensions that are not used and are taking memory. The error should appear in the last two steps of the methodology. As the Scalability tools compare the information against the server is necessary to configure a virtual proxy to intercept the server and obtain the information, all the installation steps are on the user manual, even though it is only necessary to install one time per server.
As Qlik creates and certifies the result, the tool could be the guarantee that SDG could offer to the sophisticated clients that need the times, RAM, and CPU usage of the application according to a certain number of users as the case of Janssen.
5.1.4. Application Performance Presentation
A Presentation document is delivered to the client, with performance information of the Qlik Sense Scalability tool. A boilerplate is created, so the consultant only must edit and add the information related to the app. This document is a guarantee for the customer and innovation process for SDG.
33
5.1.5. Results in an example App
In the third workshop, the manager decided that the Qlik Sense Test performance methodology would be tested in the CIE Index Application, this is one of the most important dashboards created in the company for Janssen Pharmaceutical. Moreover, as the data is growing, the speed of the dashboard is decreasing.
Having one of the crucial dashboards is also an early victory that helps in the change management process as most of the consultants know the app.
5.1.6. Flags
From the excel checklist, only one change has to be done and is that the link keys in the data model are not numbers; with the Qlik autonumber() function, any field could be converter in a unique number that would optimize the queries.
In the document analyzer, the following flags exist:
▪ Field Count: 157 Unused: 75 that represents 47.8% of the total and 49.7% of RAM Consumption
▪ Four unused files with more RAM Consumption came from the same table
▪ 498 variables in total, 199 did not load in the variable configuration, and the application must read from front end causing more load times and RAM consumption
▪ Ten variables with nested ifs.
5.1.7. Improvements
the Scalability tool was applied to the apps before and after the improvements to test the methodology with the following results as is shown in Table 5.1 - Scalability Tools result.
34
Graphic
Improvement
RAM Consumption:
The app needs 38% less of RAM ConsumptionOpen the app:
The
Corrected
application is faster
to
open
in
0.3
seconds faster
Objects Load:
The objects that have
the nested if improve
the
performance
around 50%
Chrome Test:
The improve in the
mashup
time
is
around 10%
Table 5.2 - Results CIE INDEX App
5.1.8. Qlik Sense Performance Methodology Conclusion
The Qlik Sense Performance Methodology has a massive acceptance in the consultants, also the author must expose the results to the managers in Spain and to the whole team, which is around one hundred specialists. In Spain, the Test Performance methodology is apply, making it a success.
35 One of the key success factors is to follow the Change management steps and involve the significant part of the teams, besides capturing the knowledge helps that everyone empowered.
The other important point is that it is easy, and the result is a better performance of the app that can be tested, also the consultants that applied become better developers and gain Qlik knowledge faster. For junior consultants that are learning, the software becomes a secure form to gain independence and understand the usage.
36
6. CONCLUSIONS
The leading software used in the internship is Qlik Sense that with the Data discovery let the user improve and understand the relationships of the data, and let the software be one of the principal leaders in the Business Intelligence Software.
The objective of creating a web dashboard for the Janssen managers of the EMEA region was complete, with all the User Stories approved, the business information that the EMEA managers need to make decisions displays in graphics and Key Performance Indicators.
To succeed, dashboards must-have KPI with all the aspects that are strategy, targets, range, encodings, time frames, and Benchmarks as the ones developed in the Web-dashboard. The business owners give excellent feedback and accept the developed work.
The web-based navigation gives easy to use dashboard, with menus and selections as standard webs, facilitating the navigations and saves the company to invest in the manager's training, also with the web there is more freedom in the placement and space of the object.
The Qlik Sense Performance Methodology follows the seven steps of the Kotter methodology for Change Management; This allows having a strategy to adopt the change, one of the most important aspects is to have a backup from the directives and that the team understands the sense of urgency. One of the principal goals is to improve the performance of the apps through innovation in the development process. As Qlik works in memory, the RAM and CPU reduction determines the performance, as showed in the CIE index app, the Qlik Sense Methodology allowed through four easy steps to achieve the goal. The four steps, Excel Check List, Data Analyzer, Scalability tools, and Guarantee presentation, are easy to use and helps any developer that follows it to understand the Qlik Software and improve its skills.
To get engagement is also essential to have early victories as the Document Analyzer that is an unknown free tool with benefits to understand the flags of a Qlik Sense app. The mix of the Change Management Methodology and the research in performance were the success factors that allow the Sense Test Performance Methodology to pass the Portugal border and replicates in Barcelona. Documentation with all the steps is delivered to the company; it includes the Ensemble folder structure to harmonize the future company developments, installation of the programs, and a PowerPoint boilerplate to present to the client with all the app performance as a result of the work. Finally, the decisive point is that all the persons of the company are sensitive and understand the urgency to deal with the RAM and CPU consumption, and the Test Performance Methodology is adopted. The author has to apply the master theory, and get strong skills in Qlik Sense, making the internship a valuable start in the Business Intelligence job market.
37
7. LIMITATIONS AND RECOMMENDATIONS FOR FUTURE WORKS
One of the most significant barriers is that besides that, the author has knowledge in web development, especially in HTML, CSS, and React but not in Angular. So, a couple of developments that could have more impact could not be developed because of the need to bring the paint the objects with external angular libraries like Picasso.
In the technology and consultant company, the personal rotation is big, in some cases, one consultant and has good ideas, but the next month was in another company.
The time to investigate, develop, and test is limited, and the knowledge capture was asking all the team and listen to their impressions. However, with more time, a Social Network study could be developed and have better results in the group to lead the implementation.
38
8. BIBLIOGRAFIA
Amazon. (2019). Obtido de https://aws.amazon.com/redshift/
Atlassian. (2019). Atlassia. Obtido de Jira: https://www.atlassian.com/software/jira/guides/use-cases/what-is-jira-used-for#Jira-for-requirements-&-test-case-management
Cronström, H. (2012). Symbol Tables and Bit Stuffed Pointers. Obtido de Qlik:
https://community.qlik.com/t5/Qlik-Design-Blog/Symbol-Tables-and-Bit-Stuffed-Pointers/ba-p/1475369
Diffen. (2019). https://www.diffen.com/. Obtido de
https://www.diffen.com/difference/Snowflake_Schema_vs_Star_Schema
Eckerson, W. (2009). Performance Management Strategies, How to create and deploy effective
metrics. The Data Ware House Institute.
FENG, W. (2004). Japan’s Wisdom: the melodies of Japanese People. Hsin Chao She Culture. Fink, E. M. (2007). Telling the Story—Best practices for using visual analysis to find and tell stories
from data. American Marketing Association presentation.
Gartner. (26 de 02 de 2018). Magic Quadrant for Analytics and Business Intelligence Platforms. George, S. (2012). computerweekly. Obtido de
https://www.computerweekly.com/tip/Inmon-or-Kimball-Which-approach-is-suitable-for-your-data-warehouse Kotter, J. P. (2012). Leading Change. Harvard Business Publishing.
Magdalena, R. (2012). Optimizing Time in Business with Business Intelligence Solution. Science Direct. NONAKA, I. K. (2014). ynamic fractal organizations for promoting knowledge-based transformation–A
new paradigm for organizational theory. European Management Journal, 137-146.
Pameça, P. (1997). The Data Mart: A nee approach to Data Warehousing. International Review of Law
Computers, 251-264.
Panoply. (2019). Panoply. Obtido de https://panoply.io/data-warehouse-guide/data-mart-vs-data-warehouse/
PMI. (2019). what-is-project-management. Obtido de pmi: https://www.pmi.org/about/learn-about-pmi/what-is-project-management
Power, D. (2002). A brief History of Decision Support Systems. DSS Resources. Pritchard, P. (2019). how-does-ram-work-with-the-cpu. Obtido de techwalla:
https://www.techwalla.com/articles/how-does-ram-work-with-the-cpu Qlik. (2019). diagnostictoolkit. Obtido de https://diagnostictoolkit.qlik-poc.com/
39 QLik. (2019). work with QVD files. Obtido de Qlik:
https://help.qlik.com/en- US/sense/November2019/Subsystems/Hub/Content/Sense_Hub/Scripting/work-with-QVD-files.htm
QLikView. (2013). DashBoard, Analysys Reporting(DAR). QlikView Technical Brief.
robotframework. (10 de 12 de 2019). robotframework. Obtido de https://robotframework.org ROSS, S. (2019). Invistopedia. Obtido de Invistopedia:
https://www.investopedia.com/ask/answers/112814/whats-difference-between-capital-expenditures-capex-and-operational-expenditures-opex.asp
Rouse, M. (2019). techtarget. Obtido de star schema:
https://searchdatamanagement.techtarget.com/definition/star-schema sales. (2 de 2019). rrg. Obtido de test2: www.test.com
Sansu, G. (2012). computerweekly. Obtido de https://www.computerweekly.com/tip/Inmon-or-Kimball-Which-approach-is-suitable-for-your-data-warehouse
Sliger, M. ( 2011). Agile project management with Scrum. PMI® Global Congress. Dallas, TX: PA: Project Management Institute.
Soejarto. (2003). Tough Times Call for Business Intelligence Services, an Indisputable Area of Growth.
9th Americas Conference on Information Systems. ampa, FL, USA.
Watson H.J, B. W. (2010). The BI-based Organization. International Journal of Business Intelligence
Research, 13-28.
Watson, H. J. (2009). Tutorial: Business Intelligence – Past, Present, and Future. Communications of
the Association for Information Systems, pp. Vol 25, art 39.
Wayne, E. (2009). Performance Management Strategies, How to create and deploy effective metrics. The Data Ware House Institute.
Wertz, J. (2017). Forbes. Obtido de Why Site Speed & Design Can Make Or Break Your Google Ranking?: https://www.forbes.com/sites/jiawertz/2017/07/17/why-site-speed-design-can-make-or-break-your-google-ranking/
Wieder, B. M. (2015). The Impact of Business Intelligence on the Quality of Decision Making – A Mediation Model. Procedia Computer Science, pp. 1163-1171.
WUNDERLICH, R. (10 de 01 de 2017). the-document-analyzer-compare-tool. Obtido de qlikviewcookbook: https://qlikviewcookbook.com/2017/01/the-document-analyzer-compare-tool/