R E S E A R C H A R T I C L E
Open Access
Socio-demographic and behavioural determinants
of weight gain in the Swiss population
Filipa Guerra
1, Silvia Stringhini
2, Peter Vollenweider
3, Gérard Waeber
3and Pedro Marques-Vidal
2,3*Abstract
Background: In Switzerland, socio-demographic and behavioural factors are associated with obesity, but no study ever assessed their impact on weight gain using prospective data.
Methods: Data from 4,469 participants (53.0% women), aged 35 to 75 years at baseline and followed for 5.5 years. Weight gain was considered as a rate (kg/year) or as gaining≥5 kg during the study period.
Results: Rate of weight gain was lower among participants who were older (mean ± standard deviation: 0.46 ± 0.92, 0.33 ± 0.88, 0.21 ± 0.86 and 0.06 ± 0.74 kg/year in participants aged [35-45], [45-55], [55–65] and [65+] years,
respectively, P<0.001); physically active (0.27 ± 0.82 vs. 0.35 ± 0.95 kg/year for sedentary, P < 0.005) or living in couple (0.29 ± 0.84 vs. 0.35 ± 0.96 kg/year for living single, P < 0.05), and higher among current smokers (0.41 ± 0.97, 0.26 ± 0.84 and 0.29±0.85 kg/year for current, former and never smokers, respectively, p<0.001). These findings were further confirmed by multivariable analysis. Multivariable logistic regression showed that receiving social help, being a current smoker or obese increased the likelihood of gaining≥5 Kg: Odds ratio (OR) and 95% confidence interval (CI) 1.43 (1.16-1.77); 1.63 (1.35-1.95) and 1.95 (1.57-2.43), respectively, while living in couple or being physically active decreased the risk: 0.73 (0.62-0.86) and 0.72 (0.62-0.83), respectively. No association was found between weight gain and gender, being born in Switzerland or education.
Conclusions: In Switzerland, financial difficulties (indicated by receiving social help) and current smoking were associated with increases in body weight over a 5 years follow-up. Living in couple, being older or physically active were protective against weight gain.
Keywords: Weight gain, Socio-demographic, Prospective study, Switzerland, Population-based Background
Worldwide prevalence of obesity almost doubled between 1980 and 2008 [1] and a similar trend has been observed in Switzerland [2]. Several socio-demographic and behav-ioural factors have been shown to influence weight gain. A consistent positive association between marital status [3], occupational position [4], low educational level, economic difficulties [5] and weight gain has been reported. Still, the impact of SES on weight gain might differ according to gender [6] or to the country’s level of socioeconomic de-velopment– while in high income countries a high socio-economic status (SES) is generally related to a lower
prevalence of obesity, the opposite association is found in low income countries [7].
In Switzerland, several cross-sectional studies have shown an inverse association between obesity and socio-demographic and behavioural factors [8,9], but whether socio-demographic and behavioural factors have an im-pact on weight gain has never been investigated prospect-ively. Indeed, one of the main objectives of the Swiss national programme on healthy eating and physical activ-ity (PNAAP) is achieving a health weight [10] and such data are important for adequately designing health promo-tion policies and to evaluate their impact in the target population.
Thus, we aimed to assess the socio-demographic and behavioural determinants of weight gain, using prospect-ive data from the Swiss population-based CoLaus study.
* Correspondence:[email protected]
2
Institute of Social and Preventive Medicine, Lausanne University Hospital, Lausanne, Switzerland
3
Department of Internal Medicine, Lausanne University Hospital (CHUV), Rue du Bugnon 46, Lausanne 1011, Switzerland
Full list of author information is available at the end of the article
© 2015 Guerra et al.; licensee BioMed Central. This is an Open Access article distributed under the terms of the Creative Commons Attribution License (http://creativecommons.org/licenses/by/4.0), which permits unrestricted use, distribution, and reproduction in any medium, provided the original work is properly credited. The Creative Commons Public Domain Dedication waiver (http://creativecommons.org/publicdomain/zero/1.0/) applies to the data made available in this article, unless otherwise stated.
Methods
The Cohorte Lausannoise (CoLaus) study
The CoLaus study is a population-based study assessing the clinical, biological and genetic determinants of cardio-vascular disease in the city of Lausanne, Switzerland [11]. The initial recruitment took place between June 2003 and May 2006 and enrolled 6,733 participants (3,544 women) aged 35–75 years; participation rate was 41%.
Follow-up was conducted between April 2009 and September 2012 and included all participants of the baseline study willing to participate. At follow-up, partic-ipants attended a single visit which included, as in the baseline assessment, an interview, a physical exam, and blood and urine collections in the fasting state. Average follow-up time was 5.5 years.
Socio-economic data
Educational level was categorized as primary, secondary school, apprenticeship and university. Nationality was defined by the country of birth and categorized into Swiss and the most frequent nationalities in the canton (French, Italian, Portuguese and Spanish) and other. Marital status was categorized into living in couple (married and other relationship) or living alone (single, divorced or widowed).
Receiving social help was assessed with the question: “Do you receive social help?”. Because all individuals res-iding in Switzerland receive financial compensation when they retire, the response to this variable is not in-formative beyond the retirement age. Therefore, men older than 65 years and women older than 63 or 64 years were not considered as receiving social help (N = 638). In Switzerland, social help is provided as financial sup-port to people with disabilities or whose income is insuf-ficient to support themselves or their family, and can thus be considered as an indicator of financial adversity.
Clinical and anthropometric data
Smoking status was defined as never, former and current. Physical activity was self-reported and partici-pants were considered as physically active if they re-ported practicing leisure time physical activity at least twice per week. Body weight, height and waist circum-ference (WC) were measured using standard procedures [11]. The same procedure was used in the baseline and follow-up examinations. BMI was defined as weight (kg)/height(m)2. Normal BMI was defined as BMI < 25 kg/m2, overweight as 25≤BMI<30 kg/m2and obesity as BMI≥30 kg/m2
. Abdominal obesity was defined as WC≥102 cm for men and WC ≥ 88 cm for women.
Weight gain was considered in two ways. First, as a continuous variable representing the rate of weight gain, computed as the difference between the follow-up and baseline weight divided by the number of years of the
follow-up (Kg/year). Second, as having or not having gained 5 Kg or more during the follow-up; the 5 Kg cut-off was chosen according to the recommendations of the World Health Organization that weight gain in adulthood should not exceed 5 Kg over the entire adult life [12].
Ethics
The study was approved by the Institutional Ethics Committee of the University of Lausanne and all partici-pants provided written informed consent.
Statistical analysis
Analyses were conducted after excluding participants without BMI at baseline or follow-up, without SES data at baseline. As illness could lead to involuntary weight loss, participants who reported involuntary weight loss during the last 12 months at follow-up were also excluded.
Statistical analyses were performed using Stata version 12.0 for Windows (Stata Corp, College Station, Texas, USA). Descriptive results were expressed as number of participants (percentage) or as mean ± standard deviation. Bivariate analyses were performed using chi-square or Fisher's exact test for qualitative variables and one-way analysis of variance (ANOVA) for quantitative variables. Multivariable analyses were performed using ANOVA or logistic regression and results were expressed as multivar-iable adjusted mean ± standard error for ANOVA or as Odds ratio (OR) and 95% confidence interval (CI) for lo-gistic regression. In multivariable analyses, several models were considered – adjusted only for age and gender and adjusted for all the variables significantly associated with weight gain. As BMI and waist were correlated, two separ-ate multivariable models were tested (one with BMI and another with waist). Statistical significance was considered for p < 0.05.
Results
Characteristics of the participants
Of the initial 5,064 participants with follow-up data, 67 (1.3%) were excluded because of missing values on BMI at baseline or follow-up and 528 (10.4%) because of in-voluntary weight loss during the last 12 months. The socio-demographic and anthropometric characteristics of the remaining 4,469 participants are summarized in Table 1.
Determinants associated with weight gain
Bivariate analysis of the baseline factors associated with rate of weight gain or weight gain≥5 Kg are summarized in Table 1. Rate of weight gain decreased with age, and was lower among participants born in Switzerland, living in couple or physically active. Obese (BMI or abdominal) participants had a lower rate of weight gain, while current smokers had a higher rate. Receiving social help
tended to be associated with weight gain (p = 0.06). The factors associated with a weight gain≥5 Kg were similar, although the association with being born in Switzerland was no longer significant, while receiving social help be-came significant.
Results of multivariable analyses adjusting for age and gender (model 1) and for the main confounders (model 2) are summarized in Table 2. Weight gain rate was nega-tively associated with age, living in couple and being phys-ically active, and positively associated with current smoking. Weight gain rate was also associated with na-tionality (other than Portuguese), while no significant rela-tionship was found with being Swiss born or BMI status. Multivariable logistic regression on gaining ≥5 Kg pro-vided similar results, i.e. that older vs. younger participants and those living in couple vs. alone had, respectively, a 62% (95% CI: 0.28-0.51) and a 27% (95% CI: 0.62-0.86) de-creased risk of weight gain, while current vs. never smokers had a 63% increased risk (95% CI: 1.35-1.95). Par-ticipants receiving social help had a 43% higher likelihood (95% CI: 1.16-1.77) of gaining≥5 kg.
Repeating the same analyses on the whole sample (i.e. including participants who were initially excluded from
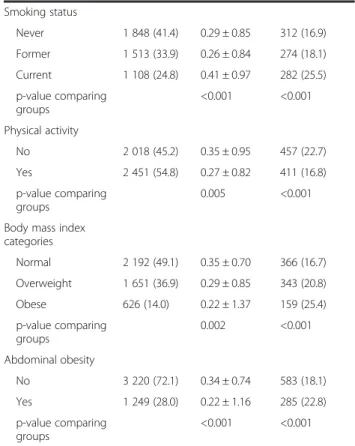
Table 1 Sample characteristics (N = 4,469) at baseline and factors associated with weight gain, excluding participants reporting involuntary weight loss
All participants Weight gain (kg/year) Gain≥5 kg (%) N 4,469 868
Age group N (%) Mean ± SD N (%)
[35-45] 1 390 (31.1) 0.46 ± 0.92 334 (24.0) [45-55] 1 344 (30.1) 0.33 ± 0.88 272 (20.2) [55-65] 1 178 (26.4) 0.21 ± 0.86 202 (17.2) [65–75] 557 (12.5) 0.06 ± 0.74 60 (10.8) p-value comparing groups <0.001 <0.001 Gender Women 2 369 (53.0) 0.31 ± 0.92 461 (19.5) Men 2 100 (47.0) 0.31 ± 0.84 407 (19.4) p-value comparing groups 0.90 0.95 Born in Switzerland No 1 660 (37.1) 0.34 ± 0.85 340 (20.5) Yes 2 809 (62.9) 0.29 ± 0.90 528 (18.8) p-value comparing groups <0.05 0.17 Nationality Swiss 2 809 (62.9) 0.29 ± 0.90 528 (18.8) French 285 (6.4) 0.35 ± 0.77 54 (19.0) Italian 238 (5.3) 0.41 ± 0.87 56 (23.5) Portuguese 226 (5.1) 0.24 ± 0.91 36 (15.9) Spanish 157 (3.5) 0.36 ± 0.80 34 (21.7) Other 754 (16.9) 0.35 ± 0.86 160 (21.2) p-value comparing groups 0.12 0.21
Receiving social help
No 3 930 (87.9) 0.30 ± 0.86 728 (18.5) Yes 539 (12.1) 0.37 ± 1.00 140 (26.0) p-value comparing groups 0.06 <0.001 Marital status Living alone 1 414 (31.7) 0.35 ± 0.96 316 (22.4) Living in couple 3 052 (68.3) 0.29 ± 0.84 552 (18.1) p-value comparing groups <0.05 <0.001 Educational level Primary 755 (16.9) 0.30 ± 0.98 150 (19.9) Apprenticeship 1 579 (35.3) 0.29 ± 0.92 324 (20.5) Secondary school 1 158 (25.9) 0.31 ± 0.86 217 (18.7) University 977 (21.9) 0.32 ± 0.76 177 (18.1) p-value comparing groups 0.84 0.44
Table 1 Sample characteristics (N = 4,469) at baseline and factors associated with weight gain, excluding participants reporting involuntary weight loss (Continued)
Smoking status Never 1 848 (41.4) 0.29 ± 0.85 312 (16.9) Former 1 513 (33.9) 0.26 ± 0.84 274 (18.1) Current 1 108 (24.8) 0.41 ± 0.97 282 (25.5) p-value comparing groups <0.001 <0.001 Physical activity No 2 018 (45.2) 0.35 ± 0.95 457 (22.7) Yes 2 451 (54.8) 0.27 ± 0.82 411 (16.8) p-value comparing groups 0.005 <0.001
Body mass index categories Normal 2 192 (49.1) 0.35 ± 0.70 366 (16.7) Overweight 1 651 (36.9) 0.29 ± 0.85 343 (20.8) Obese 626 (14.0) 0.22 ± 1.37 159 (25.4) p-value comparing groups 0.002 <0.001 Abdominal obesity No 3 220 (72.1) 0.34 ± 0.74 583 (18.1) Yes 1 249 (28.0) 0.22 ± 1.16 285 (22.8) p-value comparing groups <0.001 <0.001 Results are expressed as average ± standard deviation or as number of participants (percentage). Statistical analysis by chi-square or analysis of variance.
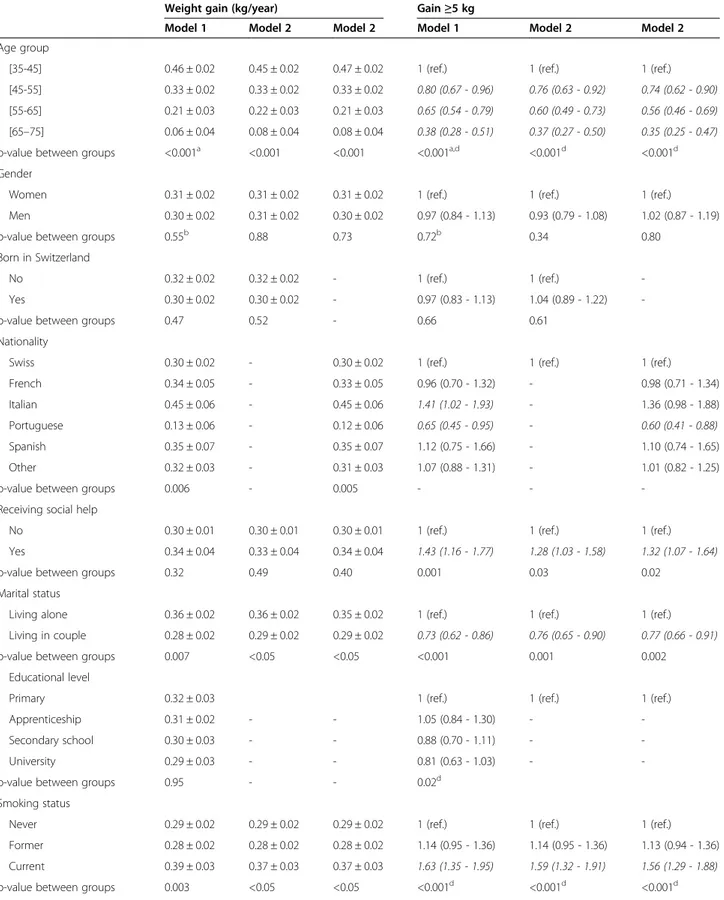
Table 2 Multivariable analysis of the factors associated with weight gain (N = 4,469), excluding participants reporting involuntary weight loss at follow-up
Weight gain (kg/year) Gain≥5 kg
Model 1 Model 2 Model 2 Model 1 Model 2 Model 2
Age group
[35-45] 0.46 ± 0.02 0.45 ± 0.02 0.47 ± 0.02 1 (ref.) 1 (ref.) 1 (ref.)
[45-55] 0.33 ± 0.02 0.33 ± 0.02 0.33 ± 0.02 0.80 (0.67 - 0.96) 0.76 (0.63 - 0.92) 0.74 (0.62 - 0.90)
[55-65] 0.21 ± 0.03 0.22 ± 0.03 0.21 ± 0.03 0.65 (0.54 - 0.79) 0.60 (0.49 - 0.73) 0.56 (0.46 - 0.69)
[65–75] 0.06 ± 0.04 0.08 ± 0.04 0.08 ± 0.04 0.38 (0.28 - 0.51) 0.37 (0.27 - 0.50) 0.35 (0.25 - 0.47)
p-value between groups <0.001a <0.001 <0.001 <0.001a,d <0.001d <0.001d
Gender
Women 0.31 ± 0.02 0.31 ± 0.02 0.31 ± 0.02 1 (ref.) 1 (ref.) 1 (ref.)
Men 0.30 ± 0.02 0.31 ± 0.02 0.30 ± 0.02 0.97 (0.84 - 1.13) 0.93 (0.79 - 1.08) 1.02 (0.87 - 1.19)
p-value between groups 0.55b 0.88 0.73 0.72b 0.34 0.80
Born in Switzerland
No 0.32 ± 0.02 0.32 ± 0.02 - 1 (ref.) 1 (ref.)
-Yes 0.30 ± 0.02 0.30 ± 0.02 - 0.97 (0.83 - 1.13) 1.04 (0.89 - 1.22)
-p-value between groups 0.47 0.52 - 0.66 0.61
Nationality
Swiss 0.30 ± 0.02 - 0.30 ± 0.02 1 (ref.) 1 (ref.) 1 (ref.)
French 0.34 ± 0.05 - 0.33 ± 0.05 0.96 (0.70 - 1.32) - 0.98 (0.71 - 1.34)
Italian 0.45 ± 0.06 - 0.45 ± 0.06 1.41 (1.02 - 1.93) - 1.36 (0.98 - 1.88)
Portuguese 0.13 ± 0.06 - 0.12 ± 0.06 0.65 (0.45 - 0.95) - 0.60 (0.41 - 0.88)
Spanish 0.35 ± 0.07 - 0.35 ± 0.07 1.12 (0.75 - 1.66) - 1.10 (0.74 - 1.65)
Other 0.32 ± 0.03 - 0.31 ± 0.03 1.07 (0.88 - 1.31) - 1.01 (0.82 - 1.25)
p-value between groups 0.006 - 0.005 - -
-Receiving social help
No 0.30 ± 0.01 0.30 ± 0.01 0.30 ± 0.01 1 (ref.) 1 (ref.) 1 (ref.)
Yes 0.34 ± 0.04 0.33 ± 0.04 0.34 ± 0.04 1.43 (1.16 - 1.77) 1.28 (1.03 - 1.58) 1.32 (1.07 - 1.64)
p-value between groups 0.32 0.49 0.40 0.001 0.03 0.02
Marital status
Living alone 0.36 ± 0.02 0.36 ± 0.02 0.35 ± 0.02 1 (ref.) 1 (ref.) 1 (ref.)
Living in couple 0.28 ± 0.02 0.29 ± 0.02 0.29 ± 0.02 0.73 (0.62 - 0.86) 0.76 (0.65 - 0.90) 0.77 (0.66 - 0.91)
p-value between groups 0.007 <0.05 <0.05 <0.001 0.001 0.002
Educational level
Primary 0.32 ± 0.03 1 (ref.) 1 (ref.) 1 (ref.)
Apprenticeship 0.31 ± 0.02 - - 1.05 (0.84 - 1.30) -
-Secondary school 0.30 ± 0.03 - - 0.88 (0.70 - 1.11) -
-University 0.29 ± 0.03 - - 0.81 (0.63 - 1.03) -
-p-value between groups 0.95 - - 0.02d
Smoking status
Never 0.29 ± 0.02 0.29 ± 0.02 0.29 ± 0.02 1 (ref.) 1 (ref.) 1 (ref.)
Former 0.28 ± 0.02 0.28 ± 0.02 0.28 ± 0.02 1.14 (0.95 - 1.36) 1.14 (0.95 - 1.36) 1.13 (0.94 - 1.36)
Current 0.39 ± 0.03 0.37 ± 0.03 0.37 ± 0.03 1.63 (1.35 - 1.95) 1.59 (1.32 - 1.91) 1.56 (1.29 - 1.88)
the analysis) led to similar findings, except that the dif-ference in rate of weight gain between physically active and non-active participants was no longer significant, and that the increased likelihood of gaining ≥5 kg was borderline significant among participants receiving social help (Additional file 1: Table S1).
Discussion
To our knowledge, this is the first study that assessed the socio-demographic determinants of weight gain in the general Swiss adult population. Our results suggest that weight gain is negatively associated with age, Portuguese nationality, living in couple and physical activity, and posi-tively associated with current smoking, receiving social help and obesity. Conversely, no association between weight gain and educational level was found.
The fact that younger people tend to gain more weight is in accordance with other studies [13]. This can prob-ably be explained by the ceiling phenomenon of weight gain through life, which means that because older people are heavier, they are less likely to gain weight. No differ-ence in weight gain was found between normal weight, overweight and obese participants; conversely, obese par-ticipants had an increased likelihood of gaining ≥5 kg. A possible explanation is that besides the substantial group of obese patients with weight gain≥5 kg, there was also a large group of obese patients with weight loss, most likely due to medical reasons. Indeed, the prevalence of obese subjects with weight loss (40%) was higher than in over-weight (36%) or normal over-weight (29%) participants (<0.001). Our results thus suggest that many obese participants tend to lose weight, but that this trend is overcompensated by a
significant fraction of obese participants who gained more than 5 kg during the study period. Also, many normal weight or overweight participants tend to gain weight, but less than 5 kg (Figure 1).
Being married (and particularly the marital transition to being married) has been associated with an increase in body weight in most [3,14,15] but not all [16] studies. In this study, living in couple was strongly protective against weight gain, and adjusting for other family covariates such as having children did not change the results (adjusted mean ± sem: 0.36 ± 0.02 vs. 0.29 ± 0.02 kg/year for living alone vs. living in couple, p < 0.05). A possible explanation is the positive effect of living in couple on health-related be-haviours [17,18], but further studies are needed to better as-sess this point.
Table 2 Multivariable analysis of the factors associated with weight gain (N = 4,469), excluding participants reporting involuntary weight loss at follow-up (Continued)
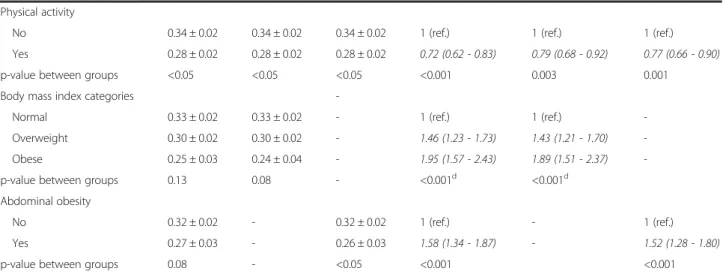
Physical activity
No 0.34 ± 0.02 0.34 ± 0.02 0.34 ± 0.02 1 (ref.) 1 (ref.) 1 (ref.)
Yes 0.28 ± 0.02 0.28 ± 0.02 0.28 ± 0.02 0.72 (0.62 - 0.83) 0.79 (0.68 - 0.92) 0.77 (0.66 - 0.90)
p-value between groups <0.05 <0.05 <0.05 <0.001 0.003 0.001
Body mass index categories
-Normal 0.33 ± 0.02 0.33 ± 0.02 - 1 (ref.) 1 (ref.)
-Overweight 0.30 ± 0.02 0.30 ± 0.02 - 1.46 (1.23 - 1.73) 1.43 (1.21 - 1.70)
-Obese 0.25 ± 0.03 0.24 ± 0.04 - 1.95 (1.57 - 2.43) 1.89 (1.51 - 2.37)
-p-value between groups 0.13 0.08 - <0.001d <0.001d
Abdominal obesity
No 0.32 ± 0.02 - 0.32 ± 0.02 1 (ref.) - 1 (ref.)
Yes 0.27 ± 0.03 - 0.26 ± 0.03 1.58 (1.34 - 1.87) - 1.52 (1.28 - 1.80)
p-value between groups 0.08 - <0.05 <0.001 <0.001
OR: Odds Ratio; BMI: Body Mass Index. Results are expressed as multivariable adjusted mean ± standard error of the mean (sem) or as odds-ratio (OR) and (95% CI). Statistical analysis by analysis of variance or logistic regression. Model 1, adjusting for age and gender, excepta
adjusted for gender only;b
adjusted for age only; Model 2, adjusted for all the variables in the model (indicated in the column);d
p-value of the test for trend;−, not included in the model. Statistically significant (p < 0.05) ORs are indicated in italic.
Figure 1 Proportion of normal weight, overweight and obese participants who had a weight gain≥5 kg, 0 ≤ . <5 kg and a weight loss between baseline and follow-up (N = 4469).
Smoking at baseline was positively associated with weight gain, and this association persisted after multivari-able adjustment. A possible explanation is that some smokers quit during follow-up, which led to increased weight [19], although this statement has been challenged [20]. Other explanations include a less healthy lifestyle of smokers (i.e. less healthy eating and less physical activity) and also the positive association between number of ciga-rettes smoked and central fat accumulation [21] and a J-or U-shaped association has also been found between waist circumference and visceral fat area with total lifetime smoking amount [22]. Hence, smoking should not be con-sidered as a method for weight maintenance, and the beneficial effects of smoking cessation on health largely overcome the effects of post-cessation weight gain [23].
Receiving social help was associated with an increased likelihood of gaining ≥5 kg over the follow up. In Switzerland, social help is provided as financial support to people with disabilities or whose income is insuffi-cient to support themselves or their family, and can thus be considered as an indicator of financial adversity. The association between receiving social help and weight gain was only partially attenuated after multivariable ad-justment. Similar to other studies [5], our results suggest that even in a wealthy country like Switzerland, financial difficulties are positively associated with weight gain, and that this association is independent from educa-tional level. One possible explanation is that financial difficulties might prompt a decrease in diet quality [24], but this aspect requires to be further investigated.
Low educational level has been shown to be associated with increased weight gain [5,25,26]. In this study, no sig-nificant association between education and weight gain was found, although participants with university education tended to be at lower risk of weight gain. A possible ex-planation might be a low statistical power due to a small sample size. Also, given the large educational differences in obesity at baseline [9], ceiling effects may be at play, with people in the lowest educational category already having reached a plateau in obesity prevalence.
Strengths and limitations
The main strengths of this study are the use of prospect-ive data and of objectprospect-ive anthropometric measurements. This study also has limitations. First, 25% of participants at baseline were not followed-up and were thus not in-cluded in this analysis. Participants who accepted to be followed were significantly younger, more educated, more frequently born in Switzerland, received social help less frequently, were less frequently smokers and more frequently active than participants who refused follow-up (Additional file 2: Table S2). Second, no information was available regarding slimming diets at baseline, so it was not possible to adjust for this covariate. Third, a
considerable number of participants were foreigners, and education categorization might differ according to the educational system. However, to reduce this issue, we used broad categorizations of education, and almost all for-eigners came from European countries, where the educa-tional system is quite comparable. Finally, changes in some sociodemographic or behavioural factors during follow-up might have influenced weight gain. Still, taking into account the multiple possibilities (for instance, phys-ical activity would be split in four groups depending on baseline and follow-up status) would considerably compli-cate the model and increase the risk of small sized groups, leading to nonsignificant associations due to large confi-dence intervals of the estimators. Thus, and also consider-ing the relative short follow-up period, we chose to apply a classic analytical method, taking into account only the baseline data.
Policy implications
Our results are important for public health professionals and policy makers for several reasons. First, being physic-ally active was negatively associated with weight gain, sup-porting the importance of promoting physical activity, also through environments favouring the practice of physical activity [27,28]. Second, participants with financial difficul-ties had a higher tendency to gain weight over the follow-up, probably due to their intake of caloric-dense, less expensive foods [29-31]. Importantly, several randomized controlled trials have shown that education alone does not impact the purchase of healthy foods, and that cost reduc-tion and/or promoreduc-tions are needed to increase fruit and vegetable intake [32-34]. Thus, efforts should be made in the promotion of healthy eating, namely by decreasing the costs of healthy foods rather than just implementing food education campaigns. Finally, the fact that current smokers have an increased risk of gaining over 5 kg could be used as an additional argument for prompting smoking cessation.
Conclusions
In Switzerland, financial difficulties and current smoking are positively associated with weight gain and living in couple, being older or physically active are negatively associated with weight gain.
Additional files
Additional file 1: Table S1. Multivariate analysis of the factors associated with weight gain (N = 4,997), including participants reporting involuntary weight loss.
Additional file 2: Table S2. Comparison of the baseline characteristics between participants who refused (N=1573) and who accepted (N = 4968) follow-up.
Competing interests
Authors’ contributions
FG made most of the statistical analyses and wrote most of the manuscript; PMV made part of the statistical analysis and wrote part of the manuscript; SS provided guidance for the statistical analyses and wrote part of the manuscript. PV and GW revised the manuscript for important intellectual content. PMV had full access to the data and is the guarantor of the study. All authors read and approved the final manuscript.
Acknowledgements
The CoLaus study was supported by grants from the Swiss National Science Foundation [grant no: 33CSCO-122661 and FN 33CSC0-139468]; GlaxoSmithKline and the Faculty of Biology and Medicine of Lausanne, Switzerland. FG was supported by a Scientific Mobility Grant from the Lisbon Faculty of Medicine/ Calouste Gulbenkian Foundation. SS is supported by an Ambizione Grant (n° PZ00P3_147998) from the Swiss National Science Foundation (SNSF).
Author details
1Faculty of Medicine, University of Lisbon, Lisbon, Portugal.2Institute of
Social and Preventive Medicine, Lausanne University Hospital, Lausanne, Switzerland.3Department of Internal Medicine, Lausanne University Hospital
(CHUV), Rue du Bugnon 46, Lausanne 1011, Switzerland.
Received: 15 August 2014 Accepted: 20 January 2015
References
1. Finucane MM, Stevens GA, Cowan MJ, Danaei G, Lin JK, Paciorek CJ, et al. National, regional, and global trends in body-mass index since 1980: systematic analysis of health examination surveys and epidemiological studies with 960 country-years and 9.1 million participants. Lancet. 2011;377(9765):557–67. 2. Faeh D, Braun J, Bopp M. Prevalence of obesity in Switzerland 1992–2007:
the impact of education, income and occupational class. Obes Rev. 2011;12(3):151–66.
3. Dinour L, Leung MM, Tripicchio G, Khan S, Yeh MC. The Association between Marital Transitions, Body Mass Index, and Weight: A Review of the Literature. J Obes. 2012;2012:294974.
4. Dugravot A, Sabia S, Stringhini S, Kivimaki M, Westerlund H, Vahtera J, et al. Do socioeconomic factors shape weight and obesity trajectories over the transition from midlife to old age? Results from the French GAZEL cohort study. Am J Clin Nutr. 2010;92(1):16–23.
5. Loman T, Lallukka T, Laaksonen M, Rahkonen O, Lahelma E. Multiple socioeconomic determinants of weight gain: the Helsinki Health Study. BMC Public Health. 2013;13:259.
6. Al-Emrani F, Stafstrom M, Ostergren PO. The influences of childhood and adult socioeconomic position on body mass index: a longitudinal Swedish cohort study. Scand J Public Health. 2013;41(5):463–9.
7. Neuman M, Finlay JE, Davey Smith G, Subramanian SV. The poor stay thinner: stable socioeconomic gradients in BMI among women in lower- and middle-income countries. Am J Clin Nutr. 2011;94(5):1348–57. 8. Galobardes B, Costanza MC, Bernstein MS, Delhumeau C, Morabia A. Trends
in risk factors for lifestyle-related diseases by socioeconomic position in Geneva, Switzerland, 1993–2000: health inequalities persist. Am J Public Health. 2003;93(8):1302–9.
9. Stringhini S, Spencer B, Marques-Vidal P, Waeber G, Vollenweider P, Paccaud F, et al. Age and gender differences in the social patterning of cardiovascular risk factors in Switzerland: the CoLaus study. PLoS One. 2012;7(11):e49443. 10. Federal Office of Public Health: Programme National Alimentation Et Activité
Physicque (PNAAP) - rapport 2008–2012. In. Bern, Switzerland; 2013. 32. 11. Firmann M, Mayor V, Vidal PM, Bochud M, Pecoud A, Hayoz D, et al. The
CoLaus study: a population-based study to investigate the epidemiology and genetic determinants of cardiovascular risk factors and metabolic syndrome. BMC Cardiovasc Disord. 2008;8:6.
12. Obesity: preventing and managing the global epidemic. Report of a WHO consultation. World Health Organ Tech Rep Ser. 2000;894:i–xii. 1–253. 13. Sheehan TJ, DuBrava S, DeChello LM, Fang Z. Rates of weight change for
black and white Americans over a twenty year period. Int J Obes Relat Metab Disord. 2003;27(4):498–504.
14. Lahmann PH, Lissner L, Gullberg B, Berglund G. Sociodemographic factors associated with long-term weight gain, current body fatness and central adiposity in Swedish women. Int J Obes Relat Metab Disord. 2000;24(6):685–94.
15. Rissanen AM, Heliovaara M, Knekt P, Reunanen A, Aromaa A. Determinants of weight gain and overweight in adult Finns. Eur J Clin Nutr.
1991;45(9):419–30.
16. van Lenthe FJ, Droomers M, Schrijvers CT, Mackenbach JP. Socio-demographic variables and 6 year change in body mass index: longitudinal results from the GLOBE study. Int J Obes Relat Metab Disord.
2000;24(8):1077–84.
17. Kiecolt-Glaser JK, Newton TL. Marriage and health: his and hers. Psychol Bull. 2001;127(4):472–503.
18. Umberson D. Gender, marital status and the social control of health behavior. Soc Sci Med. 1992;34(8):907–17.
19. Filozof C, Fernandez Pinilla MC, Fernandez-Cruz A. Smoking cessation and weight gain. Obes Rev. 2004;5(2):95–103.
20. John U, Meyer C, Rumpf HJ, Schumann A, Dilling H, Hapke U. No considerable long-term weight gain after smoking cessation: evidence from a prospective study. Eur J Cancer Prev. 2005;14(3):289–95.
21. Clair C, Chiolero A, Faeh D, Cornuz J, Marques-Vidal P, Paccaud F, et al. Dose-dependent positive association between cigarette smoking, abdominal obesity and body fat: cross-sectional data from a population-based survey. BMC Public Health. 2011;11:23.
22. Kim JH, Shim KW, Yoon YS, Lee SY, Kim SS, Oh SW. Cigarette smoking increases abdominal and visceral obesity but not overall fatness: an observational study. PLoS One. 2012;7(9):e45815.
23. Clair C, Rigotti NA, Porneala B, Fox CS, D'Agostino RB, Pencina MJ, et al. Association of smoking cessation and weight change with cardiovascular disease among adults with and without diabetes. Jama. 2013;309(10):1014–21. 24. Drewnowski A, Monsivais P, Maillot M, Darmon N. Low-energy-density diets
are associated with higher diet quality and higher diet costs in French adults. J Am Diet Assoc. 2007;107(6):1028–32.
25. Ball K, Crawford D. Socioeconomic status and weight change in adults: a review. Soc Sci Med. 2005;60(9):1987–2010.
26. Baltrus PT, Everson-Rose SA, Lynch JW, Raghunathan TE, Kaplan GA. Socioeconomic position in childhood and adulthood and weight gain over 34 years: the Alameda County Study. Ann Epidemiol.
2007;17(8):608–14.
27. Li F, Harmer PA, Cardinal BJ, Bosworth M, Acock A, Johnson-Shelton D, et al. Built environment, adiposity, and physical activity in adults aged 50–75. Am J Prev Med. 2008;35(1):38–46.
28. Sallis JF, Cervero RB, Ascher W, Henderson KA, Kraft MK, Kerr J. An ecological approach to creating active living communities. Annu Rev Public Health. 2006;27:297–322.
29. Giskes K, Avendano M, Brug J, Kunst AE. A systematic review of studies on socioeconomic inequalities in dietary intakes associated with weight gain and overweight/obesity conducted among European adults. Obes Rev. 2010;11(6):413–29.
30. Drewnowski A, Darmon N, Briend A. Replacing fats and sweets with vegetables and fruits–a question of cost. Am J Public Health. 2004;94(9):1555–9.
31. Drewnowski A, Specter SE. Poverty and obesity: the role of energy density and energy costs. Am J Clin Nutr. 2004;79(1):6–16.
32. Waterlander WE, Steenhuis IH, de Boer MR, Schuit AJ, Seidell JC. Introducing taxes, subsidies or both: the effects of various food pricing strategies in a web-based supermarket randomized trial. Prev Med. 2012;54(5):323–30. 33. Waterlander WE, Steenhuis IH, de Boer MR, Schuit AJ, Seidell JC. The effects of a
25% discount on fruits and vegetables: results of a randomized trial in a three-dimensional web-based supermarket. Int J Behav Nutr Phys Act. 2012;9:11. 34. Ni Mhurchu C, Blakely T, Jiang Y, Eyles HC, Rodgers A. Effects of price discounts and tailored nutrition education on supermarket purchases: a randomized controlled trial. Am J Clin Nutr. 2010;91(3):736–47.