FREE THEMES
1 Departamento de Nutrição e Saúde, Centro de Ciências Biológicas e da Saúde, Universidade Federal de Viçosa. Av. Peter Henry Rolfs s/n, Campus Universitário. 36570-900 Viçosa MG Brasil. poliana. [email protected] 2 Instituto Federal do Maranhão Campus Barreirinhas. Barreirinhas MA Brasil.
3 Departamento de Nutrição, Universidade Federal do Espírito Santo. Vitória ES Brasil.
4 Programa de Pós-Graduação em Saúde Coletiva, Universidade Federal do Maranhão. São Luís MA Brasil.
5 Departamento de Nutrição, Escola de Enfermagem, Universidade Federal de Minas Gerais. Belo Horizonte MG Brasil.
Determinants of the mean growth rate of children
under the age of six months: a cohort study
Abstract This study aimed to investigate some factors that contributed to higher or lower growth rate of children up to the sixth month of life. This is a cohort study with 240 children evaluated in four stages. Variables of birth, eating habits of the child, mothers’ breast-feeding difficulty and pacifier use were investigated. Children’s weight gain rate (grams/day) and size gain (cm/month) were measured in all assessments and compared according to the variables of interest. In the first month, weight gain rate of children born by ce-sarean section was smaller. By the second month, the growth rate (weight and size gain) was higher among children who were exclusively or predomi-nantly breastfed and lower among those who con-sumed infant formula. Children of mothers who reported difficulty to breastfeed showed a lower growth rate until the second month. Children age four months who consumed porridge had lower weight and size gain rate. Pacifier use was asso-ciated with lower weight gain rates up the first, second and fourth month.
Key words Weight gain, Growth, Breastfeeding,
Infant
Poliana Cristina de Almeida Fonseca 1
Carolina Abreu de Carvalho 2
Sarah Aparecida Vieira Ribeiro 3
Luciana Neri Nobre 4
Milene Cristine Pessoa 5
Andreia Queiroz Ribeiro 1
Silvia Eloiza Priore 1
Fo
nse
ca PCA
Introduction
Child growth is influenced by maternal,
environ-mental, genetic and hormonal factors1. Proper
infant nutrition is one of the most important factors for growth, maturation and maintenance of bodily functions, as well as disease prevention. One of the main reasons for children growth
deficit is malnutrition1-3.
The first six months of life are considered a critical period, since it is the moment of
great-er growth rate4. According to the World Health
Organization (WHO)5, exclusive breastfeeding
(EBF) up to the sixth month is the ideal food to promote adequate growth at this stage.
Among the most important child health indi-cators is the monitoring of their physical growth, which reflects their current and intra-uterine life conditions, and can be assessed by simple
mea-sures such as weight and size2,6,7. These measures
performed repeatedly in a given period pro-vide better consistency in the assessment of the
growth period8.
The growth rate corresponds to increased weight, size or other anthropometric parameter in a given time interval (days or months, for ex-ample), representing the current growth dynam-ics. Anthropometric indices, in turn, reflect pre and postnatal cumulative growth attained at a
given age3,7,9.
In a paper published in 2009, WHO showed a growth rate pattern based on the Multicentre Growth Reference Study, but it strengthens the need to establish limits to which growth rate in-tervals specific disorders can be observed. The study on growth rate has a hypothetical advan-tage of early identification of growth problems. However, studies for this purpose are difficult to conduct due to scarce appropriate longitudinal
data.10
It has been interesting to evaluate growth in early childhood and its associated factors, con-sidering changes reflected in this process in the
medium and long term11. However, few studies
have proposed to evaluate the rate of weight and
size growth, as well as its determinants9. Some
Brazilian studies3,4,8,12,13 have investigated the
re-lationship between breastfeeding (BF) and child growth. Studies that evaluate infant growth rate according to the variables analyzed in this study are not common in Brazilian literature, whose objective is to investigate some factors that con-tributed to a higher or lower growth rate of in-fants up to the sixth month of life.
Methods
This is a cohort study with children monitored from birth until the six months of life of the mu-nicipality of Viçosa, Minas Gerais. The city is lo-cated in the Zona da Mata Mineira, has an area of
299.418 km2 and estimated population in 2014 of
76,745 residents with a per capita Gross
Domes-tic Product (GDP) of 11,256.07 reais14.
Children born in Viçosa from October 2011 to October 2012, who resided in the municipal-ity, were invited to take part in the study. The invitation to mothers occurred at childbirth at the maternity hospital where all the children of the municipality are born. A member of the project team was on call at the hospital awaiting hospitalization of pregnant women to carry out the invitation to participate in the research and scheduling the next consultations. Children were evaluated in the first, second, fourth and sixth month at the Municipal Polyclinic of Viçosa, ac-cording to the vaccination schedule.
Newborns with birth weight > 2,500 grams, gestational age > 37 weeks, single delivery and healthy children living in Viçosa-MG were in-cluded in the study. Children who did not meet the inclusion criteria were also followed up, but were not included in this study because they evi-denced growth specificities.
The team responsible for data collection was composed of six nutritionists, a nurse and nu-trition and nursing academics from the Federal University of Viçosa, with rotation among team members during the two years of data collection. A pilot study was conducted at the same loca-tion where data were collected, with children in the same age group and characteristics of those belonging to the study, which were not includ-ed. Prior to the onset of data collection, all team members were trained in the application of ques-tionnaire and anthropometry techniques.
e C
ole
tiv
a,
22(8):2713-2726,
2017
(18) were preterm, 2.4% (11) were born preterm and with low birth weight and 3.0% (14) were born with low birth weight, leaving out 417 eli-gible children. In the second month, 390 children were evaluated. In the fourth month, 336 dren attended, and in the sixth month, 240 chil-dren were counted, who participated in all four scheduled evaluations. Losses were analyzed for a possible selection bias, as described in the results of this study.
A semi-structured questionnaire was applied with sociodemographic, birth and child feeding practices. The type of delivery (vaginal and ce-sarean) and children’s weight and size at birth were investigated. Birth weight and size were ob-tained on the child’s card in the first evaluation (1 month of age). Children born with a weight greater than 2,500 and less than 3,000 grams were considered to be underweight at birth, and great-er than 4,000 grams with high birth weight.
The breastfeeding type, infant formula intake (yes or no), cow milk (yes or no) and porridge (yes or no) were surveyed in all evaluations. The breastfeeding type classification used WHO’s definitions recommended by the Ministry of Health, which classifies it as exclusive, predomi-nant, mixed or partial and supplemented
breast-feeding15. Mothers were questioned regarding the
intake of infant formula and cow milk, and these were counted regardless of breastfeeding, and it is possible to evaluate the introduction of these types of milk in infant feeding. Mothers were also asked about porridge consumption (cow milk with added sugar and flour) separately. Moth-ers’ breastfeeding difficulty and children’s use of pacifiers were also evaluated. Mothers were ques-tioned in all consultations regarding the early introduction of liquids and other food, such as water, tea and juice.
In all assessments (1st, 2nd, 4th and 6th month),
children’s weight and size were measured by pre-viously trained nutritionists and interns of the Nutrition course of the Federal University of
Viçosa, following standard WHO guidelines16.
Weight was measured using an electronic and digital pediatric scale, with a capacity of 15 kg and a 10-gram precision, always without clothes or diaper. Size was measured with the naked child, using a wooden infant anthropometer, with a ruler graduated from zero to 100 cm, with 1 mm-accuracy.
Children’s weight gain rate (grams/day) and size gain rate (centimeters/month) were calcu-lated from birth to the first, second, fourth and sixth month, as follows:
Weight gain rate (g/day) = (weight in the 1st,
2nd, 4th and 6th month – birth weight) / age in days
Size gain rate (g/day) = (size in the 1st, 2nd, 4th
and 6th months – size at birth) / age in days
Considering that the initial sample size was not predicted to evaluate the relationship be-tween growth rate (weight and size gain) and the variables of interest, the sample power was
calculated a posteriori to compare means in all
evaluated months, with 95% confidence interval. Considering the difference between weight gain rate means, power ranged from 90.8% to 99.8%. Regarding the difference between size gain rate, power ranged from 73.2% to 99.9%. Calculations were made in the OpenEpi program.
Regarding ethical aspects, mothers of the children signed the informed consent form ICF and were properly instructed regarding all the procedures, objectives and advantages of their participation. The Research Ethics Committee, Federal University of Viçosa, approved this study under protocol number 051/2012/CEPH, and the study was funded by the State of Minas Gerais Research Support Foundation.
Statistical analyses
Data was entered on a Microsoft Office Excel 2010 data sheet and all statistical analyses were conducted in Stata statistical software, version 10.0. For descriptive analysis, explanatory vari-ables (gender, delivery type, low birth weight, high birth weight, breastfeeding type, difficulty in breastfeeding, formula, cow milk, water, tea, juice and porridge consumption and use of paci-fiers) were described in percentages in the tables. Follow-up losses are common in cohort stud-ies. Thus, some child-related variables (gender, de-livery type and birth weight) were compared be-tween the monitored and non-monitored groups in order to evaluate possible selection bias using Pearson’s chi-square test and Student’s t-test.
The distribution of weight gain rate (WGR1, WGR2, WGR4 and WGR6) and size gain rate (SGR1, SGR2, SGR4 and SGR6) variables were analyzed with the Shapiro-Wilk test. For the analysis of the differences between the weight and size and the explanatory variables, statistical tests were used to compare mean/median values according to the growth rates’ distribution. When parametric, mean and standard deviation were shown, and non-parametric values were shown in medians and minimum and maximum values.
Fo
nse
ca PCA
parametric variables (WGR2, WGR1 and SGR6) when the response variable showed more than three groups (breastfeeding type). Non-para-metric variables (WGR1, WGR 4, WGR6, SGR2, SGR2 and SGR 4) were compared using the Mann-Whitney or Kruskal-Wallis test (post-hoc test: Dunn) when there were more than three groups in the qualitative variable (breastfeeding type). The level of rejection for the null hypoth-esis was p < 0.05.
Results
Table 1 shows the comparison between moni-tored and not monimoni-tored children, and it was ob-served that there was no statistical difference (p < 0.05) between the groups. Therefore, the results of this study are unlikely to evidence selection bias due to follow-up losses.
Of the 240 children evaluated up to six months, 52.5% were boys, whose mean age of mothers was 26 years (± 6 years), with a medi-an family income of 1,244 reais. Regarding birth, 72.9% were born from cesarean section, 25.4% with low weight and 5.4% with high weight.
Table 2 shows the growth rate (weight and size gain) of infants in the four evaluations, by gender, type of delivery and birth weight. The weight and size gain rate was higher in boys in all evaluations (p < 0.05) and there was a slowdown of weight-size gain as from the second month in both gen-ders. Only up to the first month, the weight gain rate (WGR1) of children born from cesarean sec-tion was lower (p = 0.022) and there was no dif-ference in the size gain rate. It was observed that the weight gain rate did not differentiate between children who were born underweight and over-weight. The mean size gain rate up to six months (SGR6) was higher among infants born with low weight (p = 0.035) and lower among those born with high birth weight (p = 0.006).
As observed in Table 3, the growth rate up to the first month was influenced by the child feed-ing practices in this period. Regardfeed-ing breast-feeding type, children who were exclusively or predominantly breastfed had a higher median WGR1 (p < 0.001). Children whose mothers re-ported some difficulty in breastfeeding, who used infant formula and consumed water showed low-er WGR1 (p < 0.001, p < 0.001 and p = 0.049). The mean SGR1 of children who consumed in-fant formula was also lower (p = 0.006).
Up to the second month, WGR2 and SGR2 were higher among infants exclusively or
pre-dominantly breastfed (p < 0.001 and p = 0.015, respectively), and lower among children con-suming infant formula (p < 0.001 and p < 0.001) and water (p = 0.019 and p = 0.033). Children of mothers who reported difficulty in breastfeed-ing had a lower average of WGR2 and SGR2 (p = 0.004 and p = 0.047). These data are shown in Table 4.
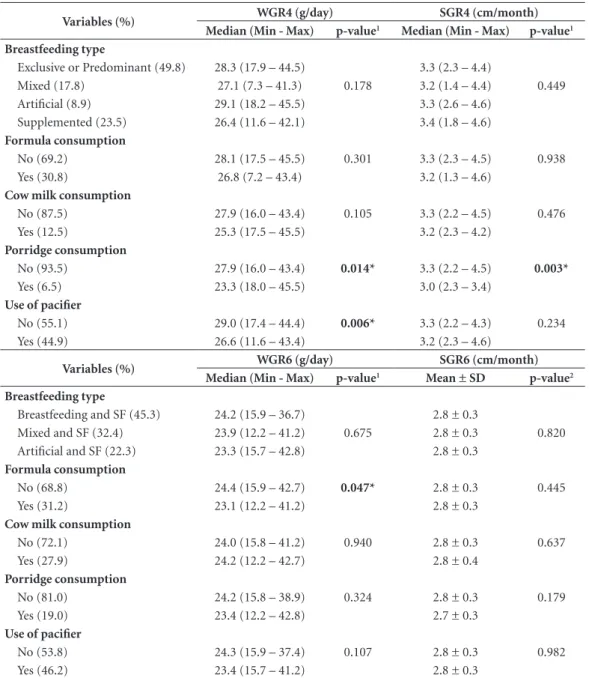
Table 5 shows the results for WGR and SGR up to the fourth and sixth month. There were no significant differences in growth rate means by breastfeeding type in the fourth and sixth month, as observed in the first two months. Four-month-old children who consumed por-ridge had lower values of WGR4 (p = 0.014) and SGR4 (p = 0.003). In the sixth month, only infant formula intake was associated with lower WGR6 values (p = 0.047). There were no associations between growth rate up to the fourth and sixth month with consumption of water, tea and fruit juice (the results of these analyses are not shown in Table 5).
There were no differences in the growth rate of children who consumed cow milk in any of the evaluations. Those who used pacifiers had the lowest WGR values up to the first (p = 0.023), second (p < 0.001) and fourth (p = 0.006) month, as observed in Tables 2, 3 and 4.
Discussion
This study aimed to evaluate the growth rate of children in the first six months of life, by gender and birth variables, as well as feeding practices, difficulty in breastfeeding reported by the mother and child’s use of pacifiers. We observed relevant results, not very common in literature, which can certainly contribute to a better understanding of some factors associated with child growth.
In all evaluations, weight and size gain rate
was higher among boys. Augusto e Souza et al.13,
studying 347 children, observed a higher rate of daily weight gain in boys during the first quarter.
In the study by Spyrides et al.8 with children up
to nine months of age, lower weight and size gain
rates were also observed among girls. A study4
that analyzed data from 181 children on exclusive breastfeeding (EBF) up to the sixth month of age found that boys’ weight gain was higher only in
the first quarter. The study by Mihrshahi et al.17
observed that male gender was a non-modifiable factor for rapid weight gain among children. Boys tend to have a higher birth weight and a faster
e C
ole
tiv
a,
22(8):2713-2726,
2017
Table 1. Characteristics of children monitored and not monitored from the first to the sixth month of life. Viçosa, Minas Gerais, 2011-2013.
Sample characterization Monitored
(n = 240)
Not monitored
(n = 177) p-value**
Gender % (n) % (n)
Male 55.3 (114) 44.7 (92) 0.366
Female 59.7 (126) 40.3 (85)
Type of delivery
Normal 56.5 (65) 43.5 (50) 0.792
C-section 57.9 (175) 42.1 (127)
Low birth weight (> 2500< 3000 g)
No 56.6 (179) 43.4 (137) 0.507
Yes 60.4 (61) 39.6 (40)
High birth weight (> 4000 g)
No 57.6 (227) 42.4 (167) 0.918
Yes 56.5 (13) 43.5 (10)
Size at birth (cm)
Mean ± Standard Deviation 49.2 ± 1.8 49.1 ± 1.9 0.671
* Totals may not add up to 417 (monitored and not monitored) across all variables due to some missing values; ** Pearson’s chi-square test or Student’s t-test.
Table 2. Growth rate (weight and size gain) by gender and variables of birth of children evaluated up to the first, second, fourth and sixth month of life of the municipality of Viçosa, Minas Gerais, 2011-2013.
Variables (%) WGR1 (g/day) WGR2 (g/day)
Median (Min - Max) p-value1 Mean ± SD p-value2
Gender
Male (52.5) 33.6 (-8.3 – 69.3) < 0.001* 34.2 ± 8.1 <0.001*
Female (47.5) 26.5 (-35.3 – 69.3) 28.8 ± 7.9 Type of delivery
Normal (27.1) 32.8 (1.3 – 63.7) 0.022* 32.1 ± 8.2 0.624 C-section (72.9) 29.2 (-35.3 – 69.3) 31.5 ± 8.6
Low BW
Yes (25.4) 31.0 (-6.7 – 69.3) 0.965 31.6 ± 8.0 0.979 No (74.6) 29.8 (-35.5 – 66.8) 31.6 ± 8.6
High BW
Yes (5.4) 29.1 (-35.3 – 57.3) 0.969 30.6 ± 14.3 0.633 No (94.6) 30.8 (-8.3 – 69.3) 31.7 ± 8.1
Variables (%) SGR1 (cm/month) SGR2 (cm/month)
Mean ±SD p-value2 Median (Min - Max) p-value1
Gender
Male (52.5) 4.0 ± 1.5 0.016* 3.9 (2.3 – 18.0) 0.001*
Female (47.5) 3.5 ± 1.5 3.5 (1.1 – 5.5) Type of delivery
Normal (27.1) 3.9 ± 1.6 0.245 3.5 (1.6 – 18.0) 0.879 C-section (72.9) 3.7 ± 1.5 3.8 (1.1 – 5.6)
Low BW
Yes (25.4) 3.7 ± 1.5 0.743 3.8 (1.6 – 5.9) 0.564
No (74.6) 3.8 ± 1.5 3.6 (1.1 – 18.0)
High BW
Yes (5.4) 3.0 ± 1.5 0.070 3.5 (1.1 – 18.0) 0.224
No (94.6) 3.8 ± 1.5 3.7 (1.6 – 5.9)
Fo
nse
ca PCA
Jaldin et al.4, which is based on other studies and
justifies this difference between genders by ana-tomical and physiological characteristics, where boys have larger body structures and muscle tis-sue and girls have lower birth weight. In view of the above, one would expect that higher growth
rates be observed among boys. WHO10 shows
distinct growth rate curves for girls and boys. Growth rate was progressive until the sec-ond month, gradually decelerating up to the sixth month in both genders, regardless of the breastfeeding type. This slowdown in weight
gain is also in line with previous studies2-4,13. In
the study by Longo et al.3, children on EBF and
predominant BF showed a higher growth rate up to three months, slowing down to five month
of age. According to Marques et al.2, regardless
of sex, after the fourth month, children on EBF
showed a reduction of about 50% in daily weight gain and in the monthly mean size increase.
Ac-cording to Rzehak et al.18, weight and size gain
rates are higher until the first three months after birth and decrease at different rates in the follow-ing periods. When it comes to breastfed infants, this rapid growth is due to the large volume of milk ingested and its recognized nutritional
val-ue and sufficiency in this initial phase19. A normal
growth deceleration is expected, regardless of the duration of breastfeeding. This decreased pace should not be confused with growth problems, for example, giving scope for the hypothesis that breastfeeding is insufficient and that there is a
need for early introduction of other food4,13.
We observed that the cesarean section had a negative influence on weight gain, since children born from this type of delivery had lower rate of
Table 2. continuation
Variables (%) WGR4 (g/day) WGR6 (g/day)
Median (Min - Max) p-value1 Median (Min-Max) p-value1
Gender
Male (52.5) 29.5 (17.4 – 54.6) < 0.001* 25.3 (15.7 – 47.4) 0.001* Female (47.5) 25.4 (7.2 – 43.4) 22.2 (12.2 – 36.7)
Type of delivery
Normal (27.1) 26.8 (17.5 – 45.5) 0.315 22.7 (16.8 – 42.8) 0.144 C-section (72.9) 28.1 (7.3 – 54.6) 24.7 (12.2 – 47.4)
Low BW
Yes (25.4) 28.4 (18.7 – 43.4) 0.566 24.0 (15.7 – 41.2) 0.964 No (74.6) 27.3 (7.3 – 54.6) 24.1 (12.2 – 47.4)
High BW
Yes (5.4) 25.4 (11.6 – 41.3) 0.671 21.8 (12.2 – 35.2) 0.619 No (94.6) 27.7 (7.3 – 54.6) 24.2 (15.7 – 47.4)
Variables (%) SGR4 (cm/month) SGR6 (cm/month)
Median (Min - Max) p-value1 Mean ± SD p-value2
Gender
Male (52.5) 3.4 (2.4 – 4.6) <0.001* 2.9 ± 0.3 < 0.001* Female (47.5) 3.1 (1.4 – 4.6) 2.7 ± 0.3
Type of delivery
Normal (27.1) 3.2 (2.2 – 4.6) 0.354 2.8 ± 0.4 0.222 C-section (72.9) 3.3 (1.3 – 4.6) 2.8 ± 0.3
Low BW
Yes (25.4) 3.3 (2.3 – 4.6) 0.373 2.9 ± 0.3 0.035*
No (74.6) 3.3 (1.4 – 4.5) 2.8 ± 0.4
High BW
Yes (5.4) 3.1 (1.8 – 3.7) 0.152 2.6 ± 0.5 0.006*
No (94.6) 3.2 (1.3 – 4.6) 2.8 ± 0.3
e C
ole
tiv
a,
22(8):2713-2726,
2017
weight gain until the first month. It is possible that post-surgery maternal condition had a nega-tive influence on breastfeeding in the first days of the child’s life, reflecting lower weight gain. De-layed first mother-to-child contact, postanesthet-ic effect and incisional pain of cesarean section appear to hamper first breastfeeds and the estab-lishment of breastfeeding, leaving newborns sus-ceptible to the introduction of early lactational
formulas20.
According to Weiderpass et al.21, in a
pop-ulation-based cohort study in Pelotas, Brazil, mothers submitted to elective cesarean sections showed a greater risk (OR = 3.09) of complete interruption of lactation in the first month of life, evidencing that this type of delivery is an im-portant risk factor for not initiating lactation or stopping it in the first days of the child’s life. This finding can be explained in part by postoperative hospital practices that may hamper cohabitation
and on-demand breastfeeding or the early intro-duction of another type of milk, in addition to lower breastfeeding incentive to these mothers
in the postpartum period21. A study22 with recent
mothers from Rio de Janeiro showed that cae-sarean section reduced by half the prevalence of breastfeeding in the first hour.
Contrary to our results, Spyrides et al.8
ob-served that children born with cesarean delivery tended to have greater weight gain rates than those born vaginally. These authors point out that literature has investigated the relation be-tween cesarean deliveries with breastfeeding, but the influence of this type of delivery on growth in the first months of the infant’s life is not known.
As for the relationship between growth rate and birth weight, up to the sixth month, children born with low weight showed a higher size gain rate and those born with high weight, a lower size
gain rate. In the study by Spyrides et al.12, birth
Table 3. Growth rate (weight and size gain) by feeding practices, difficulty in breastfeeding and use of pacifiers of children evaluated up to the first month of life of the municipality of Viçosa, Minas Gerais, 2011-2013.
Variables (%) WGR1 (g/day) SGR1 (cm/month)
Median (Min - Max) p-value1 Mean ± SD p-value2
Breastfeeding type
Exclusive (47.8) 32.8 (7.6 – 65.3)a 3.9 ± 1.4
Predominant (30.3) 31.0 (-35.3 – 66.8)a < 0.001* 3.9 ± 1.6 0.050
Mixed (16.6) 24.5 (-8.3 – 52.5)b 3.3 ± 1.4
Artificial (5.3) 19.0 (10.5 – 38.5)b 3.2 ± 1.6
Difficulty in breastfeeding
No (79.0) 31.7 (-3.0 – 69.3) < 0.001* 3.8 ± 1.5 0.086 Yes (21.0) 25.2 (-35.3 – 51.8) 3.4 ± 1.4
Formula consumption
No (78.5) 31.8 (-7.0 – 69.3) < 0.001* 3.9 ± 1.5 0.006*
Yes (21.5) 24.3 (-35.3 – 52.5) 3.3 ± 1.5 Cow milk consumption
No (98.0) 30.6 (-35.3 – 69.3) 0.129 3.8 ± 1.5 0.065
Yes (2.0) 22.3 (15.0 – 32.7) 2.5 ± 1.6
Water consumption
No (87.8) 31.0 (-7.0 – 65.3) 0.049* 3.8 ± 1.5 0.100 Yes (12.2) 27.0 (-8.3 – 45.0) 3.3 ± 1.8
Tea consumption
No (63.2) 29.7 (-6.7 – 65.3) 0.427 3.8 ± 1.4 0.982 Yes (36.8) 30.7 (-8.3 – 66.8) 3.8 ± 1.6
Use of pacifier
No (54.3) 31.7 (2.8 – 66.8) 0.023* 3.8 ± 1.4 0.926 Yes (45.7) 28.3 (-8.3 – 65.3) 3.8 ± 1.6
Fo
nse
ca PCA
weight was one of the strong predictors of size development in the first nine months of life.
The study by Eickmann et al.11 compared
growth of term infants born with low birth weight and adequate weight in the first two years of life and observed that there was a more evi-dent initial acceleration of growth in low birth weight children, since there was a greater increase in the size/age rate mainly in the first months of life. This compensatory growth acceleration may have occurred in infants born in this study who were delivered with low weight, as suggested by the higher size gain rate at six months of age. However, literature already points to the negative
effects of low birth weight on pre-school growth, implying lower growth and greater risk of failure
in this process23. Regarding the relationship
be-tween high birth weight and lower size gain rate, further studies are required to better understand this finding.
This study showed a higher rate of weight gain among infants on EBF and predominant breast-feeding compared to mixed and artificial BF un-til the first and second month. It was possible to observe that size gain rate was also higher up to the second month. In children who consumed formulas showed lower growth rate (weight and size gain) during the first and second month,
Table 4. Growth rate (weight and size gain) by feeding practices, difficulty in breastfeeding and use of pacifiers of children evaluated up to the second month of life of the municipality of Viçosa, Minas Gerais, 2011-2013.
Variables (%) WGR2 (g/day) SGR2 (cm/month)
Mean ± SD p-value1 Median (Min - Max) p-value2
Breastfeeding type
Exclusive (51.8) 33.5 ± 7.6a 3.8 (2.1 – 5.4)a
Predominant (22.3) 31.8 ± 8.7a < 0.001* 3.8 (1.1 – 18.0)a 0.015*
Mixed (17.0) 27.3 ± 9.1b 3.5 (2.1 – 5.9)b
Artificial (8.9) 29.0 ± 7.8 (a.b) 3.4 (2.3 – 5.3)b
Difficulty in breastfeeding
No (85.0) 32.3 ± 8.2 0.004* 3.8 (1.6 – 5.6) 0.047*
Yes (15.0) 27.9 ± 9.2 3.4 (2.3 – 5.9)
Formula consumption
No (75.7) 32.9 ± 8.1 < 0.001* 3.8 (1.6 – 5.9) < 0.001*
Yes (24.3) 27.9 ± 8.8 3.4 (2.1 – 5.3)
Cow milk consumption
No (95.9) 31.7 ± 8.6 0.517 3.7 (1.6 – 5.6) 0.544
Yes (4.1) 29.9 ± 6.3 3.8 (2.9 – 5.9)
Porridge consumption
No (97.6) 31.6 ± 8.6 0.564 3.7 (1.6 – 5.7) 0.960
Yes (2.4) 33.6 ± 4.7 3.8 (2.3 – 4.2)
Water consumption
No (76.5) 32.4 ± 8.4 0.019* 3.8 (1.6 – 5.7) 0.033*
Yes (23.5) 29.4 ± 8.3 3.5 (1.6 – 18.0) Tea consumption
No (71.3) 32.1 ± 8.5 0.220 3.7 (2.0 – 5.7) 0.677
Yes (28.7) 30.6 ± 8.5 3.6 (1.0 – 5.9)
Juice consumption
No (94.7) 31.7 ± 8.6 0.555 3.8 (1.6 – 5.7) 0.254
Yes (5.3) 30.3 ± 6.8 3.5 (2.3 – 5.9)
Use of pacifier
No (52.2) 33.4 ± 7.6 < 0.001* 3.7 (1.6 – 5.6) 0.326
Yes (47.8) 29.8 ± 9.0 3.6 (1.9 – 5.7)
e C
ole
tiv
a,
22(8):2713-2726,
2017
Table 5. Growth rate (weight and size gain) by feeding practices and use of pacifiers of children evaluated up to the fourth and sixth month of life of the municipality of Viçosa, Minas Gerais, 2011-2013.
Variables (%) WGR4 (g/day) SGR4 (cm/month)
Median (Min - Max) p-value1 Median (Min - Max) p-value1
Breastfeeding type
Exclusive or Predominant (49.8) 28.3 (17.9 – 44.5) 3.3 (2.3 – 4.4)
Mixed (17.8) 27.1 (7.3 – 41.3) 0.178 3.2 (1.4 – 4.4) 0.449 Artificial (8.9) 29.1 (18.2 – 45.5) 3.3 (2.6 – 4.6)
Supplemented (23.5) 26.4 (11.6 – 42.1) 3.4 (1.8 – 4.6)
Formula consumption
No (69.2) 28.1 (17.5 – 45.5) 0.301 3.3 (2.3 – 4.5) 0.938 Yes (30.8) 26.8 (7.2 – 43.4) 3.2 (1.3 – 4.6)
Cow milk consumption
No (87.5) 27.9 (16.0 – 43.4) 0.105 3.3 (2.2 – 4.5) 0.476 Yes (12.5) 25.3 (17.5 – 45.5) 3.2 (2.3 – 4.2)
Porridge consumption
No (93.5) 27.9 (16.0 – 43.4) 0.014* 3.3 (2.2 – 4.5) 0.003*
Yes (6.5) 23.3 (18.0 – 45.5) 3.0 (2.3 – 3.4)
Use of pacifier
No (55.1) 29.0 (17.4 – 44.4) 0.006* 3.3 (2.2 – 4.3) 0.234 Yes (44.9) 26.6 (11.6 – 43.4) 3.2 (2.3 – 4.6)
Variables (%) WGR6 (g/day) SGR6 (cm/month)
Median (Min - Max) p-value1 Mean ± SD p-value2
Breastfeeding type
Breastfeeding and SF (45.3) 24.2 (15.9 – 36.7) 2.8 ± 0.3
Mixed and SF (32.4) 23.9 (12.2 – 41.2) 0.675 2.8 ± 0.3 0.820 Artificial and SF (22.3) 23.3 (15.7 – 42.8) 2.8 ± 0.3
Formula consumption
No (68.8) 24.4 (15.9 – 42.7) 0.047* 2.8 ± 0.3 0.445 Yes (31.2) 23.1 (12.2 – 41.2) 2.8 ± 0.3
Cow milk consumption
No (72.1) 24.0 (15.8 – 41.2) 0.940 2.8 ± 0.3 0.637 Yes (27.9) 24.2 (12.2 – 42.7) 2.8 ± 0.4
Porridge consumption
No (81.0) 24.2 (15.8 – 38.9) 0.324 2.8 ± 0.3 0.179 Yes (19.0) 23.4 (12.2 – 42.8) 2.7 ± 0.3
Use of pacifier
No (53.8) 24.3 (15.9 – 37.4) 0.107 2.8 ± 0.3 0.982 Yes (46.2) 23.4 (15.7 – 41.2) 2.8 ± 0.3
WGR4 and WGR6 = weight gain rate in the fourth and sixth month of life; SGR4 and SGR6 = size gain rate in the fourth and sixth month of life; g = gram; cm = centimeter; min = minimum; max = maximum; SD = standard deviation; SF = Supplementary Feeding; 1Mann-Whitney/Kruskal-Wallis Test (post-hoc test: Dunn); 2 Student’s t-test /ANOVA Test (post-hoc test: Bonferroni).
and until the sixth month, only weight gain was lower. There were no differences in growth rates between the breastfeeding types until the fourth and sixth month, probably because other factors not evaluated by this study must have exerted greater influence on the growth of infants.
Similar results were also observed in the
study by Longo et al.3 with 3,172 children, who
evaluated the growth rate in different categories
of breastfeeding, finding a positive association between the weight and size gain rate with EBF and predominant BF in the first months of life and lower weight and size increase in artificially breastfed infants. Children on EBF of the Marques
et al. study2 reached 6 months with mean weight
above the 50th percentile of the curves of the
Fo
nse
ca PCA
by Augusto e Souza13, in the first quarter, the
daily rate of weight gain among girls was high-er and was related to longhigh-er duration of EBF. In the second quarter, the daily rate of weight gain was not influenced by the duration of EBF, as was the case in this study. According to Johnson et
al.24, infants weaning after 6 months show lower
growth rate and shorter size. The protective role of EBF against excessive weight gain during the second half of life of the children is also
high-lighted, as observed by Gonçalves et al.25. These
findings reinforce that it is undisputed that EBF and predominant BF are fundamental for better weight and size gain among infants.
This study did not identify differences in the influence of exclusive or predominant breast-feeding on the growth rate of the studied chil-dren, evidencing that predominant breastfeeding contributed in a similar way to EBF in the best growth rate until the second month. A similar result was observed in the study by Spyrides et
al.8, who observed that infants in the first months
of life had a higher growth rate, although at the end of the study weight and size were lower when compared to children who consumed formulas. A study conducted in Australia with infants in the age group 4-7 months showed that one of the risk factors for rapid weight gain was infant
formula intake17. Literature shows evidence that
the consumption of infant formulas predisposes children to overweight and obesity in the future, due to their high protein composition in relation to breast milk. Studies conclude that childhood feeding practices are determinant for long-term health impact and the composition of infant
for-mulas should be reviewed26,27.
WHO growth curves28 published in 2006 and
considered a growth pattern for healthy chil-dren show that size-weight growth is character-ized differently in the first and second semester of children’s lives. Those exclusively breastfed during the first half show greater weight gain, but a lower weight gain is observed after this period when compared to growth of children who
con-sume infant formulas29.
As described above, the importance of breast-feeding in the growth rate of infants is well-doc-umented in literature, especially when breast-feeding occurs in the first months, as observed in this study, which showed a slower growth rate among children on mixed and artificial feeding. Studies on growth rate and types of breastfeed-ing are still rare in literature, but our results and studies shown here strengthen the hypothesis that breastfeeding is nutritionally sufficient for
optimal growth up to six months and there is no need to introduce other milks. Therefore, intake of infant formulas should only be recommended to children under one year of age when
breast-feeding is not possible30.
Regarding the consumption of cow milk, no differences were found in the growth of the chil-dren in this study in all evaluations, probably due to their low frequency in the first months and their consumption associated with breastfeeding, and a possible negative effect on the growth rate was not observed. On the other hand, the intake of cow milk-based porridge was related to low-er growth rate (weight and size gain) up to the fourth month. Different results were found in
the study by Gonçalves et al.25 with children in
the first year, who did not observe an association between the consumption of cow milk with sug-ar and flour added (porridge) with weight gain up to six months. Cow milk is not recommend-ed in the diet of children under one year due to its high protein content, which is difficult to
digest15,31 and promotes changes in insulin
secre-tion and decreased secresecre-tion of growth hormone,
predisposing the child to overweight25. The
ear-ly introduction of cow milk alone or combined with other food in child feeding is common and worrying, according to data from a national sur-vey, where 62.4% of children under six months
consumed cow milk32.
Among the difficulties related to breastfeed-ing reported by mothers were nipple lesions, breast pain, breast engorgement, incorrect breast-feeding technique, breast milk’s reduced produc-tion, waking up at dawn, among others. This im-plied a lower rate of weight gain in children until the first and second month of life. Thus, it is of great importance to follow-up and instruct re-cent mothers on alternatives to solve these hard-ships during this period, considering that these difficulties reflected in children’s growth rate. Literature indicates that reports of breastfeeding
problems are associated with the lack of EBF33.
According to Rocci and Fernandes34, support to
mothers in overcoming these breastfeeding is-sues determines mother breastfeeding’s success or abandonment.
e C
ole
tiv
a,
22(8):2713-2726,
2017
this practice should be disregarded even on hot
days33,35. There is evidence that one of the factors
associated with early weaning is the supplemen-tation of infant breastfeeding with other liquids,
since they reduce the volume of breastfeeding35.
Thus, it is necessary to instruct mothers regard-ing the early introduction of fluids, reinforcregard-ing EBF’s sufficiency up to six months, since such in-appropriate practices jeopardize child growth, as observed in this study.
The use of pacifiers by infants in this study was related to lower weight gain rate until the first, second and fourth month. This relationship was due to the fact that children using pacifiers were more susceptible to breastfeeding aban-donment, which meant less weight gain. Studies have shown that pacifier use is an important risk
factor for the interruption of breastfeeding33,36.
Campagnolo et al.37 emphasize that children
us-ing pacifiers seem to have less efficient breast suc-tion. This evidence may explain why pacifier use was a limiting factor for weight gain in children of this study, and initiatives are required to make mothers aware of the risks of pacifiers to child growth, discouraging their use mainly in the first few months of life.
The longitudinal nature of this study allowed the monitoring of the growth rate of infants during the first six months of life in four stages,
showing important factors, most of them modi-fiable that contributed to a higher or lower rate of children’s weight and size gain. It is important to highlight the importance of this study to evaluate children’s growth rate in a critical period, identi-fying early the interfering factors of this process and how they operate. As a limitation, it has been observed that follow-up losses were higher than 20%. However, the analysis of the differential loss between the monitored and non-monitored children showed that there was no difference be-tween them, leading to the conclusion that the results of this study were not compromised by this selection bias.
Fo
nse
ca PCA
Collaborations
e C ole tiv a, 22(8):2713-2726, 2017 References
1. Nguyen HT, Eriksson B, Nguyen LT, Nguyen CT, Pet-zold M, Bondjers G, Ascher H. Physical growth during the first year of life. A longitudinal study in rural and urban areas of Hanoi, Vietnam. BMC Pediat 2012; 12:26.
2. Marques RFSV, Lopez FA, Braga JAP. O crescimento de crianças alimentadas com leite materno exclusivo nos primeiros 6 meses de vida. J Pediatr (Rio J) 2004; 80(Supl. 2):S99-105.
3. Longo GZ, Souza JMP, Souza SB, Szarfarc SC. Cresci-mento de crianças até os seis meses de idade segundo categorias de aleitamento materno. Rev Bras Saúde Ma-tern Infant 2005; 5(Supl. 1):109-118.
4. Jaldin MGM, Pinheiro FS, Santos AM, Muniz NC. Cres-cimento infantil comparado com as referências NCHS e o padrão WHO/2006. Rev Nutr 2013; 26(1):17-26. 5. World Health Organization (WHO). Expert consultation
on the optimal duration of exclusive breastfeeding. Con-clusions and recommendations. Geneva: WHO; 2001. Document A54/INF.DOC./4.
6. Romani SAM, Lira PIC. Fatores determinantes do cres-cimento infantil. Rev Bras Saúde Matern Infant 2004; 4(1):15-23.
7. Hosseini SM, Maracy MR, Sarrafzade S, Kelishadi R. Child Weight Growth Trajectory and its Determinants in a Sample of Iranian Children from Birth until 2 Years of Age. Int J Prev Med 2014; 5(3):348-355. 8. Spyrides MH, Struchiner CJ, Barbosa MT, Kac G.
Ef-fect of predominant breastfeeding duration on infant growth: a prospective study using nonlinear mixed ef-fect models. J Pediatr (Rio J) 2008; 84(3):237-243 9. Regnault N, Botton J, Forhan A, Hankard R,
Thiebau-georges O, Hillier TA, Kaminski M, Heude B, Charles MA. Determinants of early ponderal and statural growth in full-term infants in the EDEN mother-child cohort study. Am J Clin Nutr 2010; 92(3):594-602. 10. World Health Organization (WHO). Growth velocity
based on weight, length and head circumference. Me-thods and development. Geneva: WHO; 2009.
11. Eickman SH, Lima MC, Motta MEFA, Romani SAM, Lira PIC. Crescimento de nascidos a termo com peso baixo e adequado nos dois primeiros anos de vida. Rev Saude Publica 2006; 40(6):1073-1081.
12. Spyrides MH, Struchiner CJ, Barbosa MT, Kac G. Práti-cas de amamentação e crescimento infantil: um estudo longitudinal em crianças do Rio de Janeiro, 1999/2001. Cad Saude Publica 2005; 21(3):756-766.
13. Augusto RA, Souza JMP. Crescimento de crianças em aleitamento materno exclusivo no primeiro semestre de vida. Rev Bras Crescimento e Desenvol Hum 2007; 17(2):1-11.
14. Instituto Brasileiro de Geografia e Estatística (IBGE). [acessado 2014 nov 25]. Disponível em: http://www. cidades.ibge.gov.br/xtras/perfil.php?lang=&cod- mun=317130&search=minas-gerais|vicosa|infogra-ficos:-informacoes-completas
15. Brasil. Ministério da Saúde (MS). Saúde da criança: aleitamento materno e alimentação complementar. 2ª ed. Brasília: MS; 2015.
16. Onis M, Onyango AW, Van den Broeck J, Chumlea WC, Martorell R. Measurement and standardization pro-tocols for anthropometry used in the construction of a new international growth reference. Food Nutr Bull 2004; 25(1Supl.):S27-36.
17. Mihrshahi S, Battistutta D, Magarey A, Daniels LA. De-terminants of rapid weight gain during infancy: base-line results from the NOURISH randomised controlled trial. BMC Pediat 2011; 11:99.
18. Rzehak P, Sausenthaler S, Koletzko S, Bauer P, Schaaf B, Berg AV, Berdel D, Borte M, Herbarth O, Krämer U, Fenske N, Wichmann HE, Heinrich J. Period-specific growth, overweight and modification by breastfeeding in the GINI and LISA birth cohorts up to age 6 years. Eur J Epidemiol 2009; 24 (8):449-467.
19. Sekiyama M, Matsu’ura S, Ohtsuka R. Monthly growth and milk intake of japanese infants exclusively breast-fed up to three months old. Anthropol Sci 2003; 111(4):373-381.
20. Faleiros FTV, Trezza EMC, Carandina L. Aleitamento materno: fatores de influência na sua decisão e dura-ção. Rev Nutr 2006; 19(5):623-630.
21. Weiderpass E, Barros, FC, Victora CG, Tomasi E, Hal-pern R. Incidência e duração da amamentação con-forme o tipo de parto: estudo longitudinal no Sul do Brasil. Rev Saude Publica 1998; 32(3):225-231. 22. Boccolini CS, Carvalho ML, Oliveira MIC, Vasconcellos
AGG. Fatores associados à amamentação na primeira hora de vida. Rev Saude Publica 2011; 45(1):69-78 . 23. Yamamoto RM, Schoeps DO, Abreu LC, Leone C. Peso
insuficiente ao nascer e crescimento alcançado na idade pré-escolar, por crianças atendidas em creches filantró-picas do município de Santo André, São Paulo, Brasil. Rev Bras Saude Mater Infant 2009; 9(4):477-485. 24. Johnson L, Jaarsveld CV, Llewllyn CH, Cole TJ,
Ward-le J. Associations between infant feeding and the size, tempo and velocity of infant weight gain: SITAR anal-ysis of the Gemini twin birth cohort. Int J Obes 2014; 38(7):980-987.
25. Gonçalves SC, Louzada MLC, Campagnolo PDB, Vito-lo MR. VeVito-locidade de ganho de peso e práticas alimen-tares no primeiro ano de vida em lactentes de baixo nível socioeconômico. Rev Nutr 2012; 25(5):555-563. 26. Koletzko B, von Kries R, Closa R, Escribano J,
Scaglio-ni S, GiovanScaglio-niScaglio-ni M, Beyer J, Demmelmair H, Anton B, Gruszfeld D, Dobrzanska A, Sengier A, Langhendries JP, Rolland Cachera MF, Grote V. Can infant feeding choices modulate later obesity risk? Am J Clin Nutr 2009; 89(5):1502S-1508S.
27. Koletzko B, von Kries R, Monasterolo RC, Subías JE, Scaglioni S, Giovannini M, Beyer J, Demmelmair H, Anton B, Gruszfeld D, Dobrzanska A, Sengier A, Lan-ghendries JP, Cachera MF, Grote V; European Chil-dhood Obesity Trial Study Group. Infant feeding and later obesity risk. Adv Exp Med Biol 2009; 646:15-29. 28. World Health Organization (WHO). The WHO
Mul-ticentre Growth Reference Study (MGRS): child growth standard. Geneva: WHO; 2006.
29. Guerra A. As curvas de crescimento da Organização Mundial de Saúde. Acta Pediatr Port 2009; 40(3):XLI-XLV.
30. Brasil. Ministério da Saúde (MS). Dez passos para uma alimentação saudável: guia alimentar para crianças me-nores de dois anos: um guia para o profissional da saúde na atenção básica. 2ª ed. Brasília: MS; 2010.
Fo
nse
ca PCA
32. Bortolini GA, Vitolo MR, Gubert MB, Santos LM. Ear-ly cow’s milk consumption among Brazilian children: results of a national survey. J Pediatr (Rio J) 2013; 89(6):608-613.
33. Carvalhaes MABL, Parada CMGL, Costa MP. Fatores associados à situação do aleitamento materno exclusi-vo em crianças menores de 4 meses, em Botucatu-SP. Rev Latino-Am Enfermagem 2007; 15(1):62-69. 34. Rocci E, Fernandes RAQ. Dificuldades no aleitamento
materno e influência no desmame precoce. Rev Bras Enferm 2014; 67(1):22-27.
35. Dias MCAP, Freire LMS, Francheschini SCC. Recomen-dações para alimentação complementar de crianças menores de dois anos. Rev Nutr 2010; 23(3):475-486. 36. Feldens CA, Vitolo MR, Rauber F, Cruz LN, Hilgert JB.
Risk factors for discontinuing breastfeeding in south-ern Brazil: a survival analysis. Matern Child Health J 2011; 16(6):1257-1265.
37. Campagnolo PDB, Louzada MLC, Silveira EL, Vitolo MR. Práticas alimentares no primeiro ano de vida e fatores associados em amostra representativa da cida-de cida-de Porto Alegre, Rio Grancida-de do Sul. Rev Nutr 2012; 25(4):431-439.
Article submitted 15/09/2015 Approved 22/02/2016