Contents lists available atScienceDirect
Urban Climate
journal homepage:www.elsevier.com/locate/uclim
Ranking European capitals by exposure to heat waves and cold
waves
M. Smid
a,⁎, S. Russo
b,c, A.C. Costa
a, C. Granell
d, E. Pebesma
eaNOVA Information Management School (NOVA IMS), Universidade Nova de Lisboa, Portugal
bEuropean Commission, Joint Research Centre, Ispra, Italy
cInstitute for Environmental Protection and Research (ISPRA), Rome, Italy
dGeospatial Technologies Research Group (GEOTEC), Universitat Jaume I, Spain
eInstitute for Geoinformatics, University of Münster, Germany
A R T I C L E I N F O
Keywords: Heat waves Cold waves Climate change impact European capitals Population exposure EURO-CORDEX
A B S T R A C T
In warming Europe, we are witnessing a growth in urban population with aging trend, which will make the society more exposed and vulnerable to extreme weather events. In the period 1950–2015 the occurrence of extreme heat waves increased across European capitals. As an example, in 2010 Moscow was hit by the strongest heat wave of the present era, killing more than ten thousand people. The cold extremes will have decreasing tendency as global warming pro-gresses, however due to higher variability of future climates, the cold wave hazard may remain locally important threat. Moreover, the heat and cold-related mortality will be enhanced with foreseen demographic evolution in European cities.
Here we focus on larger metropolitan areas of European capitals (EU28 plus Moscow, Oslo and Zurich). By using an ensemble of eight EURO-CORDEX models under the RCP8.5 scenario, we detected heat waves and cold waves events by deployment of Heat Wave Magnitude Index daily and its cold wave counterpart. We introduce a ranking procedure based on ensemble predictions using the median of metropolitan grid cells for each capital, and population density as a proxy to quantify the future exposure.
All the investigated European metropolitan areas will be more vulnerable to extreme heat in the coming decades. Based on the impact ranking, results reveal that cold waves will represent some threat in mid of the century but they will not be the major threat in any of European capitals, and that they are projected to completely vanish by the end of this century. On the contrary, in near, but even more so in distant future, extreme heat events in European capitals will be not exclusive to traditionally exposed areas such as the Mediterranean and the Iberian Peninsula. The ranking of European capitals based on their exposure to extreme heat is of paramount importance to decision makers in order to mitigate the heat related mortality, especially with the foreseen increase of global mean temperature. Furthermore, this simple comparative indicator helps communicating the global, complex and impersonal issue of climate change locally thus contributing to raise awareness and call for action.
https://doi.org/10.1016/j.uclim.2018.12.010
Received 24 August 2018; Received in revised form 8 November 2018; Accepted 21 December 2018
⁎Corresponding author at: Universidade Nova de Lisboa, Campus de Campolide, 1070-312 Lisboa, Portugal.
E-mail address:marek.smid@bc3research.org(M. Smid).
2212-0955/ © 2019 The Authors. Published by Elsevier B.V. This is an open access article under the CC BY license (http://creativecommons.org/licenses/BY/4.0/).
1. Introduction
In this study we focus on future impacts of temperature extremes in European capital cities, with emphasis on heat waves (HWs) since these represents one of the most remarkable extreme climate related events regularly striking Europe (Vautard et al., 2013). In 2007, mankind became predominantly urban based (McCarthy et al., 2010; UN, 2014).Projections indicate that by 2050 urban systems will be home to 66% of the global population representing 6.3 billon urban dwellers (UN, 2014) with this proportion being even higher in European Union, where currently 75% of population reside in cities with expected growth to 82% by 2050 (Guerreiro et al., 2018;UN-habitat, 2010). The increasing urbanization (Estrada et al., 2017;Smid and Costa, 2017) accompanied with an aging trend of European society will lead to magnified impacts of future heat including the higher risk of future heat related mortality (Baccini et al., 2008;Hajat et al., 2014). Urbanized areas are not only major drivers of climate change, but are simultaneously hot spots of climate change impact (de la Barrera and Henríquez, 2017). The recent study by Guerreiro et al. (2018)covering 571 European cities shows that under the busyness-as-usually scenario capitals are amongst top 100 for one or more analyzed future hazards. European capitals typically represent around 30% of national GDP (Eurostat, 2016), and they often have a critical role concentrating international and intranationalflows of capital accompanied with labour activity, and as such, they are vital for national competitiveness in a globalized world (Dijkstra et al., 2013).
Europe was marked amongst the particularly warming regions (Amengual et al., 2014;IPCC, 2012), with strong response to the anthropogenic climate change thus exhibiting stronger warming rate then the planetary mean (Kuglitsch et al., 2010). The Heat Waves (HWs) do not only have various human, economic and environmental consequences (Argüeso et al., 2016), but they also represent one of the deadliest weather-related hazards (Habeeb et al., 2015;Revich and Shaposhnikov, 2012;Robine et al., 2008). Many efforts have been recently devoted to studying European heat (e.g. (Guerreiro et al., 2018;Lhotka et al., 2018;Pereira et al., 2017;Russo et al., 2015;Schoetter et al., 2015). A detailed description of the 10 most severe HWs within European domain since 1950 can be found inRusso et al. (2015). The 2003 HW had a death toll of approximately 40,000 people in Europe, highlighting the need to implement early warning systems in European cities (García-Herrera et al., 2010). The strongest event of the present era was the 2010 HW, strongly impacting Moscow, where an extreme day temperature of 38.2 °C was recorded and more than ten thousand people died (Barriopedro et al., 2011). Since then, other intense events stroke Europe, such as the sever Central European HW events of 2013 (Holtanová et al., 2015) and 2015 (Hoy et al., 2017), or the recent heatwave of summer 2017 that impacted western and central Europe (Sánchez-Benítez et al., 2018).
According the recent studies, the increase in magnitude will be most dramatic in southern-central Europe, while the duration is expected to be most pronounced in the Mediterranean (Fischer and Schär, 2010;Guerreiro et al., 2018). The future impacts in southern areas is frequently emphasized in the literature (e.g.Jacob et al., 2014;Pereira et al., 2017), and the high populated areas of Mediterranean coast will be of concern (Fischer and Schär, 2010). The north-south gradient across the Europe is expected to remain (Fischer et al., 2012), but the strongest intensification of hot extremes may occur in mid continental latitudes (Fischer, 2014) due to higher increase in climate variability towards the north (Fischer and Schär, 2010). Extreme heat events can occur also in Northern areas currently not being strongly associated with HWs (D'Ippoliti et al., 2010).
Despite these predictions, the situation in urban zones will be somewhat different. At the city level, the anthropogenic activities, such as natural-to-urban land conversion or changes in radiative substances in the atmosphere, will influence local climates (Estrada et al., 2017). Urban heat is a function of human caused alternations within urbanized surface influencing the local microclimates (Landsberg, 1981;Saaroni et al., 2000). These alternations include differences in the surface energy budget (McCarthy et al., 2010; Fischer et al., 2012; (Schatz and Kucharik, 2015;Vahmani and Ban-Weiss, 2016). The impervious urban surfaces decrease the latent heatflux (Fischer et al., 2012). The areas build up from asphalt or concrete exhibit higher thermal conductivity and increased heat capacity (Estrada et al., 2017). Dark surfaces (e.g. roads, parking lots or rooftops) may warm about 8 °C above the temperature of surrounding air (Patz et al., 2005). The urban land surfaces magnify the absorption of solar energy, and together with reduced presence of vegetation, contribute to overall lowered evaporative cooling and local soil moister (Habeeb et al., 2015;Vahmani and Ban-Weiss, 2016). However, other additional sources of heat can be found within urban systems, such as released heat waste that can be attributed to traffic, power plants, energy used to warm/cool the buildings (Huang and Lu, 2015), or even human metabolism (Ichinose et al., 1999). On the other hand, urban decision makers have a range of adaptive measures available. For instance, the generally light coloured roofs of city of Tel-Aviv are already significantly reducing the solar heating during the warm seasons (Rosenfeld et al., 1995). Passive cooling options, such as shading, building orientation, insulation, or advanced construction materials are also effective to decrease the heat stress (Hajat et al., 2014). The vegetative strategies of green roofs and tree planting have been proven to be the most effective moderators of urban heat. However, their applicability is conditioned by the amount of precipitation locally available (Habeeb et al., 2015). Moreover, the population itself may also show some degree of heat adaptability via beha-vioural changes, and also by rising the physiological thresholds (Hajat et al., 2014). Nevertheless, it is important to clarify that the climate models used in this study do not account for specific urban effects, and the utilized climate scenario (RCP8.5) corresponds to “a high-emission business as usual scenario” (Riahi et al., 2011).
In Europe the increased heat stress within urban areas was demonstrated, for example, for Hungary (Unger, 1996), Greece (Kamoutsis et al., 2007), or more recently for 571 cities all over Europe (Guerreiro et al., 2018). The HW impact is heterogeneous across the European cities.Ward et al. (2016)concluded that cities located in cooler climate are more affected than settlements in warmer regions.D'Ippoliti et al. (2010)showed that the mortality was amplified by HW by 12.4% in North Continental part and even by 21.8% in Mediterranean. The trends are alarming worldwide but in the global study on modern megalopolises,Papalexiou et al. (2018)explicitly pointed out Paris with warming trend 0.96 °C per decade closely followed by Moscow, thus illustrating the im-portance of the issue in European context.
Our primary purpose was to examine the changing characteristics of temperature-related extreme events across the European capitals with particular attention to a comparison amongst the cities. The quantification of cost and benefits, and the adaptation design of urban space remains the major challenge (Guerreiro et al., 2018) and our method offers a suitable framework to assess HW risks associated with future climate in urban areas.
In this study, we computed HWs and Cold Waves (CWs) indices on a subset with eight members of EURO-CORDEX ensemble (Jacob et al., 2014) for historical (1971–2005) and future (2006–2100) periods under the RCP8.5 (Riahi et al., 2011) “business-as-usually” scenario for 31 European capitals (EU28 plus Moscow, Oslo and Zurich).
HWs and CWs indices were constructed based on the simulations of daily near-surface maximum and minimum temperatures, following the definition of the Heat Wave Magnitude Index daily (HWMId) (Russo et al., 2015). The spatial extent of Larger Me-tropolitan Area (LMA) for each city was based on the data from the Urban Atlas produced by the European Environmental Agency ([dataset] EEA, 2012). We propose a ranking procedure for the capital cities in terms of HWs and CWs impact. We also reflected the variation in impacts of extreme heat onto different metropolitan societies by including the population density as additional exposure variable into the ranking.
This cities' ranking has three major benefits. Firstly, it communicates the risk associated with climate change induced extreme heat locally– virtually on “people's backyards”. Due to its simplicity and the fact that it allows to illustratively relate to situations of other Capitals, may help to engage not only scientists, but also the decision makers and general public, on efforts to combat climate change. In many cases, we are afraid that society may be often overwhelmed by either the complexity of climate related scientific findings or by constant repetition of media correctly informing on pessimistic perspective of our climate. Secondly, such an indicator can serve as a basis to decision making on European level, assisting with prioritizing the investments and other efforts in the adaptation strategy. Thirdly, this study communicates the magnitude (property of HWMId– detailed inSection 2. Data and Methods) of future heat and as such contributes to raise awareness about HWs since they are still often not perceived as a serious risk (Keramitsoglou et al., 2017).
2. Data and methods
2.1. Climate simulations
To investigate impacts of extreme temperatures across the European capitals (EU28, Moscow, Oslo, and Zurich) we used the recommended multimodel ensemble approach since ensemble as a whole outperforms individual projections and provide more a reliable picture of future changes (Sillmann et al., 2013b) and multi dynamical Regional Climate Model (RCM) downscaling of individual Global Circulation Models (GCMs) is also desirable (Smid and Costa, 2017). The European branch of CORDEX experiment currently provides the largest collection of simulations and provides the data at two different resolutions – 0.11° and 0.44°. These simulations were evaluated by many. Projected climate variables were compared with the observed values (e.g.Abiodun et al., 2017; Hofstra et al., 2009; Soares and Cardoso, 2018) and also indices constructed based on the simulations of daily minimum and maximum temperature CORDEX data were extensively validated against their counterparts computed on observational dataset (Lelieveld et al., 2016;Pereira et al., 2017). These validation exercises are most frequently done using the Ensemble-OBS gridded observational dataset byHaylock et al. (2008). Some studies specifically assess the ability of models to project the HWs (e.g.Ouzeau et al. (2016),Vautard et al. (2013); orLhotka et al. (2018)) and generally literature confirms the reliability of EURO-CORDEX data (e.g.Kotlarski et al. (2014)). Here we rely on these previous studies and consider the EURO-CORDEX simulations valid for analyses of future heat and cold waves.
The EURO-CORDEX models exhibit common biases underestimating heat extremes in Scandinavia, and the contrary for Southern and Central Europe, and also exhibit large-scale cooling over vast continental areas in simulations at increased resolution. Detailed bias analyses can be found inVautard et al. (2013). Despite those systematic biases, simulated values of temperature variables were found especially reliable. Moreover, the indices used in this study (HWMId/CWMId byRusso et al. (2015)– seeSection 2.2.1) contain implicit bias corrections by obtaining the percentile thresholds from respective model runs instead of observations. This strategy to minimize the bias was also used byPereira et al. (2017).
From two available EURO-CORDEX resolutions we choose the finer grid projections (~ 12.5 km). It was shown that coarser simulations project drier summer conditions (Kotlarski et al., 2014) and very persistent HWs (Vautard et al., 2013). These issues are improved in higher resolution (Kotlarski et al., 2014;Lhotka et al., 2018), and the main advantages offiner scale projections are in warm season (Soares and Cardoso, 2018;Lhotka et al., 2018). These improvements can be attributed to enhanced orography and better resolved local feedbacks and, as such, being pronounced in some coastal regions due to more accurate representation of coastline and coastal breeze (Vautard et al., 2013), and also in areas of complex terrain (Lhotka et al., 2018), which are both relevant in context of our target cities.
From full EURO-CORDEX ensemble we excluded some models due to their shortcomings in the Mediterranean area (Kotlarski et al., 2014) and in the ability to estimate the intensity of extreme events (Vautard et al., 2013). The resulting subset used in this work is composed of 8 simulations, containing different GCM/RCMs combinations performed by four different institutions (Table 1). The daily maximum and minimum near-surface temperature data for the 1971–2100 period were retrieved from ESG – Earth System Grid data repository and the details on models can be found in the EURO-CORDEX website (http://www.euro-cordex.net).
From all the Representative Concentration Pathways (RCPs) scenarios adopted by the IPCC for its 5th Assessment Report (Christensen et al., 2013) here we use RCP8.5 scenario. Unlike the SRES (Special Report on Emission Scenarios) (Nakicenovic et al., 2000) scenarios, they are not associated with particular storylines thus account for combined uncertain influence of economic,
technological, demographical and policy factors (Sillmann et al., 2013b). The RCP8.5 assumes continued growth of energy demand, hence does not have any peak breaking point during the 21st century. This scenario assumes continuing trends in all anthropogenic activities influencing the climate with no mitigation policies being implemented (Riahi et al., 2011). Here, we choose this scenario because it might be more relevant in projected future heat impacts over the cities given the additional influence of the urbanization to local climates. The other reason lays in one of the major objectives of this study which is the communication of climate change. Multiple previous studies found that most severe impacts throughout the 21st century are projected under the RCP8.5 scenario (e.g. (Jacob et al., 2014;Lhotka et al., 2018;Russo et al., 2015). However it is noteworthy the recent interestingfinding of Lhotka et al., (2018) for near future (2020–2049) in Central Europe where the largest increment of HWs frequency is exhibited by the RCP4.5 “low concentration” scenario. Nevertheless, the main objective of this study is to analyse the evolution of extreme temperature impacts during the entire century, and to communicate the quantified comparative hazard across the European capitals in simplistic manner, thus the RCP8.5 as an upper risk boundary was utilized in this study.
2.2. Climate indices
Indices describing moderate climate extremes are commonly deployed to characterise the impacts of climate change, since they capture relatively frequent impact-causing events (Alexander et al., 2006; for further details see the Supplementary Material). When assessing the impacts of extreme temperatures in changing climate, two main challenges are encountered. Firstly, the definition of extreme in long time-span is problematic– current extremes are likely to become the future norms (Argüeso et al., 2016). Secondly, the differences in local climates must be considered when the impact assessment aims to comparison amongst distant locations (Pereira et al., 2017) and the perception and vulnerability is not only function of local physical conditions but also of the cultural and environmental attitude of the society (e.g.Coccolo et al., 2016). These challenges, were overcome to large extend for most of the characteristics of future climate by (Alexander et al., 2006) and for HWs specifically by (Russo et al., 2014; andRusso et al., 2015). For assessing the risks and vulnerabilities of urban populations to extreme heat the frequency and occurrence of HWs are vital (McCarthy et al., 2010). However, the term heat wave may refer to many different things in dependence of used formula (Zhang et al., 2011). The diversity in obtained results was demonstrated byJacob et al. (2014); pointing out the projected increase in HWs occurrence ranging from 9 to 45 depending on the index formulation. To define the consistent index capturing multiday temperature extremes is, due to the dependency of these events not only on the frequency distribution but also on the day to day persistence, especially challenging (Zhang et al., 2011). There have been numerous efforts to provide a robust HW definition (e.g.Alexander et al., 2006;Frich et al., 2002;Hansen et al., 2008;Kyselý, 2010;Lhotka and Kyselý, 2015;Lhotka et al., 2018;Meehl and Tebaldi, 2004; Orlowsky and Seneviratne, 2012;Perkins et al., 2012;Russo and Sterl, 2011;Russo et al., 2014, 2015;Schär et al., 2004;Sillmann et al., 2013a). However, the currently implemented ETCCDI (Expert Team on Climate Change Detection and Indices) index– the Warm Spell Duration Index (WSDI) still exhibits some shortcomings (see (IPCC, 2012;Orlowsky and Seneviratne, 2012;Russo et al., 2014) and an universally accepted HW definition is still missing, thus represents an open issue to scientific debate (Keramitsoglou et al., 2017).
2.2.1. Heat Wave Magnitude Index daily (HWMId)
In order to quantify heat wave (cold wave) intensity we deployed the HWMId (CWMId), taking into account duration and temperature anomalies of heat waves into a single number (seeRusso et al., 2015). This index determines the strongest event for each year and provides the measure of its intensity (magnitude). The robustness of this index was illustrated, for example, by its ability to capture the large Finish HW of 1972 which till then went largely undetected by previous indices, despite the fact that this unusual event was reported in traditional newspapers. In the same time, the HWMId also demonstrated its ability to precisely detect well known historical events across the globe (Russo et al., 2015). Hence, our choice of this HW metric allows for comparison amongst large distances in space and time. Moreover, to calculate the HWMId in the reference period, the bootstrap / one“out-of-base” year cross-validation procedure illustrated inZhang et al. (2005)is used, therefore avoiding potential heterogeneities between the outside and within of the base period (Sippel et al., 2015), which is in agreement with ETCCDI recommendations (Schaller et al., 2018).
According toRusso et al. (2015)the HWMId is defined as the maximum magnitude of the heatwaves in a year, and a heatwave is defined as a climatic event equal or longer than 3 consecutive days with maximum temperature (Tmax) above the daily threshold for the reference period 1981–2010. The threshold is defined as the 90th percentile of the set of daily maximum temperature computed
Table 1
The list of utilized GCM/RCMs combinations.
Institute RCM Driving GCM
Royal Netherlands Meteorological Institute (KNMI) RACMO22E ICHEC-EC-EARTH
Danish Meteorological Institute (DMI) HIRHAM5 ICHEC-EC-EARTH
Swedish Meteorological and Hydrological Institute (SMHI) RCA4 ICHEC-EC-EARTH
Institut Pierre Simon Laplace (IPSL-INERIS) WRF331F IPSL-IPSL-CM5A-MR
Swedish Meteorological and Hydrological Institute (SMHI) RCA4 IPSL-IPSL-CM5A-MR
Royal Netherlands Meteorological Institute (KNMI) RACMO22E MOHC-HadGEM2-ES
Swedish Meteorological and Hydrological Institute (SMHI) RCA4 MOHC-HadGEM2-ES
from 31 day moving windows around each day of the year, for the entire 30 years reference period. Hence, for a given day d, the threshold is the 90th percentile of the set of data Addefined as follows:
= ⋃= ⋃= −+
Ad 2010y 1981 i dd 1515Ty i,
where⋃ denotes the union of sets and Ty,iis the daily Tmax of the day i in the year y. The magnitude of the event is then computed as
the sum of the magnitude of the consecutive days composing a heatwave, with daily magnitude calculated by
= ⎧ ⎨ ⎩ − > − ≤ M Td( )d T T if T T d y p T T if T T d y p 30 25 0 30 25 y p y p d y p 30 75 30 25 30 25
with Td being the daily Tmax on day d of the heatwave, T30y25pand T30y75pare, the 25th and 75th percentile values, respectively, of
the time series composed of 30 year annual maximum daily temperatures within the reference period 1981–2010. The Md function gives the magnitude of a single heat wave day. The Md is applied to each heat wave day and thefinal score of the HWMId is given by the sum of all Md values calculated for the days composing a heat wave.
Here cold waves are defined as three consecutive days with daily minimum temperature below the daily threshold defined as the 10th percentile of daily minima, centered on a 31 day window. In analogy to the HWMId definition the Cold Wave Magnitude Index daily (CWMId) is defined as the minimum of the magnitude of all the cold waves in a year with values smaller or equal to zero. The CWMId sums the negative magnitude of the consecutive days composing a coldwave. In this study, in order to compare the CWMId with HWMId we take the absolute values of the CWMId. This means that CWMId values close to zero indicate cold wave with very low magnitude and high positive values correspond to severe or extreme cold waves. For both (HWs and CWs) the same reference period (1981–2010) was used to calculate thresholds, and those were deployed to detect events in near and far future.
The data pre-processing was executed by means of the Climate Data Operator (CDO 2018: Climate Data Operators. Available at: http://www.mpimet.mpg.de/cdo) software and for calculation of HWMId/CWMId the“extRemes” R package (Gilleland and Katz, 2016) was used.
2.3. Spatial determination of large metropolitan areas
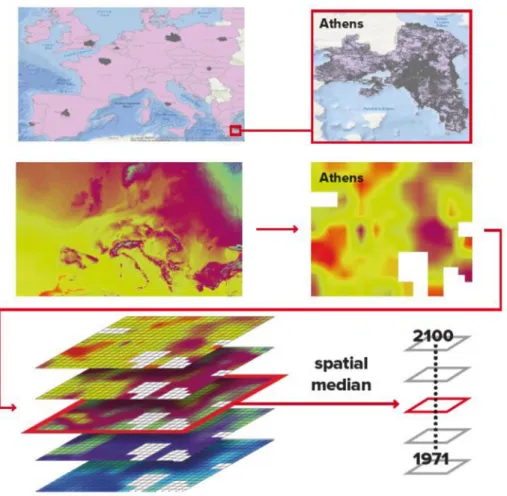
The usage of larger simulated or gridded observational datasets to assess the climate change impact over the set of target cities is not new (e.g.Guerreiro et al., 2018;Habeeb et al., 2015;Mishra and Lettenmaier, 2011;Papalexiou et al., 2018). The studies vary in the way how the target city areas are defined and how the data within the selected extent are treated, often in dependence on main aim of each study. Urban zones have been determined using different approaches, such as satellite night-time lights products (e.g. Yang et al., 2017), auxiliary data such as“Gisco Urban Audit 2004” (e.g.Guerreiro et al., 2018), areal estimates as a function of population density (e.g.Estrada et al., 2017), GIS processing of OpenStreetMaps (e.g.Varentsov et al., 2017), or predefined radius around the city centre (e.g.Papalexiou et al., 2018). Here, we exploit the data of Urban Atlas ([dataset] EEA, 2012) offering the spatial extent of Greater Metropolitan Areas thus containing also the new and old urbanization situated often outside the municipality boundaries, but factually co-forming the metropolis as a whole and its climate. Subsequently, for each capital city apart Moscow, we sub set the HWMId/CWMId gridded values to the smallest rectangle containing the area given by Urban Atlas. In case of Moscow, which is not covered in the product, we estimated the area based on Varentsov et al., (2017).
In contrast to recent extensive study of Guerreiro et al., (2018) using 1 grid point to represent each city, we involved in analysis all the grid cells of each selected rectangle, therefore fulfilling the requirement ofde la Barrera and Henríquez (2017)to focus on cities “in extenso”. For example, the rectangular subset for Lisbon contains also the Sintra mountain known for its relatively cooler and wetter microclimate (Alcoforado et al., 2014) but also being a home to significant portion of Lisbon Metropolitan Area population. Hence, we believe that this approach prevents to assess the climate impacts as too severe, which may be a case when only the central meteorological station or the associated grid cell is considered.
Finally, we computed the annual median of the grid cells for each index, thus differing from previous studies based on averaged values, such asAbiodun et al. (2017); andPapalexiou et al. (2018). By this method each index for each city is represented by single vector, which than serves as the input for the comparative ranking procedure.Fig. 1illustrates how the large metropolitan areas were determined, and the procedure used to obtain time series for each city.
2.4. Ranking procedure
To rank the capital cities in terms of impact risks,firstly, we split the merged climate simulations covering the 1971–2100 period consisting of historical and RCP8.5 scenario realizations into three periods: near past (1981–2010), near future (2021–2050), and future (2071–2100). This 30 years chunks of computed indices were chosen to avoid the presence of climate change signal thus ensuring the stationarity in time series (Russo and Sterl, 2012).
Secondly, we constructed the following matrix for each time-slice based on the annual spatial median of computed indices: =
A {Aij:iϵI jϵJ; }
where I stands for the set of 31 cities, and J stands for the set of annual HWMId /CWMId values in the considered 30 years period. Subsequently, for each city, the number of HWMId/CWMId values exceeding a certain threshold were counted and divided by
period length. These relative frequencies are interpreted as the probabilities of occurrence of events with given magnitudes for all cities in each time-slice. The considered magnitude thresholds were: > 3 labeled as“severe” events, > 6 labeled as “extreme” events, and > 9 labeled as“very severe” HWs and CWs. These thresholds are arbitrary but chosen in a way that they divide the past-present era HW magnitudes to approximately equal sized segments (the highest magnitude within computed ensemble mean between 1971 and 2020 is 11.204 for Berlin). Finally, the ensemble median of resulting probabilities was used for thefinal ranking and plotted on circular plots.
Exposure to Heat waves and Cold Waves has been measured by means of population density. The data about 31 target capitals were retrieved from spatially explicit dataset byJones and O'Neill (2016)consistent with the SSP1 Socioeconomic pathway (O'Neill et al., 2014). According to the dataset, the most densely populated city in this study is London, followed by Moscow and Paris (Fig. 2). On the opposite side relatively sparsely populated cities of Lefkosia, Tallinn, and Valletta can be found. The SSP1 scenario assumes, the rapid urbanization, continuing migration, and in low fertility countries (including Europe) positive economic prospects which will allow for medium fertility level (Jones and O'Neill, 2016). This dataset offers near past, current and estimated future projections, with data spanning over the period from 1980 to 2100 by decade. Firstly, we exploited only the values for the year 2010, thus considering the population density as a static factor. In other words, we analyzed recent past exposure and analogously estimated exposure for future periods as if the population densities remain constant. The vectors of population densities expressed in thousands per km2were divided by their maximum (the value of population density of the densest populated city) therefore expressed at the
standardized scale between 0 and 1, with values close to zero or one indicating low or high population density, respectively. Fur-thermore, the exposure measure was calculated as the product of the probabilities of occurrence of HWs with different magnitudes and standardized population density values. This was done for each target city and for all three analyzed time-slices. Secondly, to assess the influence of evolving population projections, we undertaken a similar procedure, but instead of static population density data, the median of projected values within each period was utilized. For example, city specific HWs probabilities of 2071–2100 were multiplied by vectors of the same length, computed as medians of population density projections for years 2080, 2090, and 2100 with the same standardization. Then again, thefinal ranking was based on the ensemble median.
3. Results
Our results provide insights regarding the future evolution of temperature related exposure of population across all the European capitals.Fig. 2serves as a domain map of this study localizing the target cities, indicates the population densities by colors, and also illustrates the occurrence of severe HWs between 1981 and 2010.
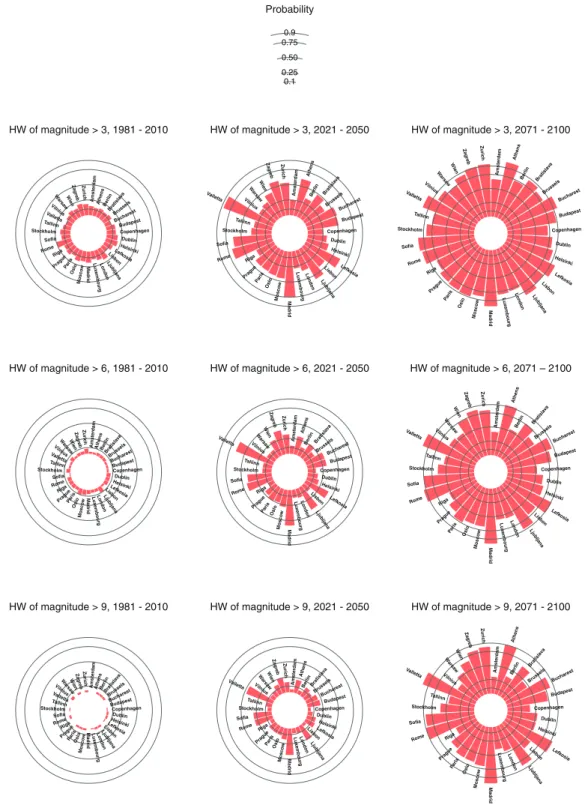
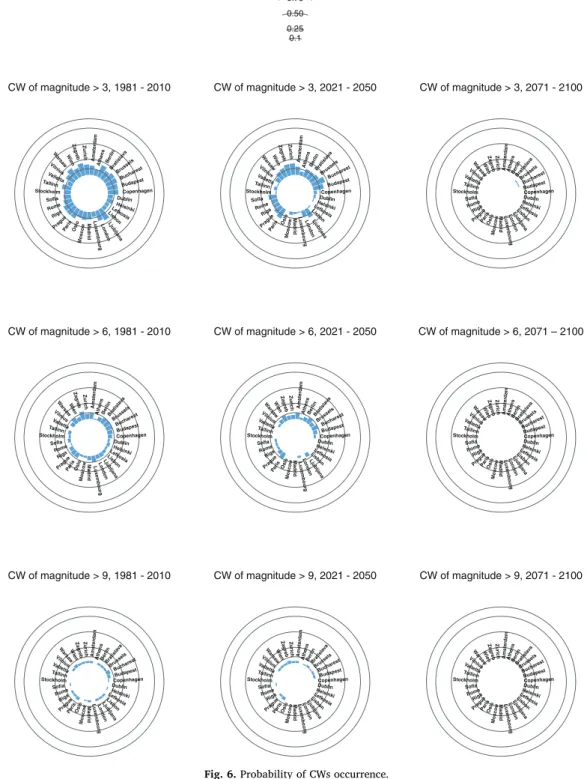
The results clearly show a gradual increase in frequency and severity of extreme heat events (Fig. 3), while cold waves exhibit a decrease. The CWs frequency declines thus relatively small impacts are projected in the mid-century and almost entirely vanish in far future (Fig. 6). Based on the impact ranking, in near and distant future extreme heat events will be not exclusive to traditionally exposed areas such as Mediterranean and Iberian Peninsula. Severe, extreme and very extreme HWs have increasing probabilities of occurrence from 2021 to 2050 to 2071–2100 in most cities (Fig. 3).
In near future (2021–2050), the occurrence of HW with magnitude > 6 is more likely in Madrid and Valletta (probability about 0.6), Lefkosia, Ljubljana, Rome, and Sofia (probability over 0.4) and Athens, Bucharest, Budapest, and Zurich (probability = 0.3), whereas the occurrence of HW of magnitude > 9 is most likely in the Valletta (probability = 0.46), Madrid (probability = 0.43), followed by Rome and Sofia (probability = 0.3). Valletta and Madrid show the highest values in probability of occurrence of heatwaves with a magnitude > 9 but also Ljubljana and Zagreb might be exposed to very extreme HWs. In 2071–2100, the prob-abilities of occurrence of HW > 6 are smaller than 0.5 only in Amsterdam. In distant future, the probprob-abilities of occurrence of HW to be more severe than 9 are > 0.75 in the following cities: Athens, Bratislava, Bucharest, Budapest, Lefkosia, Ljubljana, Madrid, Rome, Wien, Zagreb and Zurich, but closely followed by Paris (probability = 0.73) and Lisbon (probability = 0.71).
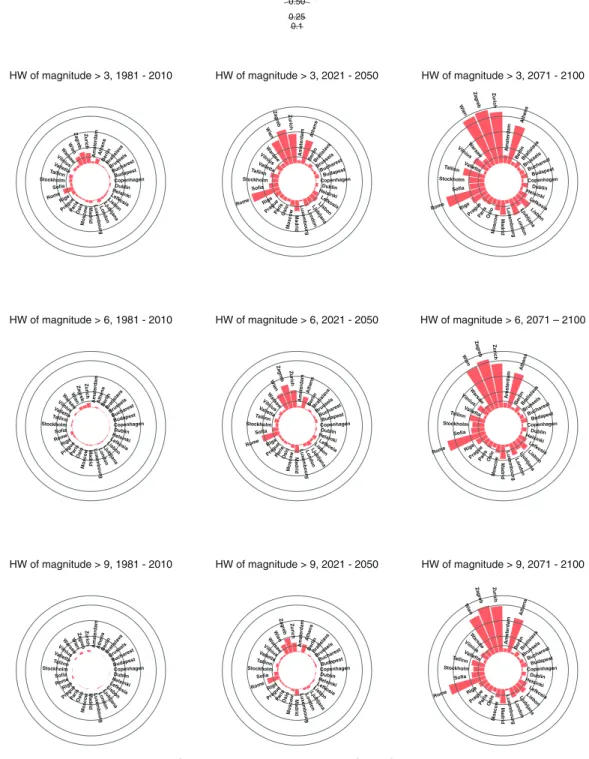
Thesefindings, illustrated byFig. 4, confirm that HWs will most likely strike the populous metropolises of Madrid, Rome and Athens commonly associated with extreme temperatures but also other cities, namely Wien, Zagreb, and Zurich should expect serious impacts in the future. The Maltese capital, Valletta, particularly emerges from the analyses, as it is projected to progress from a comparatively center position in the ranking for near past towards the most severe HWs by the end of this century. These impacts will likely be even more serious due to Valletta's geographic location in the middle of Mediterranean Sea where the humidity may enhance all the negative implication for local population (Russo et al., 2017).
Another importantfinding is related to relative change between near and distant future. Whereas the top ranked metropolises of Lefkosia, Madrid, Rome, Sofia and Valletta keep their leading positions, the continental European cities of Bucharest, Budapest, Fig. 2. Target cities with the population density (for 2010) indicated by colors, and severe HWs (magnitude > 3) occurrence between 1981 and 2010 illustrated by proportional sized background symbols.
Ljubljana, Prague Paris and Zagreb will experience a dramatic increase in HWs occurrence. This holds true for the HWs of all the analyzed magnitudes. Somewhat special case is represented by Athens, because it is ranked in between these two groups for the period 2021–2050 (particularly for magnitudes higher 6 and 9) but will belong to the top ranked capitals towards the end of century (Fig. 3). These relative changes between the two future periods are less striking when the population factor is taken in account. This is
Probability of HWs occurrence
HW of magnitude > 3, 1981 - 2010 HW of magnitude > 6, 1981 - 2010 HW of magnitude > 9, 1981 - 2010 HW of magnitude > 3, 2021 - 2050 Probability HW of magnitude > 6, 2021 - 2050 HW of magnitude > 9, 2021 - 2050 HW of magnitude > 3, 2071 - 2100 HW of magnitude > 6, 2071 – 2100 HW of magnitude > 9, 2071 - 2100 0.9 0.75 0.50 0.25 0.1 Amster dam Athens Berlin Bratisla va Brussels Buc harest Budapest Copenhagen Dublin Hels inki Lef kosia Lisbo n Ljubljana London Lu x emb ou rg Madrid Mosco w Oslo Paris Pra gue Riga Rome Sofia Stockholm Tallinn Valletta Vilniu s Wa rsaw Wien Za greb Zuric h Ams ter da m Ath e ns B erlin Bra tislava Brus sels Buch arest Budapest Copenhagen Dublin Hels inki Lef kosia Lisbon L jub ljan a Lo ndon Luxe m bo u rg Madrid Mosc ow Oslo Paris Prag ue Riga Rome Sofia Stockholm Tallinn Vallet ta Vilniu s W arsa w W ien Za greb Zuri c h A ms ter da m Ath en s Ber lin B ratisl ava Bruss els Buch arest Budapest Copenhagen Dublin Hels inki Lefk osia Lis bo n L jubljana Lon don Lu xe m b ou rg Madrid Mo s cow Os lo Paris Pra gue Riga Rome Sofia Stockholm Tallinn Valletta Vilnius W ars aw Wien Za greb Zu ric h Amste rdam Athens Be rlin Bra tisla va Brus sels Buchares t Budapest Copenhagen Dublin Helsinki L efk osi a Lis bon L jub ljana London Lux embou rg Madrid Mosc ow Oslo Paris Prag ue Riga Rome Sofia Stockholm Tallinn Vallett a Vilnius W ars aw Wien Za greb Z uric h A ms terda m At hen s Be rlin B ratisl ava Brus sels Buch arest Budapest Copenhagen Dublin Hels inki Le fko sia Lisbo n L jub ljana L ondon Lu xemb o u rg Madrid Mosc ow Oslo Par is Prague Riga Rome Sofia Stockholm Tallinn Valle tta Vilnius War saw Wien Za greb Zur ich Ams terda m Ath en s B erlin B ratis lava Br ussel s Bucha rest Budapes t Copenhagen Dublin He lsinki L efkosi a Lisbon L jub ljan a Lon don Lu x emb ou rg Madrid Mosc ow Os lo Par is Prague Riga Rome Sofia Stockholm Tallinn Vallett a Viln ius W arsaw Wien Zag reb Zuric h Amster dam Athen s B erlin Bra tislava Br ussels Bucharest Budapest Copenhagen Dublin Hel sinki L efkosi a L isbon Ljubljan a London Lu xembo u rg Madrid Mo sco w Osl o Paris Prague Riga Rome Sofia Stockholm Tallinn Vallett a Vilnius W arsa w Wie n Za greb Zu ric h A ms te rda m Ath en s B erlin Br atisl ava Bru ssels Buc harest Budapes t Copenhagen Dublin Hels inki Lef ko sia Li sbo n L jub ljana Lo ndon Lu xe m b ou rg Madrid Mosc ow Oslo Paris Pra gue Riga Rome Sofia Stockholm Tallinn Valletta Vilnius War saw W ien Za greb Zuri c h A ms te rd am Athe ns B erlin B rati slav a Br ussel s Buchar est Budapest Copenhagen Dublin He lsinki L efkosia Lis bon L jub lja na L ond on Lu xe m bo ur g Madrid M osc ow Os lo Paris Prague Riga Rome Sofia Stockholm Tallinn Vall etta Vilniu s W arsa w Wien Za gre b Zur ic h
a direct consequence of the methodology, where the multiplication between 2 vectors (HWs probabilities and exposure factor based on population densities– both on scale between 0 and 1) naturally often yields lower results to be plotted. Hence, even though the HWs exposure evolution (the dramatic increase for continental cities towards the end of the century) remains, the relative changes on the circular plots are also decreased.
Exposure to HWs – static population density
HW of magnitude > 3, 1981 - 2010 HW of magnitude > 6, 1981 - 2010 HW of magnitude > 9, 1981 - 2010 HW of magnitude > 3, 2021 - 2050 Probability HW of magnitude > 6, 2021 - 2050 HW of magnitude > 9, 2021 - 2050 HW of magnitude > 3, 2071 - 2100 HW of magnitude > 6, 2071 – 2100 HW of magnitude > 9, 2071 - 2100 0.9 0.75 0.50 0.25 0.1 Amste rda m Athens Be rlin Bra tisla va
Brussels Bucharest Budapest Copenhagen Dublin Helsinki Lefk osia Lisb on L jub ljan a London Lu x emb our g Madrid Mosco w Oslo Paris Prague Riga Rome Sofia Stockholm Tallinn Valletta Vilnius Wa rsaw Wien Za greb Zuric h Amste rdam Athens Ber lin Bra tisla va Brussels Bucharest Budapest Copenhagen Dublin Helsinki Lef ko sia Lis bon L jubl jana London Lu xe m bo urg Madrid Mosc ow Oslo Paris Pra gue Riga Rome Sofia Stockholm Tallinn Valle tta Vilnius War saw W ien Za greb Zuric h Amste rdam Athens Ber lin Bratisl ava Bruss els Buc harest Budapest Copenhagen Dublin Hel Lefksinki
osia L isbon Lju b ljana London Lu x emb our g Madrid Mo sco w Oslo Paris Pra gue Riga Rome Sofia Stockholm Tallinn Valletta VilniusWars aw Wien Za greb Zur ic h Amste rdam At hens Berl in Brati slav a Brus sels Buc harest Budapes t Copenhagen Dublin Hel sinki Lef ko sia Lisb on L jubljan a London Lu xe m b ou rg Madrid Mosco w Oslo Pari s Pra gue Riga Rome Sofia Stockholm Tallinn Vallett a Vilni us Wa rsaw Wien Zagr eb Zuric h A mste rdam A thens Berlin B rati slava Brussels Bucharest Budape st Copenhagen Dublin Helsinki Lefko sia Lis bo n Lj ub ljan a Lond on Lux em bo u rg Madrid Mosco w Oslo Paris Pra gue Riga Rome Sofia Stockholm Tallinn Valletta Vilnius Wa rs aw W ien Zagreb Zur ic h Amste rdam A the n s B erlin B rati slava Br usse ls Buc harest Budapes t Copenhagen Dublin Helsi nki Lef kosi a Lisb on Lj ubljana Lo ndon Lu x emb our g Madrid Mo s co w Oslo Pari s Pra gue Riga Rome Sofia Stockholm Tallinn Valletta
Vilnius Wa rsa w Wien Zag re b Zuri c h Amste rdam Athen s Berli n B ratisla va Brus sels Buch arest Budapes t Copenhagen Dublin Helsi nki Lef kosi a Lis bon L jub ljan a Lo ndon Lu x embou rg Madrid Mosco w Oslo Paris Pra gue Riga Rome Sofia Stockholm Tallinn Valletta Vil nius Wa rs aw Wien Za greb Zuric h A mste rdam Athens Berlin B rati slav a Brusse ls Buch arest Budape st Copenhagen Dublin Helsink i Lef kosi a Lis bo n Ljubl jana Lon don L ux emb ou rg Madrid Mosco w Oslo Pari s Prague Riga Rome Sofia Stockholm Tallinn Valle tta Viln ius W arsa w W ien Zagreb Zuri c h Amster dam Athens B erlin Brat islav a Brus sels Buch arest Budapes t Copenhagen Dublin Helsi nki Lefk osi a L isb on L jub ljana London Lu xe mb ou rg Madrid Mo s co w Oslo Paris Prag ue Riga Rome Sofia Stockholm Tallinn Valletta Vilni us W ars aw W ie n Za greb Zuric h
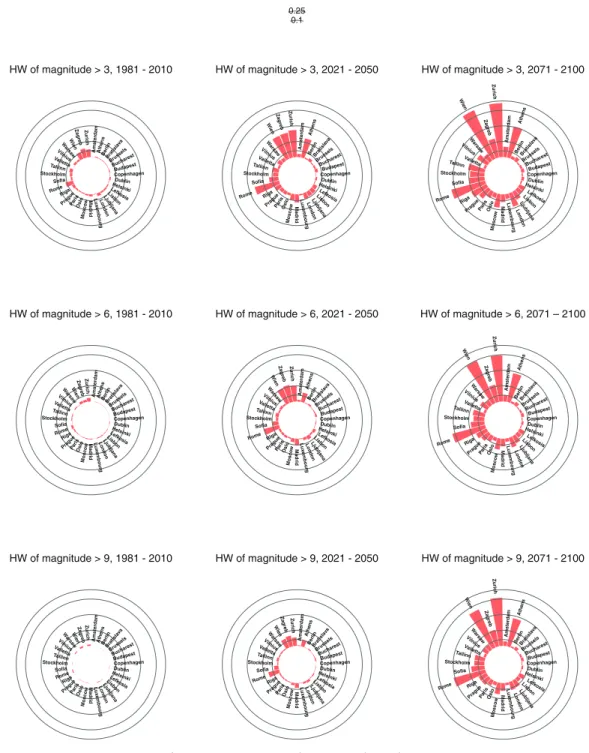
When the population densities are considered (Fig. 4andFig. 5), the less populous metropolitan areas located in warm climates (e.g. Lefkosia or Valletta) do not appear in top positions of our ranking. The cities of Athens, Rome, Wien, Zagreb and Zurich strongly emerge from the analyses as the most exposed to future HW hazard, followed by Lisbon, Ljubljana, London, Madrid, Sofia, Stockholm, and Tallinn. Moreover, the involvement of the projections of population density to the analyses (Fig. 5) brought only quantitative
HW of magnitude > 3, 1981 - 2010 HW of magnitude > 6, 1981 - 2010 HW of magnitude > 9, 1981 - 2010 HW of magnitude > 3, 2021 - 2050 Probability HW of magnitude > 6, 2021 - 2050 HW of magnitude > 9, 2021 - 2050 HW of magnitude > 3, 2071 - 2100 HW of magnitude > 6, 2071 – 2100 HW of magnitude > 9, 2071 - 2100 0.9 0.75 0.50 0.25 0.1 Amster dam Athens Ber lin Bratisla va
Brussels Buchare st Budapest Copenhagen Dublin Helsinki Lef kosia Lis bon L jub ljana London Lu x embou rg Madrid Mosc ow Oslo Paris Pra gue Riga Rome Sofia Stockholm Tallinn Va lletta Vilnius Wa rsaw Wien Za gr eb Zuric h A mste rdam At hens Ber lin Bratisl ava Brusse ls Bucha rest Budapest Copenhagen Dublin Helsinki Lef kosi a Lisb on L jubljana Lon don Lu xe mbo ur g Madrid Mosc ow Oslo Paris Prague Riga Rome Sofia Stockholm Tallinn Valletta Vilni us Wa rsa w Wien Z agreb Z uric h A mste rdam A thens B erlin Bratisl ava Brussels Bucharest Budapest Copenhagen Dublin Helsinki Lef ko sia Lisb on L jub ljan a London Lu xemb o urg Madrid Mo sco w Oslo Paris Prague Riga Rome Sofia Stockholm Tallinn Valletta Vilni us W ars aw Wien Zagr eb Zur ic h A m ster dam At hens Berlin B ratisla va Brus sels Buc harest Budapes t Copenhagen Dublin Helsinki Lefk osi a L isbo n L jub ljan a London Lu x embour g Madrid Mosco w Oslo Paris Prag ue Riga Rome Sofia Stockholm Tallinn Valletta Viln ius Wa rsa w Wien Zag reb Zuri ch Amste rdam A thens B erlin Br atisl ava Brusse ls Buc harest Budapes t Copenhagen Dublin Helsi nki Lefk osi a Lisb on Lj ubljana London L ux em bo u rg Madrid Mos cow Oslo Paris Prag ue Riga Rome Sofia Stockholm Tallinn Valletta Viln ius Wa rsa w Wien Za gr eb Zuric h Amste rdam Athens Berlin Br atisla va Br ussels Buch arest Budape st Copenhagen Dublin Hel sinki Lef ko sia L isbo n L jub ljan a London L ux em b ou rg Madrid Mo sco w Oslo Paris Pra gue Riga Rome Sofia Stockholm Tallinn Valle tta Vilnius W arsa w Wien Zagreb Zur ic h Amste rdam Athen s Ber lin Bratisl ava Bruss els Buch arest Budapes t Copenhagen Dublin Helsi nki Lefkosia Lisbo n Ljubljan a Lond on Lu x embou rg Madrid Mosc ow Oslo Pari s Pra gue Riga Rome Sofia Stockholm Tallinn Valletta Vilniu s Wa rs aw Wien Za greb Zuri ch Amster dam A thens Ber lin Br atis lava Brus sels Buc hares t Budapes t Copenhagen Dublin Helsi nki Lef ko sia L isbo n Ljubljana London Lu x embo urg Madrid Mos cow Oslo Paris Prag ue Riga Rome Sofia Stockholm Tallinn Valle tta Vilnius Wa rs aw Wien Za greb Zuric h Ams te rdam Athens Ber lin Brat islav a Brussels Buc harest Budapest Copenhagen Dublin Hel sinki Lefk osia Lisbo n L jubljana Londo n Lu xe mb our g Madrid Mo sc ow Oslo Paris Prag ue Riga Rome Sofia Stockholm Tallinn Valletta Vilni us W ar saw W ie n Za greb Zur ich
Exposure to HWs – dynamic population density
changes and does not change the resulting ranking order. We hypothesize that this hints the need for more elaborated demographic models rather than indicating that population density is not suitable proxy for the population exposure.
With the increasing of global mean temperature, model simulations indicate that the occurrence of CWs of magnitude > 3 is unlikely in all cities (Fig. 6). The estimated probabilities are smaller than 0.25 in all periods and vanish to almost zero in all cities in
Probability of CWs occurrence
CW of magnitude > 3, 1981 - 2010 CW of magnitude > 6, 1981 - 2010 CW of magnitude > 9, 1981 - 2010 CW of magnitude > 3, 2021 - 2050 Probability CW of magnitude > 6, 2021 - 2050 CW of magnitude > 9, 2021 - 2050 CW of magnitude > 3, 2071 - 2100 CW of magnitude > 6, 2071 – 2100 CW of magnitude > 9, 2071 - 2100 0.9 0.75 0.50 0.25 0.1 Amste rdam A then s Berlin Bratisl ava Brussels Buc harest Budapes t Copenhagen Dublin Helsink i Lefk osia Lisb on L jublj ana London Lu x embour g Madrid Mosco w Oslo Paris Pra gue Riga Rome Sofia Stockholm Tallinn Valletta Vilnius Wa rs aw Wien Za greb Zuri ch Am ste rda m A thens B erlin Br atis lava Brussels Buchare st Budapest Copenhagen Dublin Helsinki Lef ko sia Lis bon L jubl jan a Lond on L ux e mbo ur g Madrid Mosco w Oslo Paris Prague Riga Rome Sofia Stockholm Tallinn Valletta Vilni us Wa rs aw Wien Zag reb Zuri c h Amste rdam A thens B erlin Bra tisla va Brussels Buc harest Budapest Copenhagen Dublin Helsinki Lefk osia Lisb on L jub ljana London Lu xembo urg Madrid Mo s cow Oslo Paris Pra gue Riga Rome Sofia Stockholm Tallinn Valletta Vilnius War sa w W ien Za greb Zuric h Amster damAthens Berlin Bratisl
ava Bruss els Buch arest Budapest Copenhagen Dublin Helsinki Lefk osia Lisb on Ljubljana London Lux embour g Madrid Mosc ow Osl o Pari s Prag ue Riga Rome Sofia Stockholm Tallinn Valle tta Vilniu s Wa rsaw W ien Za greb Zuri ch A mste rdam A thens Berlin B ratisla va Bru ssel s Buch arest Budape st Copenhagen Dublin Helsi nki Lef ko sia Lisb on L jubl jana London L u xe mbo u rg Madrid Mos co w Oslo Pari s Prag ue Riga Rome Sofia Stockholm Tallinn Vallett a Vilnius W arsa w Wien Zag reb Zuri c h A mste rdam At hen s B erlin Br atisla va Bru ssel s Buch arest Budapes t Copenhagen Dublin Helsinki Lef kosi a Lis bo n L jub ljana London Lu xe m bo ur g Madrid Mo sco w Oslo Paris Pragu e Riga Rome Sofia Stockholm Tallinn Valletta Viln ius Wa rs aw Wien Za gr e b Zur ich Amster dam Athens Berlin B rati slav a Brus sels Buc harest Budapest Copenhagen Dublin Hel sinki Lef kosi a L isbon Ljubljana London Lux embou rg Madrid Mosc ow Oslo Paris Prag ue Riga Rome Sofia Stockholm Tallinn Valletta Vil nius Wa rsaw Wien Za greb Zuri ch A mster d am A thens B erlin B ratisla va Brussels Buch arest Budapest Copenhagen Dublin Hel sinki Lef ko sia Lisb on L ju bljana Lond on L ux em b ou rg Madrid Mosco w Oslo Paris Pragu e Riga Rome Sofia Stockholm Tallinn Valletta Vilni us Wa rsaw Wien Za greb Zuri ch A mste rdam At hens Ber lin Bratisl ava Bruss els Buch arest Budapest Copenhagen Dublin Helsi nki Lef kosia L isbo n Lj ub ljana Lon don L ux e m bo u rg Madrid Mo s cow Oslo Pari s Pra gue Riga Rome Sofia Stockholm Tallinn Valletta Vilnius Wa rsa w Wien Za greb Zuric h
distant future (2071–2100). In near future (2021–2050), the occurrence of CW exceeding the magnitude 3 is more likely in the cities of Zagreb and Zurich (probability > 0.18), Budapest and Paris (probability = 0.17) and Amsterdam, Berlin, Bratislava, Prague, Sofia, Warsaw (probability > 0.13), whereas the occurrence of CW stronger than value 6 of CWMId is more likely in the cities of Amsterdam, Bratislava, Bucharest, Paris, and Wien (probability > 0.1). The estimated probabilities of CW to be > 9 are smaller than 0.1 in all cities and within the three periods.
Because CWs are projected to not to be a major threat across all the European capitals, this can be considered, from the urban population perspective, as a positive impact of climate change and the exposure considering the population data was not analyzed. It should be emphasized that the results interpretation should be handled with caution. For example, the large metropolitan area of Amsterdam, even though being ranked with lowest risk in comparison to other European capitals towards the end of the century, has an estimated probability of occurrence of severe HWs equal to 0.66, and for extreme HWs the probability is 0.41 (chances of very extreme events are predicted to be 0.3). Hence, the result should not be misinterpreted as the extreme heat event will be no serious threat for such locations.
4. Conclusions and discussion
Heat waves are considered by IPCC the most important and dangerous hazard related to climate change and managing the impacts of HWs in cities is of paramount importance (UN-habitat, 2010) because it is the metropolitan space where the most people will encounter the extreme heat (Schatz and Kucharik, 2015). The alternation of climate impacts by urban space, described inSection 1, Introduction, will be not always necessarily negative. The CWs impacts may be softened by the joint influence of urban space and climate warming, such as reduction in winter heating demand and saved lives (Schatz and Kucharik, 2015;Kolokotroni et al., 2012). Nevertheless, the increasing negative impacts of extreme heat will by far outweigh the positive consequences.
Specifically in urban areas, the crucial negative impacts of extreme heat include health risks, human discomfort, associated higher concentrations of pollutants, lower water quality, increase in the energy demand for cooling, and decrease in the labor productivity (Dunne et al., 2013;Estrada et al., 2017;Zander et al., 2015).
As the most vulnerable groups amongst the urban dwellers the elderly, young, the individuals with preexisting chronic conditions, communities with weak socioeconomic status, people with mental disorders and isolated individuals are commonly listed (Basu, 2009; Habeeb et al., 2015;Keramitsoglou et al., 2017). The risk grows with continues aging in population of highly developed countries (Michelozzi et al., 2009). Moreover, the significant portion of wealthier elders choose to retire out of the urban zones. The remaining urban elders represent an important group in danger considering also their more frequent isolation, reluctance to spend on cooling, and urban effects on local climate (Habeeb et al., 2015;Hajat et al., 2014;Michelozzi et al., 2009;Son et al., 2012).
In Europe, where universal healthcare generally covers the entire population, the health impacts also represent direct monetary cost to governments. The health impacts span from heat cramps which may signalize heat exhaustion and heat strokes (Michelozzi et al., 2009;Russo et al., 2017) leading to fatal congestive heart failure or acute myocardial infraction (Koken et al., 2003), to respiratory diseases. In high-income settings of European capitals only a smaller proportion of fatalities occurs due to hyperthermia as such (Hajat et al., 2014).
This study does not substitute a detailed city-specific vulnerability assessment, neither explicitly quantifies the impacts in monetary or epidemiological terms. Our results provide insights regarding the future evolution of temperature related exposure of population across all the European capitals. We showed that the cold waves exhibit a decreasing frequency with already smaller impacts in the midcentury and almost entirely vanishing in far future. This is in agreement with previous work on Iberian Peninsula byPereira et al. (2017). We confirmed that HWs will most likely strike the populous metropolises of Madrid, Rome and Athens commonly associated with extreme temperatures but also other cities, namely Valletta, Sofia, Wien, Zagreb, and Zurich should expect serious impacts in the future. The Swiss capital– Zurich, deserves the particular attention since it was marked as the city with the most significant rise in HWs intensity (quantified as 12.9C) from all the European capitals (supplementary ofGuerreiro et al., 2018) and so far it does not represent recognized HWs impact hotspot. The Maltese capital, Valletta, particularly emerges from the analyses, as it is projected to progress from a comparatively center position in the ranking for near past towards the most severe HWs by the end of this century. Our results generally agree with previous studies (e.g.Peterson et al., 2012) that increase in magnitude of heat waves and decrease in magnitude of cold spells over entire European domain can be expected. Moreover, we confirm that by the end of the century the relatively higher increase in the intensity of future heat will take a place along south– northeast gradient (Pereira et al., 2017), with the most dramatic rise in HWs magnitudes in Central Europe (supplementary ofGuerreiro et al., 2018), and also in south-central Europe (Fischer and Schär, 2010). To this we can add south-east European region (represented in this study by cities of Bucharest and Sofia), where we expect the HWs of comparable severity as in Mediterranean, closely followed by Moscow which is typically not included in most of European studies. Our study is complemented by MetroHeat web tool allowing to visualize, analyse, and download all the computed data. This increases the transparency, facilitates the comparisons with other studies, and more importantly will foster the research of others. The web tool is described in the Supplementary Material, and it is available athttps:// cgranell.shinyapps.io/metroheat/.
Currently, in places such as Valletta or Lisbon the humidity may already play an important role but in future also other locations, for example, large coastal agglomerations of Northern Europe, can be exposed to severe impacts of humid HWs. The absence of humidity in our analyses represents a limitation of this work and it is one of the directions for further research. Nevertheless, in continental European areas relative humidity does not play a significant role during heat waves. For example the two most out-standing events on record (HWs of 2003 and 2010) were characterized as not humid (Russo et al., 2017).