NHESSD
3, 3023–3055, 2015Storms or cold fronts?
L. J. Otero et al.
Title Page
Abstract Introduction
Conclusions References
Tables Figures
◭ ◮
◭ ◮
Back Close
Full Screen / Esc
Printer-friendly Version Interactive Discussion
Discussion
P
a
per
|
Discussion
P
a
per
|
Discussion
P
a
per
|
Discussion
P
a
per
|
Nat. Hazards Earth Syst. Sci. Discuss., 3, 3023–3055, 2015 www.nat-hazards-earth-syst-sci-discuss.net/3/3023/2015/ doi:10.5194/nhessd-3-3023-2015
© Author(s) 2015. CC Attribution 3.0 License.
This discussion paper is/has been under review for the journal Natural Hazards and Earth System Sciences (NHESS). Please refer to the corresponding final paper in NHESS if available.
Storms or cold fronts? What is really
responsible for the extreme waves regime
in the Colombian Caribbean coast
L. J. Otero, J. C. Ortiz-Royero, J. K. Ruiz-Merchan, A. E. Higgins, and S. A. Henriquez
Applied Physics Group – Ocean and Atmosphere Area – Physics Department, Universidad del Norte, Barranquilla, Colombia
Received: 9 April 2015 – Accepted: 20 April 2015 – Published: 4 May 2015
Correspondence to: L. J. Otero ([email protected])
NHESSD
3, 3023–3055, 2015Storms or cold fronts?
L. J. Otero et al.
Title Page
Abstract Introduction
Conclusions References
Tables Figures
◭ ◮
◭ ◮
Back Close
Full Screen / Esc
Printer-friendly Version Interactive Discussion
Discussion
P
a
per
|
Discussion
P
a
per
|
Discussion
P
a
per
|
Discussion
P
a
per
|
Abstract
On Friday, 7 March 2009, a 200 m-long section of the tourist pier in Puerto Colombia collapsed under the impact of the waves generated by a cold front in the area. The aim of this study is to determine the contribution and importance of cold fronts and storms on extreme waves in different areas of the Colombian Caribbean to determine the
de-5
gree of the threat posed by the flood processes to which these coastal populations are exposed and the actions to which coastal engineering constructions should be subject. In the calculation of maritime constructions, the most important parameter is the wave’s height; therefore, it is necessary to definitively know the design wave height to which a coastal engineering structure should be resistant. This wave height varies according to
10
the return period considered. Using Gumbel’s extreme value methodology, the signifi-cant height values for the study area were calculated. The methodology was evaluated using data from the re-analysis of the spectral NOAA Wavewatch III (WW3) model for 15 points along the 1600 km of the Colombia Caribbean coast (continental and insu-lar) of the last 15 years. The results demonstrated that the extreme waves caused by
15
tropical cyclones and cold fronts have different effects along the Colombian Caribbean coast. Storms and hurricanes are of greater importance in the Guajira Peninsula (Alta Guajira). In the central area formed by Baja Guajira, Santa Marta, Barranquilla, and Cartagena, the strong influence of cold fronts on extreme waves is evident. On the other hand, in the southern region of the Colombian Caribbean coast, from the Gulf
20
of Morrosquillo to the Gulf of Urabá, even though extreme waves are lower than in the previous regions, extreme waves are dominated mainly by the passage of cold fronts. Extreme waves in the San Andrés and Providencia insular region present a different dynamic from that in the continental area due to its geographic location. The wave heights in the extreme regime are similar in magnitude to those found in Alta Guajira,
25
NHESSD
3, 3023–3055, 2015Storms or cold fronts?
L. J. Otero et al.
Title Page
Abstract Introduction
Conclusions References
Tables Figures
◭ ◮
◭ ◮
Back Close
Full Screen / Esc
Printer-friendly Version Interactive Discussion
Discussion
P
a
per
|
Discussion
P
a
per
|
Discussion
P
a
per
|
Discussion
P
a
per
|
These results are of great importance when evaluating the threat of extreme waves in the coastal and port infrastructure, for purposes of the design of new constructions, and in the coastal flood processes due to run-up because, according to the site of interest in the coast, the forces that shape extreme waves are not the same.
1 Introduction
5
Waves, which are also responsible for the sedimentary dynamics, are the main source of coastal energy. The waves generated by “sea”-type local winds and those generated offshore by atmospheric disturbances known as swells determine the average and ex-treme maritime climate of a region. The activities that develop in coastal or maritime areas, such as fishing, maritime transport and transit, oil exploitation, structure design,
10
and even surfing, each require knowledge of waves. The maritime climate, particularly winds, is a dynamic phenomenon that presents short-period cyclic variations (daily, weekly), seasonal variations, and long-term variations. Considering that winds are the main wave-generating agent, the wave climate also varies based on this pattern. Given the incidence of the wave climate in the operation and construction costs of maritime
15
infrastructures, it is important to design these constructions taking into account the temporal variation of this phenomenon at an oceanic and local scale.
Cold fronts occur when 2 air masses at different temperatures and densities come into proximity. The cold air mass with higher density pushes the hot air, making it as-cend. The rising hot air cools down, producing clouds, the pressure gradient in the area,
20
strong winds, storms, and increases in the wave height or swell through its passage along the Colombian Caribbean coast (Ortiz et al., 2013).
The incidence of cold fronts in the Colombian Caribbean coast has not been widely studied. Cold fronts are noted in the marine-meteorological monthly reports of the Center of Oceanographic and Hydrographic Research (Centro de Investigaciones
25
NHESSD
3, 3023–3055, 2015Storms or cold fronts?
L. J. Otero et al.
Title Page
Abstract Introduction
Conclusions References
Tables Figures
◭ ◮
◭ ◮
Back Close
Full Screen / Esc
Printer-friendly Version Interactive Discussion
Discussion
P
a
per
|
Discussion
P
a
per
|
Discussion
P
a
per
|
Discussion
P
a
per
|
the region under study has been described by Ortiz et al. (2014a), where the most im-portant marine-meteorological event of the last 10 years in the Colombian Caribbean, the passage of a cold front on March 2009 whose associated waves caused 200 m of the pier at Puerto Colombia to collapse, was reconstructed.
Ortiz et al. (2013) performed the characterization of cold fronts in the central region
5
of the Colombian Caribbean and their relation with extreme waves, finding that cold fronts have been the cause of the major waves in this region over the last 15 years.
However, Ortiz (2012) and Ortiz et al. (2014b) described the threat of hurricanes in the Colombian Caribbean. Joan in 1988 and Lenny in 1999 were 2 of the most important events in the continental Caribbean coast, while for San Andrés Island, the
10
list is longer: Hattie in 1961, Alma in 1970, Joan in 1988, Cesar in 1996, Katrina in 1999, and Beta in 2005 are hurricanes that have affected the island over the last 50 years. This history is why the San Andrés y Providencia Archipelago is the zone in the Colombian Caribbean that is most vulnerable to hurricane threats.
In this context, the traditional method of constructing the extreme wave regime has
15
consisted of performing predictions of waves based on historical information for a pe-riod no less than 10 years (Martínez and Coria, 1993; Naveau et al., 2005). Based on this information, the most unfavorable extreme values of each year are selected, and the results are then extrapolated to different return periods.
Although there is no physical, theoretical, or empirical evidence of which should be
20
the selection or adjustment of a probability distribution function for the calculation of the design wave height, the Gumbel or Fisher Tippett I and Weibull distribution functions are widely used for such purposes, as reported by Martínez and Coria (1993), Katz et al. (2002), García et al. (2004), and Naveau et al. (2005).
In response to the lack of information on the variability of extreme waves in coasts of
25
NHESSD
3, 3023–3055, 2015Storms or cold fronts?
L. J. Otero et al.
Title Page
Abstract Introduction
Conclusions References
Tables Figures
◭ ◮
◭ ◮
Back Close
Full Screen / Esc
Printer-friendly Version Interactive Discussion
Discussion
P
a
per
|
Discussion
P
a
per
|
Discussion
P
a
per
|
Discussion
P
a
per
|
should be subjected and, similarly, to assess the degree of the threat to which coastal populations are exposed due to flood processes caused by wave run-up.
2 Description of the study area
The coastline of the Colombian Caribbean has a wide territory that extends from 8 to 13◦N and from the border with Panamá in the southwest (SW) at longitude 79◦W to
5
the Guajira Peninsula on the northeast (NE) at longitude 71◦W. The Colombian coastal area is approximately 1600 km in length and includes important cities from the eco-nomic and touristic perspective: Riohacha, Santa Marta, Barranquilla, and Cartagena. The total area of the Colombia Caribbean is approximately 590 000 km2. These cities are maritime and river ports of great importance for the economy of the country. Of
10
the 4 cities, the most populated city is Barranquilla (2 400 000 inhabitants), followed by Cartagena (1 200 000 inhabitants), Santa Marta (415 000 inhabitants), and Riohacha (150 000 inhabitants).
The insular Colombian Caribbean in formed by the Archipelago of San Andrés, Prov-idencia, Santa Catalina, the Rocandor, Quitasueño, Serranía, and other cays, adjacent
15
islets, and deep-water coral reefs.
San Andrés Island is located in the Caribbean Sea, at 180 km east of Nicaragua and northeast of Costa Rica and 480 km northwest of the Colombian coast (Parsons, 1954). The island of San Andrés is the largest of the islands that form part of the Archipelago of San Andrés, Providencia, and Santa Catalina, with a total extension of 26 km2. It is
20
surrounded on its northwestern side by a small coral reef and several cays that are home to marine flora and fauna (Geister, 1973).
It is interesting to review and analyze the phenomenon responsible for the extreme wave regime in this area because the entire region of the Colombian Caribbean is not found at the same latitude.
25
NHESSD
3, 3023–3055, 2015Storms or cold fronts?
L. J. Otero et al.
Title Page
Abstract Introduction
Conclusions References
Tables Figures
◭ ◮
◭ ◮
Back Close
Full Screen / Esc
Printer-friendly Version Interactive Discussion
Discussion
P
a
per
|
Discussion
P
a
per
|
Discussion
P
a
per
|
Discussion
P
a
per
|
the region occurs from December to May; in this season, swells produced by cold fronts can occur. The wet season occurs the rest of the year, interrupted by a relative minimum in June and July known as Indian summer (Andrade and Barton, 2001). The dry season and Indian summer are associated with the jet stream winds of San Andrés and the northeastern (NE) trade winds. When the jet stream of San Andrés is stronger,
5
the dry season occurs in the entire Caribbean coast, coinciding with very intense NE trade winds; the same occurs with Indian summer (Andrade and Barton, 2001). By contrast, the wet season, which ranges from August to November, coincides with the time of most intense jet stream winds from Chocó and less intense jet stream winds from San Andrés (Poveda, 2004).
10
Along this entire region, the rainiest month of the year is October, and the driest months are February and March. From December to March, the intertropical conver-gence zone (ITCZ) is located over South America, the high pressure centers are strong in the Caribbean, and the northeast trade winds are maximal, which is consistent with the main dry season in the Caribbean region. From July to September, the location of
15
the ITCZ shifts towards the center of the Caribbean, trade winds weaken, and south-west (SW) winds, which are weaker but can bring strong storms to the Caribbean re-gion, dominate. These annual periods coincide with maximums in the jet streams from San Andrés and Chocó, respectively. However, the second maximum jet stream from San Andrés, which occurs from July to August and is associated with Indian summer,
20
is not directly related to the ITCZ but instead to a temporal intensification of the high pressure system from the North Atlantic (Andrade and Barton, 2001).
Wiedeman (1973) and Kjerfve (1981) established that Caribbean tides are weak, with a tidal range oscillating from 20 to 30 cm and occasionally surpassing 50 cm; therefore, it was classified as microtidal (range<2 m). Using information from different tide
sta-25
NHESSD
3, 3023–3055, 2015Storms or cold fronts?
L. J. Otero et al.
Title Page
Abstract Introduction
Conclusions References
Tables Figures
◭ ◮
◭ ◮
Back Close
Full Screen / Esc
Printer-friendly Version Interactive Discussion
Discussion
P
a
per
|
Discussion
P
a
per
|
Discussion
P
a
per
|
Discussion
P
a
per
|
with a tidal range of 48 cm (García et al., 2011), while the insular region of San Andrés is found within the mixed tidal classification and is mainly semidiurnal.
The annual wave cycle presents a bi-modal behavior influenced by the NE trade winds, showing 2 wind periods, intense waves, and low precipitation in the dry season and 2 wind periods, weak waves, and high precipitation during the wet season (Mesa,
5
2010).
3 Methodology
In the area under study, there are no extensive historical records of waves of an exper-imental nature (Meza, 2010). Buoys of the National Oceanic and Atmospheric Admin-istration (NOAA) are very far from the coastal zone of the Colombian Caribbean. The
10
DIMAR controls several directional buoys near the Colombian coasts in the Caribbean and the Pacific. For the Caribbean, the DIMAR has 2 buoys, 41 193 and 41 194, lo-cated near the coasts of Barranquilla and Riohacha, respectively, and in the central Caribbean, the NOAA controls scalar buoy 42 058, as shown in Fig. 1.
The National Data Buoy Center (NDBC) database has records for 2008, 2009, and
15
2010. Directional buoy 41 194, which began operation in 2007, is located near Bocas de Ceniza, which is the mouth of the Magdalena River in the Caribbean Sea, located near the city of Barranquilla. Directional buoy 41 193 is near Puerto Bolívar (Guajira Department) and has records since 2010, and buoy 42 058 has been collecting data since 2005. Therefore, to characterize the wave climate, it is necessary to resort to
20
data obtained from models, visual waves, or satellites (Agudelo et al., 2005). Accord-ing to Martínez and Coria (1993), for an analysis of extreme waves, it is necessary to have at least 10 years of wave data in the area of interest. For this purpose, a his-toric database of 15 years (1999–2013) from 15 re-analysis buoys distributed along the Caribbean coastline from the Wavewatch III (WW3) program, was initially analyzed
25
NHESSD
3, 3023–3055, 2015Storms or cold fronts?
L. J. Otero et al.
Title Page
Abstract Introduction
Conclusions References
Tables Figures
◭ ◮
◭ ◮
Back Close
Full Screen / Esc
Printer-friendly Version Interactive Discussion
Discussion
P
a
per
|
Discussion
P
a
per
|
Discussion
P
a
per
|
Discussion
P
a
per
|
coast into 4 zones, as proposed by Ortiz (2012), in accordance with their level of vul-nerability to the threat of hurricanes.
Given the limited information of oceanographic buoys in the area of study, detailed parametric calibration and validation were applied to the re-analysis wave series for data coinciding with the significant wave heights (Hs) in undefined depths for a zone
5
in the Caribbean where data from oceanographic buoys existed. In this study, the data from buoy 42 058 was used for the calibration of the database, and the data from buoy 41 194 was used for validation. Buoy 42 058 was selected to perform the calibration process for 2 main reasons: first, due to the higher extension of continuous data avail-able and, second, due to its location in undefined depths.
10
From the data on significant wave heights (Hs) from the WW3 model for the point 14.9◦N–75◦W and the data collected by oceanographic buoy 42 058, a detailed para-metric calibration method was applied for coinciding data using power and linear re-gression models (Sampedro, 2010). With the coefficients obtained in each regression model, the data from the series corresponding to buoy Bv05 were corrected. These
15
data were validated with the values of significant wave heights (Hs) measured by oceanographic buoy 41 194 of Barranquilla, Colombia.
With the aim of verifying the degree of adjustment of the measured and calculated time series, theDadjustment index and the Average DeviationP described by Willmott (1981) were applied. To determine the adjustment degree of the regression models, the
20
r2correlation coefficient was used.
In accordance with Wornon and Welsh (2002a, b), theDindex is very sensitive to er-rors in the mean square root of the difference between predictive and observed values. AD=0 shows total dissociation, whileD=1 shows a perfect association between the measured and calculated data. Willmott’sDindex is defined as:
25
D=1−
PN
n=1(P n−On) 2 PN
n=1(|P n−O|+|On−O|)2
NHESSD
3, 3023–3055, 2015Storms or cold fronts?
L. J. Otero et al.
Title Page
Abstract Introduction
Conclusions References
Tables Figures
◭ ◮
◭ ◮
Back Close
Full Screen / Esc
Printer-friendly Version Interactive Discussion
Discussion
P
a
per
|
Discussion
P
a
per
|
Discussion
P
a
per
|
Discussion
P
a
per
|
wherePnis the prediction performed,On are the measurements, andOis the mean of the measurements performed.
The Average DeviationP is defined as:
bias(P)=
PN
n=1(P n−On) 2 PN
n=1On
. (2)
For example, a deviation of−0.05 shows mean underestimations of the order of 5 %.
5
To differentiate the influence of cold fronts on hurricanes, calculations of extreme val-ues were performed for 2 seasons of the year: the hurricane season of the Caribbean from June to November and the cold front season from December to May.
For the calculation of extreme values, Gumbel’s maximum distribution or Fisher-Tippet type I distribution were selected. This distribution is suitable for random,
identi-10
cally distributed, and independent variables and is widely used to characterize extreme regimes of oceanographic geophysical variables. Gumbel’s maximum distribution is a bi-parametric function with a location parameter λ and a scale parameter δ (Gar-cía et al., 2004).
F(x)=e−e−b (3)
15
where b=x−u
α (4)
α=Sx
λ (5)
u=x−δα (6)
x is the data series, Sx is the SD, andx the arithmetic mean of the data series. The
20
values ofλandδare selected according to the number of data, in this case,λ=0.5128 andδ=1.0206.
NHESSD
3, 3023–3055, 2015Storms or cold fronts?
L. J. Otero et al.
Title Page
Abstract Introduction
Conclusions References
Tables Figures
◭ ◮
◭ ◮
Back Close
Full Screen / Esc
Printer-friendly Version Interactive Discussion
Discussion
P
a
per
|
Discussion
P
a
per
|
Discussion
P
a
per
|
Discussion
P
a
per
|
4 Analysis and results
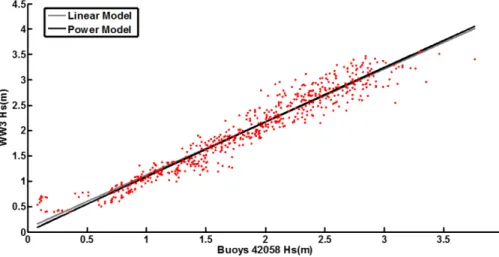
Figure 3 shows the results of the calibration of theHs WW3 re-analysis data and the data from the Central Caribbean oceanographic buoy (42 058). The lines represent the linear regression Eq. (7) and power regression Eq. (8) models. The dispersion diagram shows that both models present a good correlation with the data, with r2 values of
5
0.92 and 0.93 for the power and linear regression models, respectively. The calibration equations obtained were the following:
Hscal=aHsbuoys+b(a=1.047±0.024;b=0.07619±0.047) (7) Hscal=aHb
sbuoys(a=1.096±0.0265; b=0.9847±0.0284). (8)
Based on the previous calibration relations, theHs data from the WW3 model in the
10
coordinate point 11.25◦N–74.75◦W, coinciding with the location of buoy 41 194, were corrected.
Figure 4a compares the uncorrectedHsvalues of the WW3 model and the data from buoy 41 194, with a D=0.97 and a bias(P)=−0.06. Figure 4b and c compares the Hs series from buoy 41 194 with the Hs series corrected using a linear and power
re-15
gression model, respectively. Based on the adjustment indexDand Willmott’s Average DeviationP, the improvement in the adjustment degree in theHstime series are shown in Table 1. As shown in the table, the indices show improvements of equal proportion for both models. In this sense, the linear regression model was selected for the correction of the WW3Hsseries of the 15 points selected for the analysis.
20
Once the information of the data for each of the 15 buoys was calibrated and vali-dated, we proceeded to perform a detailed analysis from which a total of 8 buoys were selected as representative samples of each of the zones of interest based on theHs value and the location of the cities and ports of interest.
As noted above, tropical cyclones occur in the season from June to November, and
25
NHESSD
3, 3023–3055, 2015Storms or cold fronts?
L. J. Otero et al.
Title Page
Abstract Introduction
Conclusions References
Tables Figures
◭ ◮
◭ ◮
Back Close
Full Screen / Esc
Printer-friendly Version Interactive Discussion
Discussion
P
a
per
|
Discussion
P
a
per
|
Discussion
P
a
per
|
Discussion
P
a
per
|
wave analysis. That is, the extreme regime was calculated considering only theHs in-formation for the months between June and November, and the extreme regime was also calculated taking into account only the months from December to May. Addition-ally, the extreme regime was calculated considering the complete series to identify which seasons of the year contributed the most to this regime. This method of
present-5
ing the results allows a comparative analysis to identify in which seasons of the year the most extreme waves for the area occur and also to establish which atmospheric phenomenon is responsible for generating these extreme waves.
The results of the application of Gumbel’s theory for the significant heightHson each of the 8 buoys are shown in Figs. 6–9 in the order in which the previous results were
10
presented.
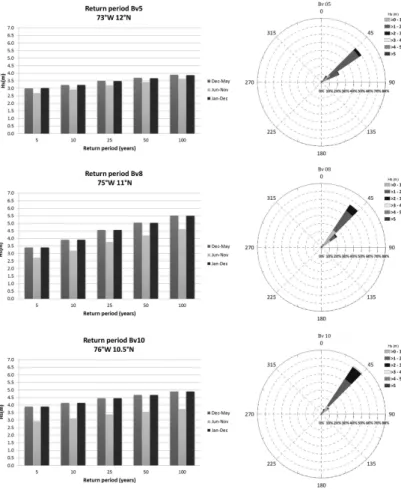
Virtual buoys Bv01–Bv04 are located in the arid zone of the Alta Guajira, north of the Colombian Caribbean (Zone 01 in Fig. 2). The bar diagrams in Fig. 5 explicitly show that the height of extreme waves is clearly influenced by tropical cyclones. Dur-ing this period, the extreme waves associated with return periods of 5 and 10 years
15
show a probability of exceedance of 20 and 10 %, respectively, oscillating between 4.2 and 4.8 m. For return periods of 25, 50, and 100 years, the probability of exceedance is 4, 2, and 1 %, respectively, varying between 5.5 and 6.6 m in height. The highest waves for this region occur because Alta Guajira is the closest zone to the trajectory of tropical cyclones passing through the Colombian Caribbean (Ortiz, 2012). According
20
to Rodríguez (2011), during this time of the year, there is a higher probability of the passage of tropical waves from the east (known as such due to their movement from east to west) that can evolve into tropical depressions, tropical storms, and hurricanes. On the other hand, the dry season of the year, from December to March, is influenced by the increase of trade winds from the northeast (Bernal et al., 2006; Paramo et al.,
25
NHESSD
3, 3023–3055, 2015Storms or cold fronts?
L. J. Otero et al.
Title Page
Abstract Introduction
Conclusions References
Tables Figures
◭ ◮
◭ ◮
Back Close
Full Screen / Esc
Printer-friendly Version Interactive Discussion
Discussion
P
a
per
|
Discussion
P
a
per
|
Discussion
P
a
per
|
Discussion
P
a
per
|
waves for return periods of 25, 50, and 100 years take significant height values that vary between 4.4 and 4.8 m.
Regarding the waves’ direction, it is considered that it is likely from E and ENE with heights mainly between 1 and 3 m.
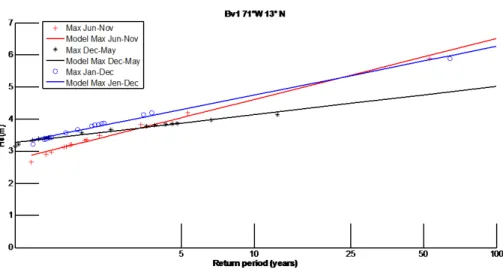
When comparing the extreme regime for virtual buoys Bv01 and Bv02 located in the
5
Alta Guajira area, it can be observed that the significant heights, for return periods of 5 and 10 years that take the complete series of annual maximums, show values greater than the significant heights obtained when dividing the series by season. However, for a return period of more than 25 years, the significant height extrapolated from the cyclone season data surpasses the significant height obtained with the annual
maxi-10
mums. This occurs because, over the 15 years of the registry, there were 2 years in which the maximum significant height was presented in hurricane season. These val-ues were the highest of the record (between 4.0 and 5.9 m). In the remaining 13 years, the maximum significant height in cyclone season is lower in comparison to the wave height registered in the cold front season. This difference in the significant height for
15
each period generates a greater dispersion in the maximums of the season from June to November. The difference in the SD of data causes an increase in the slope of the lineHsagainst the return period in the semi-logarithmic space (Fig. 6) of the model for the cyclone season. In the remaining virtual buoys, there is no variation in the extreme regime when increasing the return period because all of the extreme wave events are
20
found to be related to 1 of the 2 seasons is shown in Fig. 7.
The diagrams of Fig. 8, correspond to the central zone of the Colombian Caribbean formed by Baja Guajira, Santa Marta, Barranquilla, and Cartagena (Zone 02 in Fig. 2). Because of the geographic location of this zone in Colombia, it is important to highlight that the dry and wet climate seasons present a significant variability in the duration and
25
NHESSD
3, 3023–3055, 2015Storms or cold fronts?
L. J. Otero et al.
Title Page
Abstract Introduction
Conclusions References
Tables Figures
◭ ◮
◭ ◮
Back Close
Full Screen / Esc
Printer-friendly Version Interactive Discussion
Discussion
P
a
per
|
Discussion
P
a
per
|
Discussion
P
a
per
|
Discussion
P
a
per
|
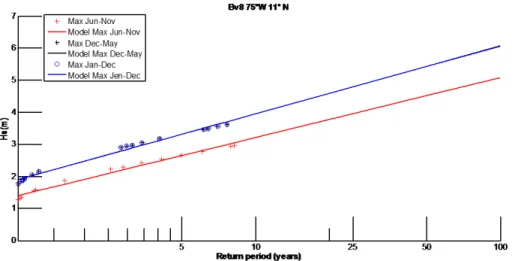
It can be seen that in Bv05, for both the cyclone season (June–November) and the cold front season (December–May), there are similar magnitudes in the extreme waves. From Bv07, it can be seen that the most energetic waves in the coastal zone of this region are influenced by cold fronts. Therefore, the extreme waves for return periods of 5 and 10 years register significant heights between 3.8 and 4.0 m, and the extreme
5
waves for return periods of 25, 50, and 100 years present values that vary between 4.2 and 4.6 m in height, while the less energetic waves are dominated by tropical cyclones. Return periods of 5 and 10 years of these extreme waves register oscillations in their significant height from 3.2 to 3.4 m, and the extreme waves for return periods of 25, 50, and 100 vary between 3.6 and 4.0 m in height.
10
In this transition region, the behavior of extreme waves is modified because a clearer and stronger preponderance of cold fronts begins, decreasing the influence of tropical storms on this regime. This modification can clearly be seen in Fig. 8, where the ex-treme regime calculated considering the complete series is influenced by the maximum wave heights that occur in the cold front season.
15
It is important to highlight that the wave height extreme regime in the central zone of the Caribbean begins to decrease according to the extreme wave regime present in Alta Guajira because this zone of the Colombian coast ceases to be directly influenced by tropical cyclones and the extreme regime starts to prevail due to the passage of cold fronts.
20
Cold fronts have influenced the extreme waves in the Colombian Caribbean, affecting the coastal infrastructure over the last 16 years. It could be established that the most significant extreme wave event associated with cold fronts in the Colombian Caribbean destroyed the old pier of Puerto Colombia, near the city of Barranquilla. In Fig. 9, shows a photograph taken 2 h after the collapse of this pier. This event occurred between
25
NHESSD
3, 3023–3055, 2015Storms or cold fronts?
L. J. Otero et al.
Title Page
Abstract Introduction
Conclusions References
Tables Figures
◭ ◮
◭ ◮
Back Close
Full Screen / Esc
Printer-friendly Version Interactive Discussion
Discussion
P
a
per
|
Discussion
P
a
per
|
Discussion
P
a
per
|
Discussion
P
a
per
|
In relation to the direction of the waves, it is reported that, in this sector of the central Colombia Caribbean, the NE direction is predominant with heights mainly between 1 and 2 m. With respect to zone 01, the energy in the average regime is less, and the direction of the wave trains is affected by the orientation of the coast line, which goes from NE to SW.
5
The data shown in Fig. 10, correspond to the zone known as the western Caribbean, which is formed by the area between the Morrosquillo Gulf and the Urabá Gulf (Zone 03 in Fig. 2). In this zone, regardless of season, the wave energy is lower in comparison to the other zones of the Colombian Caribbean because the Morrosquillo Gulf is protected from winds by Boquerón Island and the other islands of San Bernardo, the Urabá Gulf
10
is protected from waves in the eastern zone, and the Colombia bay is protected by its closed-U shape. The northwestern coast of the gulf directly receives waves originating from the open sea (Escobar, 2011). In this zone of the Colombian Caribbean, few studies have been conducted on waves, especially on waves in the Urabá Gulf.
The winds of this region also have bimodal characteristics with a predominance of
15
strong winds from the north and northeast in the dry season. In the wet season, winds from the south and southeast predominate (Roldán, 2007). Oceanic-atmospheric fac-tors such as winds and waves present significant differences between the dry season (December–April) and wet season (the remaining months), which in turn is in accor-dance with the displacement of the ITCZ (Meza et al., 1997).
20
The bar diagrams on Fig. 10 show that the least energetic waves of the entire Colom-bian coast, which are mainly influenced by the passage of cold fronts, can be found in this area. The significant height for return periods of 5 and 10 years show values oscil-lating between 4.0 and 4.2 m, and the extreme waves for return periods of 25, 50, and 100 years take values that vary between 4.5 and 4.9 m in height. On the other hand,
25
NHESSD
3, 3023–3055, 2015Storms or cold fronts?
L. J. Otero et al.
Title Page
Abstract Introduction
Conclusions References
Tables Figures
◭ ◮
◭ ◮
Back Close
Full Screen / Esc
Printer-friendly Version Interactive Discussion
Discussion
P
a
per
|
Discussion
P
a
per
|
Discussion
P
a
per
|
Discussion
P
a
per
|
wave height is clearly influenced by cold fronts, which is confirmed when the values of the extreme wave heights are calculated taking into account the complete series of maximum heights. Regarding the waves’ direction in the southwestern Colombian Caribbean sector, NE and NNE are predominant, with heights mainly between 1 and 2 m. Regarding zones 01 and 02, the energy in the average regime is lower.
5
Bv15 is located in the insular region of San Andrés and Providencia (Zone 04 in Fig. 2). In Fig. 11 shows that extreme waves for return periods of 5 and 10 years have significant height values between 4.0 and 4.3 m for the wet season influenced by hurricanes, while for the dry season influenced by cold fronts, the values oscillate between 4.5 and 4.7 m. The extreme waves for return periods of 25, 50, and 100 years
10
take values that vary between 5.1 and 5.7 m in height for the dry season influences by cold fronts, while for the wet season, the values for extreme values oscillate between 4.8 and 5.4 m. Because of its geographic location out over the Colombian Caribbean Sea, the islands of San Andrés and Providencia exhibit high vulnerability to tropical storms and the passage of cold fronts (Ortiz et al., 2014b). Regardless of the analyzed
15
series, it is clearly evident that the waves generated by cold fronts are the waves that govern the extreme regime. This is because the passage of hurricanes very close to the island of San Andrés and Providencia has a lower frequency than the passage of cold fronts.
Previous studies have revealed that, according to historical records for the years
20
1900 to 2013, a total of 17 hurricanes have affected San Andrés and Providencia, and in 7 of these phenomena, the eye of the storm was located less than 150 km from the islands. Of these 7 hurricanes, Joan in 1988 generated the highest wave heights, with significant height values of 5.0 m SE of the island of San Andrés in the 50 m isobath (Ortiz et al., 2014b). The position of Bv15 coincides with the outline of the intermediate
25
NHESSD
3, 3023–3055, 2015Storms or cold fronts?
L. J. Otero et al.
Title Page
Abstract Introduction
Conclusions References
Tables Figures
◭ ◮
◭ ◮
Back Close
Full Screen / Esc
Printer-friendly Version Interactive Discussion
Discussion
P
a
per
|
Discussion
P
a
per
|
Discussion
P
a
per
|
Discussion
P
a
per
|
hurricane season are considered, then the return period associated with this value is 50 years. It is important to highlight that, over the last 50 years, of all the hurricanes that have affected the island of San Andrés, only Joan has generated wave heights of 5.0 m (Ortiz et al., 2014b). This finding means that wave heights in the extreme regime associated with the passage of cold fronts in Zone 04 have lower return periods than
5
the wave heights associated with the hurricane season.
The wind speed patterns in the islands of San Andrés and Providencia are influenced by fluctuations in the Azores anticyclone, the latitudinal fluctuations of the ITCZ, the entrance of cold fronts, and the passage of hurricanes in the zone.
The wide insular platform and coral reefs located along the northeast coast act as
10
a natural defense that dissipates the energy of waves before they reach the coast. The southwest coast is completely exposed to the extreme waves’ energy due to its narrow insular platform and scarce coral reefs (Ortiz et al., 2014b).
5 Conclusions
The present study has allowed the conclusion that extreme waves along the Colombian
15
Caribbean coasts (continental and insular) are not generated by the same forces. The geomorphology of the 1600 km of coastline of the Colombian Caribbean and its geo-graphical position ensure that the waves generated by extreme events do not have the same magnitude of influence in all areas. There is a clear difference for the north zones (Alta Guajira), central zones (Baja Guajira, Santa Marta, Barranquilla, and Cartagena),
20
west zone (Morrosquillo Gulf and Urabá Gulf), and the Archipelago of San Andrés be-cause the waves’ extreme regime is influenced by the spatial and temporal changes of the atmospheric phenomena that develop over a particular zone in the Colombian Caribbean coast, depending on the dry and wet climatic seasons.
Based on the analysis of the variability of extreme waves in the continental coast of
25
NHESSD
3, 3023–3055, 2015Storms or cold fronts?
L. J. Otero et al.
Title Page
Abstract Introduction
Conclusions References
Tables Figures
◭ ◮
◭ ◮
Back Close
Full Screen / Esc
Printer-friendly Version Interactive Discussion
Discussion
P
a
per
|
Discussion
P
a
per
|
Discussion
P
a
per
|
Discussion
P
a
per
|
consistent with the findings reported in Ortiz (2012), followed by the central zone (Zone 02), where the influence of extreme waves is associated with the passage of cold fronts, while less energetic extreme waves occur in the western part of the Caribbean (Zone 03), where they are mainly forced by the passage of cold fronts.
The extreme waves in the insular region of San Andrés and Providencia (Zone 04)
5
show a dynamic different from the continental region due to its geographic location. Although the waves’ heights in the extreme regime are similar in magnitude to those found for Zone 01 (Alta Guajira), the extreme waves associated with the passage of cold fronts in this zone have lower return periods than the extreme waves associated with the hurricane season.
10
The previous results make a valuable contribution to the moment of determining the extreme regime and the design waves for the construction of coastal infrastructure. Further, they provide an important component for the planning of alert and mitigation strategies against marine-meteorological threats. In addition, because different zones of the Colombian Caribbean are affected by coastal erosion, this study constitutes
15
a source of data for the further analysis of how and how much these events are related to erosion.
Acknowledgement. The authors wish to express their gratitude to the Directorate of Research and Projects (Dirección de Investigaciones y Proyectos – DIDI) of the Universidad del Norte and to the Departamento Administrativo de Ciencia y Tecnología e Innovación de Colombia
20
(COLCIENCIAS) for their support in conducting this research.
References
Agudelo, P., Restrepo, A., Molares. A., Tejada. C., Torres. R., and Osorio, A.: Determinación del clima medio y extremal en el Caribe Colombiano (Determination of the average and extreme climate in the Colombian Caribbean), Boletín Científico CIOH, 23, 33–45, 2005.
25
NHESSD
3, 3023–3055, 2015Storms or cold fronts?
L. J. Otero et al.
Title Page
Abstract Introduction
Conclusions References
Tables Figures
◭ ◮
◭ ◮
Back Close
Full Screen / Esc
Printer-friendly Version Interactive Discussion
Discussion
P
a
per
|
Discussion
P
a
per
|
Discussion
P
a
per
|
Discussion
P
a
per
|
Bernal, G., Poveda, G., Roldán, P., and Andrade, C.: Patrones de variabilidad de las temper-aturas superficiales del mar en la Costa Caribe Colombiana (Variability patterns of the sea surface temperatures in the Colombian Caribbean coast), Rev. Acad. Colomb. Cienc., 30, 195–208, 2006.
Escobar, C.: Relevance of coastal processes on the hydrodynamics of The Gulf Of Urabá
5
(Colombian Caribbean Sea), Boletín de Investigaciones Marinas y Costeras-INVEMAR, 40, 327–346, 2011.
García, F., Palacio, C., and Garcia, U.: Tide constituents at Santa Marta Bay (Colombia), Dyna, 78, 142–150, 2011.
García, V., Garcia-Bartual, R., Cabrera, E., Arregui, F., and García, J.: Stochastic model to
10
evaluate residential water demands, J. Water Pl. Manage., 130, 386–394, 2004.
Geister, J.: Los arrecifes de la isla de San Andres (Mar Caribe, Colombia) (The coral reefs in the island of San Andrés (Caribbean Sea, Colombia)), Mitt Inst. Colombo Alemán Invest. Cient., 7, 211–228, 1973.
Katz, R. W., Parlange, M. B., and Naveau, P.: Statistics of extremes in hydrology, Adv. Water
15
Resour., 25, 1287–1304, 2002.
Kjerfve., B.: Tides of the Caribbean Sea, J. Geophys. Res., 86, 4243–4247, 1981.
Martínez, A. and Coria, P.: Distribución de probabilidad de la altura del oleaje dentro de la bahía de Todos los Santos, B. C. (Probability distribution of waves’ height inside the Todos los Santos Bay, B. C.), México, Cienc. Mar., 19, 203–218, 1993.
20
Mesa, J. C.: Metodología para el reanálisis de series de oleaje para el caribe colombiano (Methodology for the re-analysis of wave series for the Colombian Caribbean), Tesis Doc-toral, Universidad Nacional de Colombia, Colombia, Medellin, 5–12, 2010.
Mesa, O., Poveda, G., and Carvajal, F.: Introducción al Clima de Colombia (Introduction to Colombia’s climate), Illustrated, Universidad Nacional de Colombia, Medellín, Colombia, 23–
25
27, 1997.
Molares, R.: Clasificación e identificación de las componentes de marea del Caribe Colom-biano (Classification and identification of the components of the Colombian Caribbean tide), Boletín científico CIOH, 22, 105–114, 2004.
Nystuen, J. and Andrade, C.: Tracking mesoscale ocean features in the Caribbean Sea using
30
Geosat altimetry, J. Geophys. Res.-Oceans (1978–2012), 98, 8389–8394, 1993.
NHESSD
3, 3023–3055, 2015Storms or cold fronts?
L. J. Otero et al.
Title Page
Abstract Introduction
Conclusions References
Tables Figures
◭ ◮
◭ ◮
Back Close
Full Screen / Esc
Printer-friendly Version Interactive Discussion
Discussion
P
a
per
|
Discussion
P
a
per
|
Discussion
P
a
per
|
Discussion
P
a
per
|
Ortiz, J. C., Salcedo, B., and Otero, L.: Investigating the collapse of the Puerto Colombia Pier (Colombian Caribbean Coast) in March of 2009: methodology for the reconstruction of ex-treme events and their impact on the coastal infrastructure, J. Coast. Res., 30, 291–300, 2014a.
Ortiz, J. C., Plazas, J. M., and Lizano, O.: Evaluation of Extreme Waves Associated with
Cy-5
clonic Activity on San Andrés Island in the Caribbean Sea since 1900, J. Coastal Res., doi:10.2112/JCOASTRES-D-14-00072.1, in press, 2014b.
Ortiz-Royero, J. C., Otero, L. J., Restrepo, J. C., Ruiz, J., and Cadena, M.: Cold fronts in the Colombian Caribbean Sea and their relationship to extreme wave events, Nat. Hazards Earth Syst. Sci., 13, 2797–2804, doi:10.5194/nhess-13-2797-2013, 2013.
10
Naveau, P., Nogaj, M., Ammann, C., Yiou, P., Cooley, D., and Jomelli, V.: Statistical methods for the analysis of climate extremes, C. R. Geosci., 337, 1013–1022, 2005.
Paramo, J., Correa, M., and Núñez, S.: Evidencias de desacople físico-biológico en el sis-tema de surgencia en La Guajira, Caribe colombiano (Evidence of the physico-biological decoupling of the upwelling system in La Guajira, Colombian Caribbean), Rev. Biol. Mar.
15
Oceanogr., 46, 421–430, 2011.
Parsons, J. J.: English Speaking Settlement of the Western Caribbean, Yearbook of the Asso-ciation of Pacific Coast Geographers, 16, 3–16, 1954.
Poveda, G.: La hidroclimatología de Colombia: una síntesis desde la escala inter-decadal hasta la escala diurna (The hydroclimatology of Colombia: a synthesis from the inter-decade scale
20
to the diurnal scale), Rev. Acad. Colomb. Cienc., 28, 201–222, 2004.
Rodríguez, L.: Identificación de zonas homogéneas en la interfase mar-aire del mar caribe colombiano y relación entre la variabilidad de parámetros oceanicos y atmosféricos de al-gunos puntos representativos de estas zonas y la oscilación atlántico norte (Identification of homogeneous areas at the sea–air interphase of the Colombian Caribbean Sea and relation
25
between the variability of oceanic and atmospheric parameters of some representative points of these zones and the North Atlantic Oscillation), Tesis de maestria. Universidad Nacional de Colombia, Columbia, Medellín, 35–40, 2011.
Roldán, P.: Modelamiento del patrón de circulación de la bahía Colombia, golfo de Urabá – Im-plicaciones para el transporte de sedimentos (Modeling of the movement pattern of
Colom-30
NHESSD
3, 3023–3055, 2015Storms or cold fronts?
L. J. Otero et al.
Title Page
Abstract Introduction
Conclusions References
Tables Figures
◭ ◮
◭ ◮
Back Close
Full Screen / Esc
Printer-friendly Version Interactive Discussion
Discussion
P
a
per
|
Discussion
P
a
per
|
Discussion
P
a
per
|
Discussion
P
a
per
|
Sampedro, T.: Metodologías de calibración de bases de datos de reanálisis de clima marí-timo (Methodologies of the calibration of marine climate reanalysis database), PhD Thesis, Universidad de Cantabria, Cantabria, España, 69–89, 2010.
Tolman, H. L.: A third-generation model for wind waves on slowly varying, unsteady and inho-mogeneous depths and currents, J. Phys. Oceanogr., 21, 782–797, 1991.
5
Wiedemann, H.: Reconnaissance of the Ciénaga Grande de Santa Marta, Colombia: physical parameters and geological history, Mitt. Inst. Colombo-Alemán Invest. Cient., 7, 85–119, 1973.
Willmott, C.: On the validation of models, Phys. Geogr., 2, 183–194, 1981.
Wornon, S. and Welsh, D.: An MPI quasi time-accurate approach for nearshore wave prediction
10
using SWAN code, Part I, Coast. Eng. J., 44, 247–256, 2002a.
NHESSD
3, 3023–3055, 2015Storms or cold fronts?
L. J. Otero et al.
Title Page
Abstract Introduction
Conclusions References
Tables Figures
◭ ◮
◭ ◮
Back Close
Full Screen / Esc
Printer-friendly Version Interactive Discussion
Discussion
P
a
per
|
Discussion
P
a
per
|
Discussion
P
a
per
|
Discussion
P
a
per
|
Table 1.Adjustment indexDand Willmott’s Average Deviation P, data from buoy 41 194 and WW3 model.
Significant HeightHs(m) D Bias (P)
WW3 vs. Buoy (41 194) 0.97 −0.06
WW3 corrected with linear 0.99 0.02
regression vs. Buoy (41 194)
WW3 corrected with power 0.99 0.02
NHESSD
3, 3023–3055, 2015Storms or cold fronts?
L. J. Otero et al.
Title Page
Abstract Introduction
Conclusions References
Tables Figures
◭ ◮
◭ ◮
Back Close
Full Screen / Esc
Printer-friendly Version Interactive Discussion
Discussion
P
a
per
|
Discussion
P
a
per
|
Discussion
P
a
per
|
Discussion
P
a
per
|