ORIGINAL PAPER
Specifying social structures in preschool classrooms:
descriptive and functional distinctions between affiliative
subgroups
António J. Santos&Brian E. Vaughn&Kelly K. Bost
Received: 12 February 2008 / Revised: 14 July 2008 / Accepted: 25 July 2008
# Springer-Verlag and ISPA 2008
Abstract Preschool children attending Head Start pro-grams (N=586, 296 boys and 290 girls, between 3 and 5 years of age, over 95% African–American) were observed to determine physical proximity to peers as well as rates of visual attention given and received. Sociometric data were used to derive peer acceptance scores, peer friendships, and sociometric status classifications. Three subgroup types (high mutual proximity (HMP), lower mutual proximity (LMP), and ungrouped children) were identified through complete linkage hierarchical clustering and chi-square procedures from the proximity data. HMP subgroups tended to be larger, to have higher sociometric acceptance scores, and children in these subgroups had more recipro-cated friendships than was true for the other subgroup types. Significant within-group preferences and out-group biases were observed for both HMP and LMP subgroups using measures of visual attention and sociometric choice data, but these were more marked for HMP subgroups. Results are consistent with previous ethological studies of
affiliative structures in preschool classrooms and also show that methods of data collection and analysis from social ethology and child psychology research traditions are mutually informing.
Keywords Peer relations . Affiliative structure . Stratification
That peers and peer groups constitute critical socialization agents and contexts for children is part of the conventional wisdom of developmental science (e.g., Cairns and Cairns
1995; Hartup 2005; Rubin, Bukowski and Parker 1998; Sherif et al. 1961). From the earliest years, children seek out peers as interactive partners and engage in a broad range of social exchanges (e.g., Bronson 1981; Hay et al.
1983; Strayer and Santos 1996). By the end of the second year, it is common to observe that toddlers prefer specific peers as play partners and these preferences may persist for several years, evolving into close friendships (e.g., Howes and Phillipsen 1992, 1998). By the preschool period (nominally 3- to 6-years of age), children are aware of individual differences in the quality and quantity of peer social behavior and this understanding grounds (in part) their judgments about the likeableness of specific peers (e.g., McCandless and Marshall1957). Beyond preschool age, the potential for peers to influence the behavior, character development, and social preferences of children and adoles-cents rivals the influences of parents (e.g., Bukowski et al.
1996; Cairns and Cairns1995; Harris1995).
Studies of peer interactions, peer relationships, and peer groups as contexts for socialization and development have been mounted from two distinct theoretical traditions. On the one hand, studies of preschool children from the traditions of child and clinical psychology tend to focus on the individual child and the effects her or his behavioral,
DOI 10.1007/s10211-008-0047-0
Communicated by J. J. Soler A. J. Santos (*)
Unidade de Investigação em Psicologia Cognitiva do Desenvolvimento e da Educação,
Instituto Superior de Psicologia Aplicada, Lisboa, Portugal
e-mail: asantos@ispa.pt B. E. Vaughn
Department of Human Development and Family Studies, Auburn University,
Auburn, AL, USA K. K. Bost
Department of Human and Community Development, University of Illinois at Urbana-Champaign, Urbana, IL, USA
character, experiential attributes, or relationships with others may have on her or his own development or on the behavior and opinions of peers and less attention is paid to structural features and processes inherent in the stable groups within which these social exchanges take place. On the other hand, these very structural features of children’s groups (e.g., linear hierarchies vs. non-linear networks), as well as the social dimensions and processes underlying structure (e.g., dominance vs. friendship; avoidance or ambivalence vs. approach or contact), and/or the affordan-ces and constraints on behavior and character development embedded in group structures are central foci of studies from social ethological and sociological traditions (e.g., Cairns et al.1995; Hawley and Little1999; Strayer 1980; Strayer and Santos1996; Strayer and Strayer1976).
We here suggest that these two approaches to the study of peer interactions are not necessarily irreconcilable and rather that they may be bridged. Studies of group structure highlight concepts of social niches and potential roles associated with occupation of specific niches that offer novel perspectives on behavioral constraints at the individ-ual level (Vaughn and Santos2007). For example, Hawley and Little (1999) showed that aggressive, dominating behavior of certain children was modulated by the dominance status of their social partners. Specifically, individuals occupying a middle position in the group dominance order tended to behave aggressively toward those children in lower ranks but were submissive when interacting with children occupying higher ranks. Thus, expression of their aggressive tendencies was contingent on the relative position of both children in the classroom dominance order.
Cairns and associates (e.g., Cairns et al.1990; Cairns et al.
1985; Farmer and Rodkin 1996) adopted a sociological approach with their Social Cognitive Mapping (SCM) technique which solicits nominations of children in the larger social group who “hang out together” (i.e., who constitute a subgroup). Using SCM, subgroups can be distinguished in terms of social centrality (vs. socially peripheral), as a function of the number of peers mentioning individuals or subgroups and children identified by peers as not belonging to a subgroup are considered socially isolated (see Gest et al.2001). SCM has been used with children as young as 7–9 years of age, however, the cognitive demands of the task make it difficult for preschoolers and, to our knowledge, no team has successfully used the standard SCM protocol with preschool children. Rather, studies of affiliative subgroups for very young children rely on naturalistic observations of proximity and interaction among group members.
In a research program modeled after group structure studies in non-human primates, Santos, Strayer, and their associates identified subgroups based on physical proximity
within classrooms of very young children. Briefly, Strayer and Santos (1996) used hierarchical cluster analysis to group children into affiliative subgroups (i.e., two or more children whose profiles of association across all other classmates are similar to a significant degree) and they identified two distinct subgroup types in several class-rooms. One type, social cliques or clique like affiliative subgroups, had members with similar proximity profiles who also had a high degree of proximity to each other and the second type, social aggregates, had members with similar profiles vis-à-vis other classmates but whose proximity to each other was not statistically significant. For this report, we refer to these two subgroup types as “high mutual proximity” (HMP) and “lower mutual proximity” (LMP), respectively. Children who were not members of either subgroup type constituted a third social category. We refer to these children as “ungrouped.” Children in HMP subgroups showed strong in-group preferences (i.e., children were more likely to prefer subgroup co-members in sociometric tasks, (Santos et al.
2000) and stratification of subgroups according to average within-subgroup level of sociometric acceptance suggested that in-group preferences were greatest for subgroups with the highest average level of peer acceptance.
For the present study, children between 3 and 5 years of age were assessed using the cluster techniques and criteria described by Santos and Strayer (1997). In addition to proximity information, we collected data concerning the distribution of visual attention to peers and sociometric choices. Both of these sources of data are useful for testing in-group preferences and they also have meaning at the group level insofar as peer acceptance (from sociometric interviews) and social centrality (from visual attention data) summarize information across all classmates. These data afford opportunities to test several methodological and substantive hypotheses. First, we anticipated that hierarchi-cal cluster analyses of proximity matrices for these children would yield a distribution of subgroup types similar to those reported by Santos, Strayer, and their associates (i.e., HMP, LMP, ungrouped); that somewhat larger subgroups would be found in classrooms of older children; and that the most affiliative subgroups would be segregated by sex. Second, we tested for differences between subgroup types (HMP vs. LMP vs. ungrouped) in terms of group preference and centrality indices. If HMP subgroups are analogous to “socially central” subgroups in SCM studies we should find that HMP subgroups have higher sociomet-ric acceptance scores and are more frequently the objects of peers’ visual attention (as compared to children in LMP subgroups). Third, we tested the hypothesis that children prefer members of their own subgroup on visual attention and sociometric measures, and that in-group preferences of members are conditioned on the relative sociometric status
of subgroups, because preference for subgroup members will be observed primarily for those subgroups with high sociometric status (e.g., Santos et al.2000).
The sociological and ethological traditions represented by the Cairns and associates’ and Santos and Strayer and associates’ studies both suggest parallels in the sorts of niches available within groups at younger and older ages. For example, the HMP and LMP subgroups identified by Santos and Strayer (1997) seem analogous to the “central” and “peripheral” categories identified in the SCM studies (e.g., Cairns et al. 1995). Similarly, the “ungrouped” children identified by Santos et al. (2000) bear a resem-blance to the socially“isolated” type in SCM studies (e.g., Gest et al.2001). However, the data available for preschool children do not permit a determination of the degree to which these apparent analogies across age levels are deep or superficial. One final purpose of this report is to explore differences between the HMP, LMP, and ungrouped cases that might link the Santos and Strayer categories more closely to the taxonomy of groups from SCM studies. This report takes advantage of data collected in 30 different classrooms. Furthermore, the classrooms were located in Head Start programs and over 95% of children were African–American; thus, replications would extend the generality of the findings to a sample whose socio-demographic characteristics differ from those previously studied.
Materials and methods Participants
Participants were recruited from six Head Start programs (30 different classrooms). A total of 243 younger children (i.e., children <48 months of age at the start of the academic year, hereafter“3-year-olds,” 116 boys, 127 girls) were observed and interviewed. A total of 343 older children (i.e., children between 48 and 60 months of age at the start of the academic year, hereafter “4-year-olds,” 163 girls, 180 boys) were observed and interviewed. The sample of 4-year olds included 115 children who also had been observed in the previous project year as 3-year olds. Class rosters were shuffled annually in the Head Start centers so the sub-sample observed longitudinally had a substantially different group of peers in subsequent years and none were observed with the same teachers or by the same research assistants across years. Because the children seen longitudinally were integral to their groups insofar as they were recipients of peer initiations and themselves were initiators of interactions to peers, it is not possible to exclude them from the group-level analyses reported in this article. Over 95% of participating children were African–American.
All children attending classes in participating Head Start programs were invited to participate in the project. Most classrooms were homogeneous with respect to age of the children (i.e., either 3- or 4-year olds); however, two classrooms were mixed-age, with approximately equal numbers of younger and older children. Letters describing the project were distributed to parents and no child was interviewed unless the parent (or adult guardian) returned a signed consent form. Head Start teachers and administrative personnel supported this project and encouraged mothers to give consent for child participation. In addition, mothers received a small monetary incentive ($10 to $25) for their participation in other aspects of the project and the centers received an incentive ($50) for each classroom with 90% participation. Participation rates ranged from 75% to 100% of children in every classroom. These rates of participation are due, in large part, to the support of the teachers and administrators and the incentives provided.
Assessments
All assessments for a given classroom took place within a 3- to 6-week time frame. Teams of research assistants independently collected the observation and interview data. Because two to four classrooms were observed in each Head Start program, the observation teams were not in the same classroom at the same time. When possible, socio-metric interviews were completed in classrooms when observation teams were in other classrooms. In most classrooms, each type of observation data was collected over a period of five to ten consecutive class days. Observations started within two months of the beginning of each academic year (which was mid-August for the Head Start programs included in the study) and continued until the academic year ended in June. Thus, some classrooms were observed before the Christmas break and some after the break. For this report, we have divided the academic year into three “terms” (fall, winter, spring) as a conve-nience for analysis. Eleven classrooms were seen in the fall term, eleven in the winter, and eight in the spring term. Social proximity observations Using a focal individual sampling design, children were observed for a 15-s interval. At the end of the sampling interval, the child’s nearest peer neighbor was identified. A peer who was within arm’s reach (roughly 3–4 feet) and who was engaged in the same or a similar activity as the target child was considered the nearest neighbor of the target. If two or more children were equally close to the focal child (as often happened when children were engaged in table activities or in group time) the peer to the child’s immediate right was considered as nearest neighbor. For instances in which a child was interacting verbally or physically with a peer at the end of
the 15-s interval, the interacting partner was considered as the nearest neighbor, even though another child might be physically closer. This was most frequently true for table activities during which the target might have had a conversation with a peer across the table, rather than with the child immediately adjacent. Research assistants re-ceived training in the observation schedule and achieved agreement rates of 80% or more prior to initiating classroom observations. Teams of observers made between 90 and 125 (mean=102, SD=9) observation rounds in each classroom. The order of observation was determined by the child’s position on the classroom roster, with the reserva-tion that observers started observing at different posireserva-tions from the roster during consecutive observation rounds. Two to six observers collected data in any given classroom. In each classroom, observers spent approximately 60 min on the first observation day to become familiar with the names of participating children. Each observer completed between five and eight rounds (i.e., all children present on a given day observed five to eight times) of the class daily (25 to 40 rounds per 5 days). The numbers of observation rounds completed by different observers were approximately equal within a given classroom.
Twenty-five different observers collected these data over the two project years, which made fully pair-wise estimates of rater agreement impractical. Reliability of the nearest neighbor scores was calculated by computing Cronbach’s α coefficient in each of the 30 classrooms. The vector of nearest neighbor scores contributed by an individual rater was treated as a single item. This estimate assesses the reliability of scores contributed by different observers, rather than between-observer agreement per se for a child’s nearest neighbor on a specific observation. For these classrooms and raters Cronbach’s α, ranged from α=0.55 to α=0.98 across observers within classrooms (median= 0.94), indicating that observers tended to agree regarding which peers were most frequently the nearest neighbors of focal children.
Visual regard observations The same team of observers collecting nearest neighbor information also collected visual regard data. Rounds of visual regard observation were interspersed with the nearest neighbor rounds. Working from class rosters, the observers watched each child present in class for a 6-s interval and recorded the identity codes of all peers receiving a unit of visual attention from the observed target. If the target child looked at a group in which a particular child could not be singled out, this orientation was recorded as a questionable instance (?). If the child looked at an object held by a peer, this too was recorded as a questionable instance. Questionable units were not counted in child total scores. A target child was observed for each round of the class when the child’s name
appeared on a class list, and no child was observed twice before all children present were observed once. Between 170 and 225 rounds of observation were collected in each classroom (mean = 202, SD= 11), with the numbers of observations being distributed approximately evenly across. The average total visual regard given and received score was 156 units and the average rate score (i.e., total divided by number of times observed) was 0.88.
Previous research using these observation protocols has demonstrated that observers quickly reach agreement rates of 80% and above for visual regard recipients with only limited training (Bost et al. 1998; Vaughn and Martino
1988; Vaughn and Waters1980,1981; Waters et al.1983). For this study, training typically took less than 90 min and no observer failed to achieve 80% agreement with a partner in live observations. Using the same logic as for the nearest neighbor observation data (presented above), examination of total scores for each observer was justified. The median alpha coefficient for the 30 classes was 0.85 (range 0.50 to 0.94). These analyses suggest that visual regard was assessed reliably, even though common indices of rater agreement were foregone.
Sociometric measures All children completed three picture sociometric tasks: (a) positive and negative nominations, (b) paired comparisons, (c) rating scale. In each task, judgments were solicited about all classmates (both boys and girls). The assessments took place outside of the classroom in a quiet area of the Head Start center. Typically, the nominations task was administered first, followed by the rating-scale task. The paired comparison measure was always administered last. Sociometric interviews took between 30 and 45 min to complete (usually two or three 15-min sessions). If a child’s attention appeared to wander, the interviewer stopped the task and continued the interview at another time.
For the nominations task, children were presented with the array of photographs of all classmates and asked to name each one. After successfully naming all classmates, the child was asked to identify a peer that she or he “especially liked.” The request was repeated two more times and then the child was asked to identify a peer she or he “did not especially like” (again repeated twice). Photo-graphs were turned face down as the child made nomi-nations. After making three positive and three negative nominations, the child was asked to return to the array and identify additional children she or he liked. These were turned face down as nominated until the child had made a choice for each class member in the array. In this task, every classmate received a score indicating the order in which she or he was chosen. Only the first three positive choices were used to assess peer acceptance. The nomina-tion score for peer acceptance was the number of times a
child was one of her or his peers’ top three choices. Similarly, the negative nominations score was the number of times a child was identified as “not especially liked.” Both positive and negative nominations scores were standardized within classroom to control for differences in class sizes. For the rating-scale task, the child was presented with photographs of classmates in a random order and asked to indicate how much the peer was liked by placing the photo into one of the three buckets. The child was also asked to verbalize his choice. The target child was assigned a score of“3” if he or she was “liked a lot” and a score of“1” if she or he was “not liked very much.” These scores were used to identify unilateral and mutual prefer-ences (see below) but did not enter into the overall sociometric acceptance score. For the paired comparisons task, a card was prepared for all possible pairs (total number of comparisons in a given class=(n×n−1)/2, and these were shown to the child being interviewed. The child was asked“which of these two children do you especially like,” for each pair. The ordering of pairs was such that all children in a given group were seen once before any child was seen twice and each child’s photograph appeared an equal number of times on the left and right hand sections of the stimulus cards. The peer acceptance score was calculated as the total number of choices received from peers divided by the number of classmates completing the task. As with the nominations data, these scores were standardized within classroom prior to analysis.
Friendship choices
Following Vaughn et al. (2000), sociometric data were used to identify friendship dyads. To be considered as a“friend” a peer had to appear among the top four children nominated in the first sociometric task or to be among the top four children in the paired comparisons task and had to receive a rating of “3” on the rating-scale task. When both members of a specific dyad identified each other as preferred by these criteria, they were designated as a “reciprocated” dyad. When only one member of a specific dyad identified the other as preferred, the dyad was designated as “non-reciprocated.” Friendship dyads so identified (Vaughn et al.
2001) show high levels of social interaction and proximity and the level of social interaction in reciprocated dyads exceeds the level in non-reciprocated dyads.
Co-occurrence matrices
The first step in our analysis involved tabulating nearest neighbor observations for each child in a classroom. Children were assigned rows in a dyadic matrix and observed frequencies of proximity with each peer as nearest
neighbor were tabulated into columns. This produced an asymmetrical dyadic matrix. At the next step, the matrix was rotated on its major diagonal and added to itself, resulting in a symmetric dyadic co-occurrence matrix (i.e., AB=BA). The symmetric co-occurrence matrix was used to examine similarity of proximity profiles for each classroom using the complete linkage hierarchical clustering algo-rithm. Pearson correlations provided frequency independent measures of similarity of association.
Hierarchical cluster analysis is a set of techniques for identifying groups of similar objects (or persons) from larger sets of objects when the number of groups is not known a priori. The complete linkage (also called furthest neighbor) algorithm separates clusters on the basis of the largest distance between any pair of objects within clusters. Numerical taxonomists (e.g., Legendre and Legendre1983; Sneath and Sokal 1962) have suggested that this algorithm is useful for taxonomy problems because it tends to form tight, spherical clusters of objects/persons. The algorithm suits our needs to identify children with similar profiles of proximity to other classmates but it may over-identify such groups and (as is the case for all clustering methods) the fact of grouping cases together does not necessarily prove that the clusters have meaning.
To provide a check on the integrity of the clusters, we first chose an arbitrary level of within-cluster similarity (i.e., average within-cluster correlation coefficient at the conven-tional level of significance, p<0.05) to identify subgroups vs. ungrouped cases. Second, to identify high vs. lower mutual proximity subgroups, we split the subgroups according to the level of mutual proximity among group co-members. If the probability of proximity frequencies among members was <0.001 in aχ2test, a subgroup was considered to show high mutual proximity. If the probability of proximity frequencies was less than 0.001 for any subgroup member in these tests, the subgroup was considered to be lower in mutual proximity. We recognize that this statistical distinction between types of affiliative subgroup is arbitrary and we use data that did not contribute to identifying the clusters themselves to validate the cluster solution.
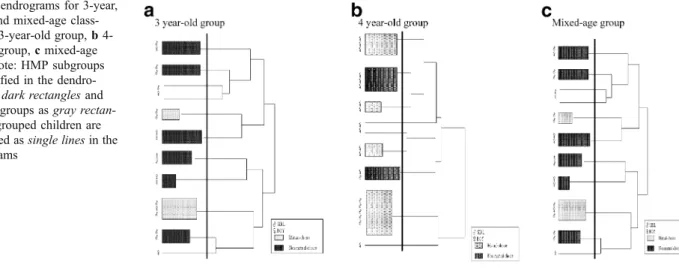
By these criteria, clusters of children in which the average between child correlations from the proximity matrix was significant at p<0.05 were considered “affiliat-ed”. Children whose proximity profile did not correlate with any individual or cluster profile at the p<0.05 level were classified as “ungrouped.” Figure 1 displays repre-sentative cluster dendrograms for three-year, four-year, and mixed-age groups respectively. The vertical line crossing each dendrograms indicates the point at which the within-cluster similarity correlation has a value with p<0.05. Aggregating across the 30 classrooms, a total of 204 multi-child subgroups (between five and eight unique subgroups in each class) were identified and 82 children (zero to six
cases in each classroom, 40 girls) were ungrouped using our criterion. Approximately 58% of identified multi-child subgroups were of the same sex (i.e., 119 of 204). Subgroup size ranged from 1 (ungrouped cases) to 5 across classrooms. The majority (n=131/204, ~64%) of the multi-child subgroups were dyads and these dyads accounted for approximately 52% of grouped children. The remaining grouped children (~48%, 242 cases) were in subgroups of more than two children. An ANOVA on subgroup size using age (younger vs. older; mixed-age groups were excluded from this analysis because we had not observed any mixed-age groups before the Christmas break), sex composition of subgroup, and time of year (before vs. after the Christmas break) as independent factors did not yield any significant main or interaction effects.
Results
Factors affecting group structure
Subgroup distinctions: demographic status Using the cri-terion described above to distinguish the multi-child subgroups, 125 subgroups were classified as HMP (61%) and 79 were classified as LMP (39%). High mutual
proximity subgroups were observed in every classroom and LMP subgroups and ungrouped cases were found in 27 of 30 classrooms. Cross-tabulation analyses indicated that propor-tions of subgroup types did not vary as a function of age-level (i.e., younger, older, mixed),χ2(n=286, 4 df)=4.62, ns (all grouped and ungrouped children;χ2(n=204, 2 df)=1.54, ns, when ungrouped children are excluded), or subgroup gender composition (male, female, mixed),χ2(n=204, 2 df)=1.12, ns (test compared subgroups with n>1), or time of year, χ2 (n=204, 1 df)=0.01, ns. To further explore possible effects on the size of affiliative subgroups, an ANOVA was calculated using group size as the dependent variable, with subgroup type (HMP vs. LMP), age composition for subgroup (older vs. younger), and subgroup gender compo-sition as independent. Final N for the ANOVA is 189 subgroups and includes data for 472 children. The three-way breakdown of the group size data is presented in Table 1. The only significant main effect was for subgroup type, F(1, 177)=11.74, p<0.001, partial eta=0.25. Subgroup sizes tended to be larger for HMP than for LMP subgroups. No interactions were significant.
Subgroup distinctions: peer-preference and social central-ity indicators Due to absences from class during observa-tion periods and/or sociometric interviews or failure to
Fig. 1 Dendrograms for 3-year, 4-year, and mixed-age class-rooms a 3-year-old group, b 4-year-old group, c mixed-age group. Note: HMP subgroups are identified in the dendro-grams as dark rectangles and LMP subgroups as gray rectan-gles. Ungrouped children are represented as single lines in the dendrograms
Table 1 Means and standard deviations for group size by subgroup type, age, and subgroup gender composition Subgroup typea Age Gender composition
Male/male Female/female Mixed
HMP Younger 2.53 (0.70), n=19 2.64 (0.81), n=11 2.48 (0.60), n=21 HMP Older 2.56 (0.71), n=18 2.73 (0.99), n=22 2.71 (0.66), n=28 LMP Younger 2.13 (0.35), n=8 2.11 (0.33), n=9 2.21 (0.42), n=19 LMP Older 2.60 (0.84), n=10 2.21 (0.58), n=14 2.20 (0.42), n=10 Standard deviations presented in parentheses.
a
complete the sociometric tasks, approximately 30% of children in the sample were missing data for one or more of the preference or centrality variables. Analyses of missing data patterns (MISSING module in SYSTAT v. 11.0) suggested that the missing data were missing at random, justifying the imputation of missing values using the EM algorithm. Subsequent analyses were computed using the full data matrix with imputed values substituted for missing data. Subgroup scores were the average values of standardized indicators for subgroup members. Peer preferences were defined as the totals of reciprocated and non-reciprocated friendships from the Vaughn et al. (2000) dataset. Finally, nominations sociometric data were used to derive status category classifications (following the proce-dures described by Asher and Dodge1986) for “popular,” “neglected,” and “rejected” children (all others were classed as “average” category for this report). Subgroups were “pure” if all members of the subgroup had the same sociometric status (68 multi-child subgroups + 82 un-grouped cases), mixed-P if at least one child in the subgroup was classified as “popular” (60 subgroups) and mixed not-P if no child in the subgroup was classified as “popular” (76 subgroups). For the first set of analyses, the subgroup types were compared for the classroom prefer-ence and centrality variables, for numbers of reciprocated and non-reciprocated friends using ANOVA, and sociomet-ric status assignments were tabulated against subgroup type. In the second set of analyses, subgroup type, gender composition of the subgroup (i.e., female, male, mixed) and age (older, younger, mixed) were independent variables. These analyses are necessarily limited to multi-child groups because there can be no“mixed” single-child groups. The nine mixed-age subgroups were also excluded because only one or two groups of this type were included in each cell of the analysis.
Breakdowns for significant tests in the ANOVAs are presented in Tables 2 and 3. A significant main effect of subgroup type was obtained in the initial analysis of the sociometric composite score, F(2, 283)=4.06, p <0.05, partial eta=0.17. A post-hoc test (Tukey HSD) indicated that children in HMP and LMP subgroups differed from each other, but that ungrouped children were not signifi-cantly different from either of the other types. The visual regard scores did not yield a significant main or interaction effect in the ANOVA. Tests for the peer-preference scores yielded a significant effect for subgroup type, F(2, 277)= 3.54, p<0.05, partial eta=0.16. A post-hoc test (Tukey HSD) indicated that HMP subgroups had more reciprocated friendships than did ungrouped children, with LMP subgroups intermediate between them (and not significantly different from either of the other subgroup types). The ANOVA for non-reciprocated friendship choices did not yield any significant effects. The cross-tabulation of
subgroup type by sociometric status of subgroup is presented in Table 4. It is interesting to note that HMP and ungrouped children were found in all four of the“pure” status types and that rather few of either high or lower mutual proximity subgroups were purely made up of popular, neglected, or rejected children. The chi-square for Table4 was significant, χ2(10, n=286)=136.14, p<0.001, however, this is due to the fact that ungrouped children could not appear in either of the mixed sociometric classifications. When ungrouped children were dropped from the analysis, the chi-square test was no longer significant.
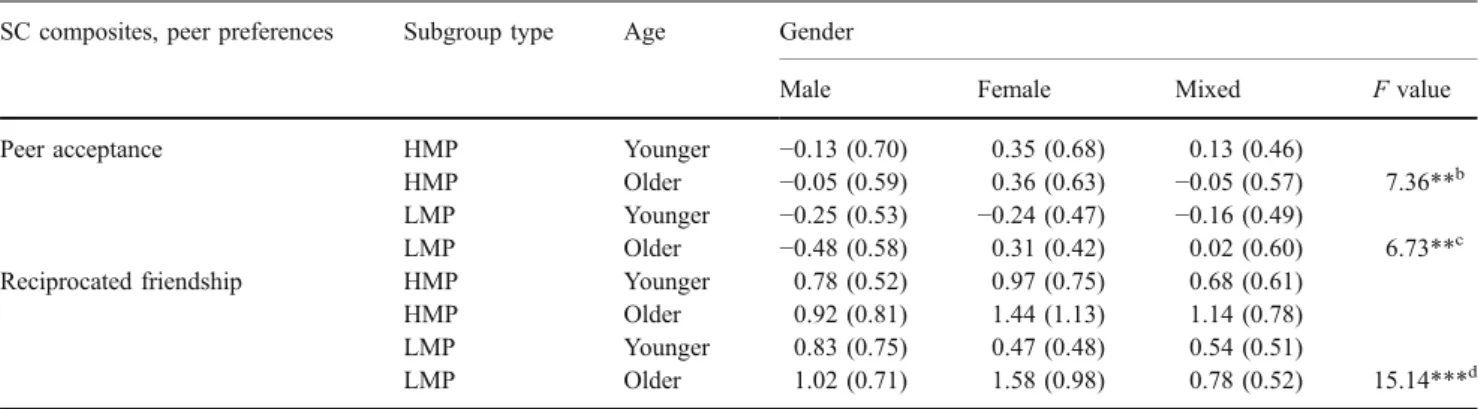
In the next set of analyses (excluding ungrouped and mixed-age subgroups), the sociometric preference score yielded significant main effects for both subgroup type and gender composition of subgroup, F(1, 183) = 7.36, p < 0.01, partial eta = 0.20, and F(2, 183) = 6.73, p < 0.005, partial eta = 0.26, respectively. A post-hoc decomposition of the gender effect (Tukey, HSD) showed that male/male dyads had significantly lower sociometric composite scores than did same-sex female, with mixed-sex dyads intermediate and not different from either male–male or female–female dyads. No other effects were significant. The ANOVA using visual regard as the dependent variable was not significant. No significant subgroup type effects were found in ANOVAs for reciprocated or non-recipro-cated friendships, however, age was related to the reciprocated friendship score, F(1, 180) = 15.14, p < 0.001, partial eta = 0.28. Older children had higher reciprocated friendship scores. No other main or interaction effects were significant.
The last tests at this level of description involve comparisons for different gendered groups (i.e., all female, all male, mixed gender). One-way ANOVAs tested for differences on the sociometric preference and social
Table 2 Significant effects in analyses of social centrality composites and peer-preference variables for subgroup type and in three-factor model (subgroup, age, gender composition)
Subgroup type HMP LMP Ungrouped F value SC compositesa, peer preferences Peer acceptance 0.10 (0.56) −0.15 (0.50) −0.08 (0.80) 4.06* Reciprocated friendships 1.03 (0.84) 0.88 (0.76) 0.71 (0.89) 3.54*
aSocial centrality composite variables are standardized, values in
parentheses are SDs.
b
Main effect for subgroup type
c
Main effect for gender composition
d
Main effect for age
centrality (i.e., visual regard received) variables. No significant differences were observed for these variables. Total scores for reciprocated and non-reciprocated friend-ships also were not significant. However, when the total reciprocated and non-reciprocated choice scores were further decomposed into same- and other-gender choices, two significant effects were uncovered. Mixed-sex sub-groups had fewer same-sex reciprocated friendships than did same-sex subgroups, F(2, 198)=4.68, p<0.05. For non-reciprocated friendships, female–female dyads had lowest other-gender choices, F(2, 198)=6.49, p<0.01. A post-hoc test indicated that female-only subgroups had lower other-gender friendships than did either mixed-other-gender or male-only groups.
Subgroup preferences
Our analyses to this point demonstrate that the subgroups found in these classrooms can be identified from proximity matrices and distinguished in terms of variables derived from sociometric interviews. In the next set of analyses, we attempt to determine the degree to which subgroups have meaning for the children we have grouped together on the basis of statistical criteria. Two kinds of data are used in these analyses. First, we examine visual attention directed
to classmates. We expected that children would look at subgroup members preferentially (i.e., at rates exceeding chance) and, perhaps, would tend to look at non-members at lower-than-chance rates. Second, we expected that subgroup members would be chosen in sociometric inter-views at higher than chance levels in comparison with other classmates. Only members of HMP and LMP subgroups are included in these analyses, because ungrouped children cannot show any “in-group” preferences or “out-group” biases.
Visual regard preferences For each member of a multi-child subgroup, the frequency of looks given to group members (in-group) and to other classmates (out-group) was tabulated and compared to expected frequencies (i.e., the average value for the class for a given child). Table 5
presents the observed number of tests in which significant in-group (or out-group) preferences were observed (vs. the number of tests for which in-group or out-group prefer-ences would have been expected by chance). We also tabulated the numbers of tests for which in- and out-group looks that were significantly lower than would be expected by chance (i.e., in which visual regard directed to a peer was lower than would be expected by chance; negative bias). Differences between in- vs. out-group positive preferences and in- vs. out-group negative biases were
Table 4 Cross-tabulation of subgroup type and subgroup sociometric status classifications
Subgroup Pop Avg Neglect Reject Mixed-P Mixed not-P Total
HMP 2 38 1 2 41 40 124
LMP 0 22 1 2 19 36 80
Ungrouped 10 44 17 11 0 0 82
Total 12 104 19 15 60 76 286
Table 3 Significant effects in analyses of social centrality composites and peer-preference variables for subgroup type and in three-factor model (subgroup, age, gender composition)
SC composites, peer preferences Subgroup type Age Gender
Male Female Mixed F value Peer acceptance HMP Younger −0.13 (0.70) 0.35 (0.68) 0.13 (0.46)
HMP Older −0.05 (0.59) 0.36 (0.63) −0.05 (0.57) 7.36**b LMP Younger −0.25 (0.53) −0.24 (0.47) −0.16 (0.49)
LMP Older −0.48 (0.58) 0.31 (0.42) 0.02 (0.60) 6.73**c Reciprocated friendship HMP Younger 0.78 (0.52) 0.97 (0.75) 0.68 (0.61)
HMP Older 0.92 (0.81) 1.44 (1.13) 1.14 (0.78) LMP Younger 0.83 (0.75) 0.47 (0.48) 0.54 (0.51)
LMP Older 1.02 (0.71) 1.58 (0.98) 0.78 (0.52) 15.14***d
a
Social centrality composite variables are standardized, values in parentheses are SDs.
b
Main effect for subgroup type
c
Main effect for gender composition
d
Main effect for age
tested using a single-sample chi-square test, where degrees of freedom are equal to the number of cells estimated (k) minus one (Siegel1956). For all tests reported here, k = 2 (in vs. out) and k−1=1. The analyses revealed significant effects for both positive preferences and negative biases. Although children in HMP and LMP subgroup types showed significant in-group preference (i.e., preferences for subgroup co-members greater than expected, χ2
s (1 df)=777.79 and 18.76, ps<0.001, respectively, in-group negative bias lower than expectedχ2s (1 df)=91.71 and 10.66, ps<0.001 and >0.005, respectively), additional analyses directly comparing the subgroups showed that these differences were greater for the HMP than LMP subgroups, χ2
s=100.94 and 15.14, ps<0.001, for positive and negative bias data, respectively.
Friendship choices A child was considered to be a friend on the sociometric tasks if he or she was among the upper quintile of choices on either the nominations or the paired comparisons sociometric tasks and was also given a rating-scale score of “3” (see Vaughn et al.2000, for more complete description). Using this criterion, the numbers of friends identified by individual children ranged from 0–8 with a mean of 3.57 (SD=1.95). As with the visual regard scores, we tabulated the numbers of friendship choices who were from a given child’s subgroup vs. friendship choices identified outside the subgroup for each child and tested whether the proportion of in-group choices exceeded the proportion expected by chance. The statistical tests proved significant in the HMP group but not in the LMP group,χ2s (1 df)=22.18 and 2.92, ps<0.001 and >0.05, respectively. These results suggest that only children in HMP subgroups preferred peers from within their subgroup more frequently than would be expected from a chance model. A subsequent test comparing the in- and out-group choices for the two subgroups directly supported this conclusion,χ2(1 df)=7.15, p<0.01.
Status differences in social preferences
We also used the aggregated classroom sociometric accep-tance (positive choice) data to classify subgroups with regard to their relative acceptance status in the classroom. The standardized (within classroom) total acceptance scores from the paired comparisons sociometric task for each subgroup were aggregated and averaged. These scores were converted to percentile ranks (PR) for each class and subgroups were categorized as having low (PR<30), medium (30<PR<70), or high (PR>70) acceptance status in their groups. These categories were used in tests of possible status effects on in-group preferences vs. out-in-group biases.
Observed and expected frequencies for the HMP and LMP subgroups, stratified by acceptance level are presented in
Table5. Five of six tests for positive bias in the visual regard data were significant. Only low acceptance status, LMP subgroups failed to show preference for subgroup co-members. Tests for negative bias (i.e., looking at an individual significantly less often than expected) were also significant at all levels of acceptance status for the HMP subgroup. Negative bias was seen also for the high acceptance status, LMP subgroups, but not at medium or lower levels of acceptance. A comparison of the two subgroup types at each level of acceptance status indicated that in-group preferences were stronger in HMP subgroups at all levels of acceptance status, χ2s (1 df)=25.56, 40.62, and 34.64, ps<0.001, for high, medium, and low acceptance status group comparisons, respectively. Because cell sizes for in-group negative biases are very small (less than five for over 80% of observed cells), we did not compute tests for these data.
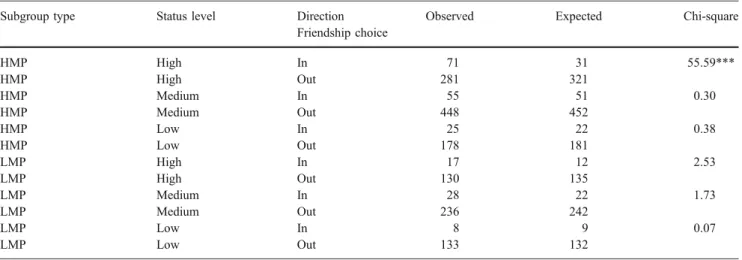
Friendship data (observed and expected), stratified by sociometric acceptance level are presented in Table 6. In-group sociometric preferences were significant only for high status, HMP subgroups, χ2 (1 df)=55.59, p<0.001. The within-subgroup tests are consistent with this conclu-sion. The test for status effects was significant only for HMP subgroups,χ2s (2 df)=15.22 and 3.47, ps<0.001 and ns, for HMP and LMP groups, respectively. Comparisons of the subgroups by acceptance status category revealed significant differences only for the high and low status categories, χ2s (1 df)=5.29, 4.23, ps<0.05. Both tests favored the HMP subgroups.
Discussion
At the outset, we identified two conceptual and methodo-logical traditions within developmental science that have described and interpreted the social behavior and social structures of young children. The dominant approach for developmental psychologists characterized the central prob-lem as identifying the behaviors or profiles of behavior of individual children and relating these to salient outcomes at the level of the individual (e.g., being popular or exhibiting externalizing problem behaviors). An alternative approach, inspired by ethological and sociological insights, character-ized the central problem as identifying the structural features of groups and determining the affordances for and constraints on the social behavior of group members that are imposed by these features. Both traditions have proven generative but studies bridging the two are rare (see Gest et al. 2001, for one of the rare examples). To more firmly anchor this bridge, we have attempted to replicate aspects of findings reported previously by Santos, Strayer, and associates in a sample of low-income, African– American children; a group not often represented in behavioral research with young children from any tradition.
This report was organized around four issues: (1) the utility of procedures described by Santos and Strayer for characterizing the social structures and distinguishing among subgroup types for preschool children in Head Start
programs; (2) determining whether subgroups identified using statistical considerations could be distinguished using indicators of social centrality and peer preference; (3) to examine the intersection of peer acceptance from
socio-Table 6 Observed vs. expected frequencies for friendship choice stratified by sociometric acceptance status
Subgroup type Status level Direction Observed Expected Chi-square Friendship choice HMP High In 71 31 55.59*** HMP High Out 281 321 HMP Medium In 55 51 0.30 HMP Medium Out 448 452 HMP Low In 25 22 0.38 HMP Low Out 178 181 LMP High In 17 12 2.53 LMP High Out 130 135 LMP Medium In 28 22 1.73 LMP Medium Out 236 242 LMP Low In 8 9 0.07 LMP Low Out 133 132 ***p<0.001
Table 5 Observed vs. expected frequencies for positive preferences and negative biases for visual regard stratified by sociometric status Subgroup Type Status Level Direction Observed Expected Chi-square Positive preference HMP High In 120 26 373.86 HMP High Out 172 266 HMP Medium In 145 41 292.80 HMP Medium Out 269 373 HMP Low In 76 21 161.53 HMP Low Out 118 173 Negative preference HMP High In 2 28 26.58 HMP High Out 313 287 HMP Medium In 2 42 42.28 HMP Medium Out 422 382 HMP Low In 3 24 20.65 HMP Low Out 215 194 Positive preference LMP High In 20 10 10.85 LMP High Out 107 117 LMP Medium In 27 18 4.88 LMP Medium Out 202 211 LMP Low In 10 7 1.37 LMP Low Out 108 111 Negative preferences LMP High In 1 10 8.78 LMP High Out 128 119 LMP Medium In 10 15 3.06 LMP Medium Out 177 162 LMP Low In 4 6 1.06 LMP Low Out 97 91
All chi-square values for HMP subgroups p<0.001, For LMP subgroups, only high status groups showed significant in vs. out-group bias for both positive and negative preferences.
metric data and group structure by stratifying the subgroups according to the sociometric acceptance level and testing relations between sociometric level and the degree of in- vs. out-of-subgroup bias; and (4) to conceptually relate the structural taxonomy obtained from observational methods to the taxonomy obtained for older children using SCM protocols.
Regarding the first issue, we found that all three subgroup types were present in most classrooms; namely, HMP subgroups were identified in all 30 classrooms and the other two types were seen in 90% of classrooms. No classroom consisted solely of one subgroup type. Girls and boys were approximately equally represented in each of the subgroup categories and the bulk of subgroups were gender segregated (~58% of all groups were single sex). Multi-member subgroups ranged in size from two to five across the 30 classrooms. Furthermore, nearly 48% of grouped children (232/500) were in multi-child groups with more than two co-members. This range of subgroup sizes is consistent with other reports on preschool social structures (e.g., Strayer and Santos 1996). Subgroup types were distinguished by their size (HMP subgroups larger). Proportionally, more of the LMP subgroups were dyads (~82% vs. 52% for HMP subgroups) and no LMP subgroups of size five were observed. We did not, however, find age-related increases in subgroup size. This may be due to the restricted range of ages included in this sample. These results suggest the utility of the clustering approach to classroom social structures used by Santos and Strayer (1997).
Our analyses of external variables (i.e., peer acceptance, social centrality, and preferences for specific peers) suggest that the distinction between subgroup types is meaningful. Subgroups were distinguished on peer acceptance and on the number of reciprocated peer preferences, with HMP subgroups having the highest scores. We note that post-hoc tests revealed that the HMP and LMP subgroups differed significantly for sociometric acceptance; the ungrouped cases were not different from either of the subgroup types. However, for the reciprocated friendships, HMP subgroups and ungrouped cases differed, with LMP subgroups intermediate. Finally, subgroup type was not associated significantly with subgroup sociometric status (as defined using the criteria by Asher & Dodge1986). That is to say, a particular subgroup type (e.g., HMP) was no more likely than the other subgroup types to be assigned to“pure” (i.e., popular, rejected, neglected, or average) or mixed socio-metric status categories than were children in other subgroup types. Although sociometric measures have proven useful in variable-centered approaches to peer social interactions and relationships (see Rubin et al.1998, for a review), the derived status categories (e.g., popular, rejected) do not map onto the interactive choices of
classmates. It is not necessarily the case that the popular children in a classroom hang out or play with each other in class or on the playground or choose each other in sociometric interviews.
We also were interested in possible effects of sex composition of subgroups. Our analyses did not reveal any significant interactions between sex and subgroup type, even though some main effects of sex were obtained for other variables. Consistent with prior analyses of data from this sample (Vaughn et al. 2000), we did find a relatively large proportion of mixed-gender subgroups and a few interpretable effects (e.g., finding fewer same-sex recipro-cated preferences in mixed-sex groups) were uncovered. Nevertheless, sex-based influences on the pattern of relations for subgroup types were not observed.
The next question we considered was whether the peer preferences of the preschool children in our sample were coordinated with subgroup membership. We hypothesized that visual attention and sociometric preferences would favor individuals with whom a child maintained proximity and tested whether the degree of preference varied with subgroup type. For visual regard given to peers, we examined both positive preferences and negative biases. Results of our analyses indicate that children tend to look at subgroup members more frequently (and at out-group peers less frequently) than would be expected by chance (where “chance” is defined as the random distribution of visual regard to peers). In-group preference vs. out-of-subgroup bias was more apparent in HMP than in LMP subgroups. These results were reinforced by analyses of the sociomet-ric preference data. Evidence for in-group preference was only found for HMP subgroups. These results echo those reported by Gest et al. (2003) in their study of correspond-ences between interaction patterns and verbal reports of children’s social networks.
Finding somewhat different patterns of in-group attrac-tion across subgroups suggests that the subgroup types are functionally distinct in these preschool groups. HMP subgroups appear to be made up of friends, whereas LMP subgroups are not necessarily composed of children who enjoy a friendship relationship. These differences between subgroup types suggest different degrees of “cohesion” across subgroup types and also suggest that LMP sub-groups would be less stable over time or in the face of a challenge, such as an attempt to enter the group by a non-group member. Alternatively, it may be that LMP sub-groups are precursors to or even the early stages of HMP groups. Longitudinal data will be needed to test these speculations.
The third set of questions concerns the intersection of sociometric and structural features of children’s groups and represents a replication of findings by Santos et al. (2000). Sociometric stratification had no effect on positive or
negative visual regard preferences in HMP subgroups; in-group preference and out-in-group bias was observed at every level of status. For LMP subgroups, in-group preference was not observed for those subgroups with the lowest level of peer acceptance. Furthermore, only the LMP subgroups with the highest level of peer acceptance showed out-group negative bias. These differences may be interpreted in terms of friendship differences between subgroup types. If friendship is the basis for peer preferences in HMP subgroups, then the acceptance status of the members should have little effect on social preferences. However, to the extent that friendship per se is not the basis for LMP subgroups, then visual and sociometric preferences might not be directed preferentially to subgroup members. The tests showing that in-group positive preferences are greater for HMP than for LMP subgroups (at least at high and low levels of peer acceptance) are consistent with our interpre-tation about the basis of the different subgroup types. Again, these speculations should be tested in new samples. This last research issue concerns correspondences between our approach to establishing and interpreting the meanings of subgroup membership and the SCM approach. A review of the significant findings reported suggests both similarities and differences across the two methods. First, HMP subgroups tend to be higher with respect to peer acceptance and may be analogous to the socially central types that are identified using SCM. Second, LMP groups have lower peer acceptance scores (i.e., are identified as liked by fewer children in the classroom) and may be similar to the socially peripheral types identified by SCM methods. We note that the analogy between these types is somewhat stretched because usually,“central” and “periph-eral” descriptors are given to individuals rather than to subgroups using SCM. Even so, we believe that the similarities are more than superficial and suggest that further investigations along this line should be profitable. Finally, we do not believe that the ungrouped cases in our analyses correspond to the“isolated” individuals (Gest et al. 2001) identified using SCM. In our data, ungrouped children were found in all sociometric classifications (see Table 4) and were no more likely to be considered “rejected” or “neglected” than “popular.” Indeed, the majority (44/82) were“average” in our classification scheme. In tests on the group-level preference and centrality measures, they were not distinguished from the HMP cases, although the HMP children had more reciprocated peer preferences than did the ungrouped children.
We noted above that the child psychology and the social ethological/sociological traditions within develop-mental science have rarely attempted to integrate methods and ideas across traditions. We believe that such integration is possible and that methods from the two
traditions are mutually informative. The results from our last analyses are consistent with this belief. Without the sociometric acceptance data, we could not have reached the conclusion that friendship appears to be the core feature underlying HMP subgroups (and not the core feature of LMP subgroups) and without the subgroup data we would not have a mechanism to assess the impacts of sociometric acceptance on the routine behav-ioral transactions seen between peers in a given class-room. Furthermore, without sociometric data, we could not have discovered the group-level (i.e., acceptance and centrality) distinctions between the subgroup types. We can interpret the subgroup distinction regarding socio-metric acceptance in terms of within-group positive bias for the HMP subgroups. That is, children in HMP tend to have higher scores because their co-member peers choose them more consistently than children in LMP subgroups choose their own subgroup co-members.
There are, of course, some limitations in these data. Some arise from our use of data collected for a different original purpose. For example, the original study was a developmental study of social competence and its correlates in a sample of children attending Head Start (Bost et al.
1998). Had we envisioned these analyses, we would have recruited a larger sample of mixed-age classrooms and made certain that they were observed at all time periods. Likewise, we would have collected additional data, such as teacher or parent reports of child behavior and social relationships, to help specify more completely the bases of both HMP and LMP subgroups. At this point, we are confident in suggesting how the subgroups differ but cannot explain why they differ. We would also like to have more information about the ungrouped cases to help understand why they are not included in existing classroom subgroups. Finally, we would also prefer to have class-rooms observed longitudinally over the school year to get a sense of how the different subgroup types emerge, the degree to which the types we have identified are stable or fluid through the life-span of the larger classroom, and how these subgroups influence both individual and group-level aspects of social functioning across the period of time that the class exists as a stable social unit.
Acknowledgments Data collection, analyses, and preparation of this report have been supported in part by a Head Start/University Partnership grant (ACYF-90-CD-0956), by NSF grants SBR 95-14563, BCS 99-83391, BCS 01-26163, and by FCT grant PTDC/PSI/ 66172/2006. We are grateful also to the Directors, Teachers, and children attending the Head Start programs from which participants were recruited for their patience and support. Correspondence should be directed to António J. Santos, Instituto Superior de Psicologia Aplicada, Rua Jardim do Tabaco 34, 1149-041 Lisboa, Portugal.
References
Asher SR, Dodge KA (1986) Identifying children who are rejected by their peers. Dev Psychol 22:444–449 doi: 10.1037/0012-1649.22.4.444
Bost KK, Vaughn BE, Washington WN, Cielinski KL, Bradbard MR (1998) Social competence, social support, and attachment: demarcation of construct domains, measurement, and paths of influence for preschool children attending head start. Child Dev 69:192–218 doi:10.2307/1132080
Bronson WC (1981) Toddlers’ behaviors with agemates: issues of interaction, cognition, and affect. Ablex, Westport, CT
Bukowski WM, Newcomb AF, Hartup WW (1996) The company they keep: friendship in childhood and adolescence. Cambridge University Press, New York
Cairns RB, Cairns BD (1995) Lifelines and risks: pathways of youth in our time. Cambridge University Press, New York
Cairns RB, Perrin JE, Cairns BD (1985) Social structure and social cognition in early adolescence: Affiliative patterns. J Early Adolesc 5:339–355 doi:10.1177/0272431685053007
Cairns RB, Gariépy J-L, Kinderman T (1990) Identifying social clusters in natural settings. Unpublished manuscript, Center for Develop-mental Sciences, University of North Carolina at Chapel Hill Cairns RB, Leung MC, Buchanan L, Cairns BD (1995) Friendships
and social networks in childhood and adolescence: fluidity, reliability, and interrelations. Child Dev 66:1330–1345
doi:10.2307/1131650
Farmer T, Rodkin PC (1996) Antisocial and prosocial correlates of classroom social positions: the social network centrality perspec-tive. Soc Dev 5:174–188 doi:10.1111/j.1467-9507.1996.tb00079.x
Gest SD, Graham-Bermann SA, Hartup WW (2001) Peer experience: common and unique features of number of friendships, social network centrality, and sociometric status. Soc Dev 10:23–40
doi:10.1111/1467-9507.00146
Gest SD, Farmer TW, Cairns BD, Xie H (2003) Identifying children’s peer social networks in school classrooms: links between peer reports and observed interactions. Social Development, 12:513 Harris JR (1995) Where is the child’s environment? A group
socialization theory of development. Psychol Rev 102:458–489
doi:10.1037/0033-295X.102.3.458
Hartup WW (2005) Peer interaction: what causes what? J Abnorm Child Psychol 33:387–394 doi:10.1007/s10802-005-3578-0
Hawley P, Little T (1999) On winning some and losing some: a social relations approach to social dominance in toddlers. Merrill-Palmer Q 43:185–214
Hay DF, Nash A, Pedersen J (1983) Interaction between six-month-old peers. Child Dev 54:557–562 doi:10.2307/1130042
Howes C, Phillipsen L (1992) Gender and friendship: relationships within peer groups of young children. Soc Dev 1:230–242
doi:10.1111/j.1467-9507.1992.tb00126.x
Howes C, Phillipsen L (1998) Continuity in children’s relationships with peers. Soc Dev 7:340–349 doi:10.1111/1467-9507.00071
Legendre L, Legendre P (1983) Numerical ecology. Elsevier, Amsterdam
McCandless BR, Marshall HR (1957) A picture sociometric technique for preschool children and its relation to teacher judgments of friendship. Child Dev 28:139–147 doi:10.2307/1125876
Rubin KH, Bukowski W, Parker JG (1998) Peer interactions, relation-ships, and groups. In: Damon W (ed) Handbook of child psy-chology, Vol 3. (N. Eisenberg, Volume Ed). Social, emotional, and personality development, 5th edn. Wiley, New York, pp 619–700 Santos AJ, Strayer FF (1997) A socio-structural analysis of preschool
children’s affiliative behavior. Advances in Ethology 32 Santos AJ, Vaughn BE, Bonnet J (2000) L’influence du réseau
affiliatif sur la répartition de l’attention sociale chez l’enfant en groupe préscolaire. Rev Sci Edu 26:17–34
Sherif M, Harvey OJ, White JB, Hood WR, Sherif CW (1961) Intergroup conflict and cooperation: the robbers cave experiment. Institute of Group Relations, Norman, OK
Siegel S (1956) Non-parametric statistics for the behavioral sciences. McGraw-Hill, New York
Sneath PHA, Sokal RR (1962) Numerical taxonomy. Nature 193:855– 860 doi:10.1038/193855a0
Strayer FF (1980) Current problems in the study of dominance. In: Omark DR, Strayer FF, Freedman D (eds) Dominance relations: an ethological view of human conflict and social interaction. Garland STPM, New York, pp 443–452
Strayer FF, Strayer J (1976) An ethological analysis of social agonism and dominance relations among preschool children. Child Dev 47:980–989 doi:10.2307/1128434
Strayer FF, Santos AJ (1996) Affiliative structures in preschool play groups. Soc Dev 5:117–130 doi:10.1111/j.1467-9507.1996.tb00075.x
Vaughn BE, Waters E (1980) Social organization among preschooler peers: dominance, attention and sociometric correlates. In: Omark DR, Strayer FF, Freedman D (eds) Dominance relations: an ethological view of human conflict and social interaction. Garland STPM, New York, pp 359–380
Vaughn BE, Waters E (1981) Attention structure, sociometric status, and dominance: Interrelations, behavioral correlates, and relation-ships to social competence. Dev Psychol 17:275–288
doi:10.1037/0012-1649.17.3.275
Vaughn BE, Martino D (1988) Age related Q-sort correlates of visual regard in groups of preschool children. Dev Psychol 24:589–594 Vaughn B, Santos AJ (2007) Why they don’t all get along: an evolutionary/ecological account of aggressive behavior and trait aggression in human children and adolescents. In: Hawley PH, (ed) Aggression and adaptation: the bright side to bad behavior. Matowa, NJ: Erlbaum, pp 31–63
Vaughn BE, Azria MR, Krzysik L, Caya LR, Bost KK, Newell W et al (2000) Friendship and social competence in a sample of preschool children attending head start. Dev Psychol 36:326– 338 doi:10.1037/0012-1649.36.3.326
Vaughn BE, Colvin TN, Azria MR, Caya L, Krzysik L (2001) Dyadic analyses of friendship in a sample of preschool age children attending head start: correspondence between measures and implications for social competence. Child Dev 72:862–878
doi:10.1111/1467-8624.00320
Waters E, Garber J, Gornal M, Vaughn BE (1983) Q-sort correlates of soil competence. Dev Psychol 19:550–560