Distribution
patterns and
genetic structure
of golden jackal in
Europe and Asia
Renato Couto Reis e Silva
Mestrado em Biodiversidade, Genética e Evolução
Departamento de Biologia2015
Orientador
Francisco Álvares, Post-Doc Researcher, CIBIO/InBIO
Coorientador
Raquel Godinho, Assistant Researcher, CIBIO/InBIO
Invited Assistant Professor, FCUP
Todas as correções determinadas pelo júri, e só essas, foram efetuadas. O Presidente do Júri,
Acknowledgments
First of all, I would like to express my warm thank to my supervisors Francisco Alvares and Raquel Godinho for the opportunity to work in their team and to grow as biologist scientist.
To Marcia Barbosa for the big help with ecological modelling. To Miha Krofel for providing samples and presence records in Europe. To several researchers for providing samples, in particular, Urmas Saarma and also Mihajla Đan, Elena Tsingarska, Maria Petridou/Callisto NGO, Giorgos Giannatos, Anastasia Miliou, Hosein Yusefi, Leili Khalatbari, Siamak Broomand, Peep Männil, Rauer Georg, Szabó László, Petros Lymberakis, Josip Kusak, Antigoni Kaliontzoupolou, Huseyin Ambarli and Dime Melovski.
My appreciation to Susana Lopes for her help in the lab and analyzing the microsatellites, for giving advises and support.
I also express my sincere gratitude to technicians of CTM and CIBIO, for all their advices in the lab. Special thanks to Patricia, who taught me the basics and always continued to help.
To my colleges of Master course for all the help and funny moments that we shared during this journey.
A huge thanks to my family, for all their support, love and forgiveness for missing important events, and just believing in me and being always for me.
The last but not the less.
To Sandra, for being Sandra and was the person par excellence who could always count on.
Abstract
Organisms with great ability to mobility and dispersion are able to adapt to various habitats and ecosystems, surviving to climate and environmental changes caused mainly by man. The carnivores are a good example of organisms which cover long distances, occupy wide areas and inhabit different habitats, thus prompt to find barriers to gene flow and dispersion, which can cause isolation of populations. Applying molecular genetic tools enables to acquire a wide knowledge on carnivore populations, relevant to develop effective management and conservation strategies. However, these studies are often related to iconic carnivores, with little available information on other species with wide occurrence areas, such as the Golden Jackal.
Golden Jackal Canis aureus is one of the most widespread canid species with a range that covers Central and Eastern Europe to Middle East and Southeast Asia, as can be seen in the information provided by IUCN. In Asia there is a lack of information on the populations of golden jackal, but it is estimated that this species is abundant, especially in Turkey, Iran and India. In Europe there is more information, however the recent expansion and distribution are not known. Recently, several studies claimed that the jackal has expanded from South East Europe to more central areas and to northern Europe, particularly in the Baltic region. There are few genetic studies on golden jackal, mostly at local scale, and no intercontinental or long distance studies is available.
The objective of this study was to make a compilation of presence records from Eurasian golden jackal across their worldwide range and measure the population structure and genetic diversity of this species in Europe and the Middle East. A total of 1842 presence records were compiled to update the global range extension, evaluate distribution trends, and evaluate areas of potencial distribution. Furthermore, 184 samples of golden jackals from Southeastern Europe, the Baltic region, Caucassus and the Middle East, were genotyped for 43 microsatellites to assess population structure and genetic diversity.
Results confirm the prehistoric occurence of jackals on coastal areas of Croatia and Greece since the Holocene, and a strong recent expansion occurring in Europe over the past decades, where jackals have colonized new areas in Central and Northeast Europe. In Asia, the presence of records were generally older and scarce, but well distributed across the continent from Middle East to Southeast Asia. Genetic analysis revealed a division between European and Asian populations, with Asian populations presenting a higher genetic diversity. The genetic results, together with the
presence records and the distribution model confirm that the Asian jackals colonized Europe, apparently in different ocasions, with potential corridors located both at the south and north coast of the Black Sea. The recent expansion of jackals to Baltic region result from dispersal of individuals belonging to both southeast European population and Caucasian populations. Our results also reveal several relict populations, with low genetic diversity, in coastal Croatia, mainland Greece and Samos Island, which raises the need for regional assessments to access their conservation status need to be preserved. This study contributed for a depper knowledge on the population history of Eurasian Golden jackals and provided an update of the global distribution, in relation to the available range information from IUCN.
Future research should be focused in further sampling for genetic analyzes in relict populations of coastal Southeastern Europe and in the expanding populations that assure the connection between Asia and Europe, in order to better understand the Europe's colonization processes by this species. The golden jackal in Europe is often considered an invasive species, being heavily hunted by humans. However, jackals already inhabit Europe since the Holocene and as jackal expansion in Europe occurs without human intervention, future management actions should not consider this species as invasive and should reassess their conservation status.
Keywords: Golden Jackal, Canis aureus, dispersal, distribution trends, Europe, Asia, genetic structure, genetic diversity, potential distribution, range extant
Sumário
Os organismos com grande capacidade de mobilidade e dispersão são capazes de se adaptar a diferentes habitats e ecossistemas, sobrevivendo, assim, às mudanças climáticas e ambientais causadas, principalmente, pelo homem. Os carnívoros são um bom exemplo de organismos que percorrem longas distâncias, ocupam vastas áreas e habitam diferentes habitats, podendo encontrar barreiras ao fluxo gênico e dispersão, causando o isolamento das populações. Aplicando técnicas de genética molecular é possivel adquirir um amplo conhecimento sobre as populações de carnívoros, relevante para o desenvolvimento de estratégias eficazes de gestão e conservação. No entanto, estes estudos estão frequentemente relacionados com carnívoros icónicos, com pouca informação disponível sobre outras espécies com grandes áreas de ocorrência, como a Chacal Dourado.
O Chacal Dourado Canis aureus é uma das espécies de canídeos mais amplamente distribuídas, abrangendo a Europa central e oriental, bem como o Médio Oriente e o Sudeste Asiático, como se pode verificar na grosseira informação disponibilizada pelo IUCN. Recentemente descobriu-se que os chacais que habitam no Norte e Este de África correspondem a outra espécie, mais relacionada com o lobo. Na Ásia existe falta de informação sobre as populações de chacal dourado, mas estima-se que esta espécie seja abundante, principalmente na Turquia, Irão e Índia. Na Europa já existe mais informação não se conhecendo, no entanto, as recentes expansões e a atual extensão da distribuição. Recentemente, vários estudos afirmam que o chacal se tenha expandido do Sudeste Europeu para áreas mais centrais e a norte da Europa, nomeadamente para a região dos países Bálticos. Até ao momento são poucos os estudos genéticos sobre o chacal dourado e os que existem focam-se em estudos locais e nenhum estudo entre continentes ou de longa distância está disponível.
O objetivo deste estudo foi efectuar uma compilação de registos de presença de chacal dourado em toda a sua distribuição e avaliar a estrutura da população e diversidade genética desta espécie na Europa e no Médio Oriente. Um total de 1842 registos de presença foram compilados para atualizar a distribuição global, avaliar as tendências de distribuição e avaliar a potencial distribuição da espécie. Além disso, 184 amostras de chacais dourados do Sudeste da Europa, da região do Báltico, Caucaso e do Médio Oriente, foram genotipadas para 43 microssatélites, com o intuito de avaliar a estrutura genética e diversidade genética da população.
Os resultados mostram a ocorrência de resgistos pré-históricos de chacais em áreas litorais da Croácia e da Grécia, desde o Holoceno, bem como uma forte expansão recente na Europa ao longo das últimas décadas, onde os chacais colonizaram novas áreas na Europa Central e Nordeste. Na Ásia, os registos de presença são geralmente mais antigos e escassos, mas bem distribuídos por todo o continente a partir do Médio Oriente até ao Sudeste Asiático. A análise genética revelou uma divisão entre as populações europeias e asiáticas, com as populações asiáticas apresentando uma maior diversidade genética. Os resultados genéticos, em conjunto com os registos de presença e do modelo de distribuição confirmam que os chacais asiáticos colonizaram a Europa, aparentemente, em diferentes ocasiões, com potenciais corredores localizados tanto a sul e a norte da costa do Mar Negro. Além disso, a expansão recente na região do Báltico resulta da dispersão de indivíduos pertencentes a ambas as populações do Caucaso e do Sudeste da Europa. Os nossos resultados também revelaram várias populações relíquia, com baixa diversidade genética, na costa da Croácia e ilha de Samos, o que aumenta a necessidade de avaliações regionais para acessar o seu estado de conservação. Este estudo contribuiu para um melhor conhecimento sobre a história das populações de chacais dourados e forneceu uma atualização da distribuição global, em relação às informações disponíveis pelo IUCN.
Futuros projectos deverão incidir em mais amostras para análises genéticas das populações relíquia da costa do Sudoeste da Europa e nas populações em expansão que asseguram a ligação entre a Ásia e a Europa, a fim de compreender melhor os processos de colonização da Europa por esta espécie. O chacal dourado na Europa é muitas vezes considerado uma espécie invasora, sendo muitas vezes caçado. No entanto, os chacais já habitam na Europa desde o Holoceno e como a sua expansão na Europa ocorreu sem a intervenção humana, não se deve considerar esta espécie como invasora e serão precisas futuras ações de gestão, bem como reavaliar o seu estado de conservação.
Palavras-chave: Chacal Dourado, Canis aureus, dispersão, padrões de distribuição, Europa, Ásia, estrutura das populações, diversidade genética, alcance de distribuição
Table of contents
Acknowledgments ... 2 Abstract ... 3 Sumário... 5 List of Figures ... 8 List of Tables... 10 1. Introduction... 111.1. Challenges to conserve carnivores ... 11
1.1.1. Relevance of range patterns in large carnivores... 12
1.1.2. Effects of regressions and expansions on genetic parameters ... 13
1.2. The Golden Jackal as a case study ... 16
1.2.1. Distribution patterns of Eurasian golden Jackal ... 17
1.2.2. Genetic characterization of the Eurasian golden Jackal ... 21
1.3. Objectives ... 24
2. Materials and Methods... 26
2.1. Distribution patterns... 26
2.1.1. Data collection ... 26
2.1.2. Modelling potential distribution ... 27
2.2. Genetic analyses... 29
2.2.1. Samples ... 29
2.2.2. DNA extraction ... 29
2.2.3. Microsatellite amplification and genotyping ... 30
2.2.4. Statistical analyses... 31
3. Results ... 33
3.1. Available knowledge on golden jackal distribution... 33
3.2. Distribution patterns and trends ... 34
3.2.1. Potential distribution model ... 38
3.3. Genetic structure of Golden Jackal populations ... 39
3.4. Genetic diversity ... 42
4. Discussion... 44
4.1. Transcontinental patterns: Range extant and connectivity between Europe and Asia... 44
4.2. European patterns: from past to future ... 46
4.3. Management implications: is golden jackal a recent invader or a relict species? ... 48
5. Conclusions and future research ... 50
6. References ... 52
List of Figures
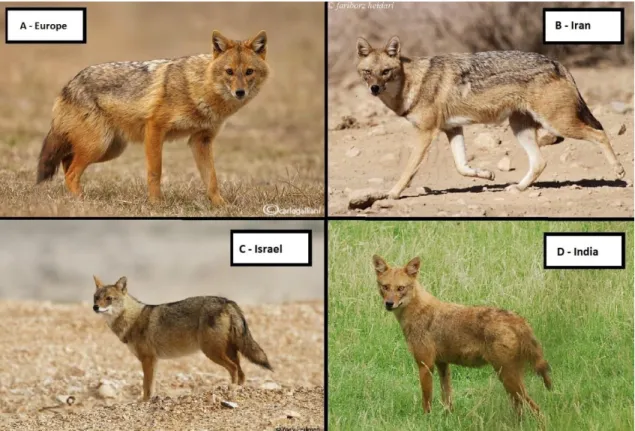
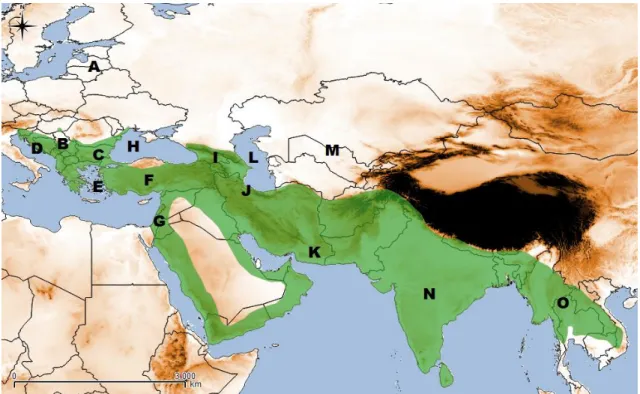
Figure 1 – Phenotipic variation on the Eurasian Golden Jackal Canis aureus, in Europe (A; © Carlo Galliani), Iran (B; © Fariborz Heidari), Israel (C; © Yoav Perlman) and India (D; © Victor Sazatornili).. ... 7 Figure 2 - Geographic range of the Eurasian Golden Jackal according to IUCN Red List of Threatened Species (http://www.iucnredlist.org/) and main regions mentioned along the text: A – Baltic region; B – Panonian Basin; C – Danube river; D – Dalmatia (Coastal Croatia); E – Samos Island (Greece); F – Turkey; G – Levant; H – Black Sea; I – Caucasus; J – Elbrus Mountain (North Iran); K – Baluchistan (South of Iran) ; L – Caspian Sea; M – South former-URSS; N – Indian subcontinent; O – Southeast Asia . 9 Figure 3 - Main studies with distribution assessments of Golden Jackal in Europe: A – Krystufek et al. (1997); B – Mitchel-Jones et al. (1999); C – Arnold et al. (2012); D - Trouwborst et al. (2015) ... 21 Figure 4 – Phylogenetic tree based on analysis of twenty nuclear gene segments (adapted from Koepfli et al. 2015) ... 22 Figure 5 - Patterns of genetic structure of Golden Jackal in Europe based in the analysis of 14 microsatellites and according to results from. Structure and Geneland (shaded areas) (adapted from Fabbri et al, 2013).. ... 24 Figure 6 - Location of all samples available for this study and the geographic distribution of Eurasian golden jackal according to the IUCN (http://www.iucnredlist.org/). Purple dots – samples with success in DNA extraction and amplification of microsatellites. Red dots – samples who have failed in DNA extraction or amplification of microsatellites. ... 30 Figure 7 – Number of bibliographic reports per decade of publication (A) and per type of publication (B) ... 34 Figure 8 - Number of presence records per time periods ... 35 Figure 9 - Presence records of golden jackals compiled for Europe and Asia in two time periods: prehistoric times (A) and historic-present times (B) with shaded area that represents the updated range distribution of golden jackal. C – Comparison between IUCN global range (green) and Updated global range (red) of Eurasian golden jackal 36 Figure 10 - Updated and IUCN distribution area of golden jackal for the total global range, and for European and Asian ranges, separately. ... 37 Figure 11 - Distribution of golden jackals in Europe represented in 50x50 km grid squares, across several time periods. A - Prehistoric records. B - Records 1384 until 1850. C - Records between 1850 and 1950. D - Records between 1950 and 1980. E - Records between 1980 and 2010. F – Records after 2010. Shaded area represents the known geographic distribution of golden jackal according to the IUCN (http://www.iucnredlist.org/) ... 38 Figure 12 - Potential distribution of Golden Jackal according to a environmental favourability model based on records at a scale of 50 × 50-km UTM grid. ... 39
Figure 13 - Distribution of samples according to the STRUCTURE results for K= 2(A) and k=7(B). ... 40 Figure 14 - GENELAND modal population for study area. Dots represents the samples... 41 Figure 15 - Principal coordinate analyses (PCoA) for nine populations of Golden Jackal using a set of 43 microsatellites. ... 41 Figure 16 - Geographical distribution of European samples for the Bayesian assignment of individuals to five clusters (k=5) using STRUCTURE. ... 43 Figure 17 – Geographic distribution of genetic diversity of golden jackal through nine populations (He: Expected heterozygosity; Pa: Mean number of private alleles). Values of expected heterozygosity and percentage of private alleles are specified in Annex A7. Calculations were performed over 43 microsatellites. ... 44
List of Tables
Table 1 – Documented distribution of golden jackal by regions in Asia and Europe ... 20 Table 2 - Environmental variables used to model the distributions of the Golden Jackal in Europe and Middle East ... 29 Table 3 - Pairwise FST analysis for nine golden jackal populations ... 42
1. Introduction
1.1. Challenges to conserve carnivores
Facing environmental and climate change, both by geological processes or human action, organisms can adapt locally, migrate or become extinct (Hughes et al. 2003; Davis et al. 2005; Ryan and Cunningham 2012; Vavrus et al. 2012; Ledevin and Millien 2013). In this context, mobility and dispersal influence the long-term survival and adaptation of species facilitating population persistence, thus being suggested as important evolutionary forces (Sharbel et al. 2000; Ramachandran et al. 2005; Hardy et
al. 2006; Hellberg 2009; McManus et al. 2015). In fact, dispersal influences the
distribution and abundance of populations, as well as their persistence and structure (Coulon et al. 2004). Moreover, it determines gene flow within and between populations, assuming that reproduction occurs following dispersal, and affects processes such as local adaptation, speciation and the evolution of life history traits (Slatkin 1987; Bohonak 1999; Dieckmann et al. 1999; Lomolino et al. 2001; Nichols et al. 2001; Gaston 2003). These traits are well exemplified by large carnivores, which have the ability to roam extensive distances and occupy a variety of environmental conditions (Sunquist and Sunquist 2002; Sillero-Zubiri et al. 2004). Larger ranges are linked with high gene flow (Rosenzweig 1995; Gavrilets et al. 2000; Gaston 2003; Birand et al. 2012), nevertheless, there is also an increasing number of evidences showing various barriers to gene flow and effective dispersal, including both physical obstacles and ecological conditions, that eventually promote speciation (Cegelski et al. 2003; Stenseth et al. 2004; McRae et al. 2005; Pilot et al. 2006; Musiani et al. 2007; Schmidt et al. 2011). Furthermore, carnivores are thought to be particularly vulnerable to local extinction in fragmented landscapes due to their relatively large spatial requirements, low numbers, and direct persecution by humans (Noss et al. 1996; Woodroffe and Ginsberg 1998; Stronen et al. 2013).
Large carnivore populations have been expanding and recolonizing former habitats in the last few decades, namely in Europe and North America (Stahl et al. 2001; Crooks 2002; Cardillo et al. 2005; Dalerum et al. 2009; Traill et al. 2010; Linnell and Boitani 2012; Chapron et al. 2014). This event occurs after massive historic declines in population sizes and geographic ranges due to their biological traits such as small population size, long generation times, large home ranges, and high levels of
human persecution (Crooks 2002; Miller and Waits 2003; Kendall et al. 2009; Liberg et
al. 2012; Proctor et al. 2005). These dynamic population trends in large carnivores are
expected to shape their genetic characteristics (Brooker and Brooker 2002; Mills et al. 2003; Bonte et al. 2004; O’Connell et al. 2007). Moreover, this recent expansion have incited increasing human-wildlife conflicts, rendering the need for new effective management and conservation strategies (White and Ward 2010; Cromsigt et al. 2013), for which the understanding of the distribution patterns and their impact on the genetic population structure is essential.
1.1.1. Relevance of dispersal in large carnivores
The expansion of carnivores might follow a propagule model, first the early dispersal of vagrants, usually young males in search of new available territories (Fabbri
et al. 2013), then the settlement of stable reproductive familial units, which may rapidly
expand and saturate all suitable areas (Mech 1970). A variety of factors can influence patterns of dispersal, including home range attributes (Bowman et al. 2002), connectivity of landscapes or habitats (Gibbs 1998; Riley et al. 2006), and even large scale climatic patterns (Geffen et al. 2004). Though, even carnivores are highly mobile by definition, discontinuous habitat and anthropogenic-associated barriers constrict movements and reduce population densities and connectivity (Walker et al. 2000; Sinclair et al. 2001; Woodroffe et al. 2005; Loxterman 2011; McManus et al. 2015). Subsequent human activity has resulted in further and more recent fragmentation in species ranges such as European brown bears (Ursus arctos) (Zedrosser et al. 2001), Eurasian lynx (Lynx lynx) (Schmidt et al. 2011) and wolves (Canis lupus) (Stronen et al. 2012).
Assessing distribution trends and species distribution models are a precious and increasingly used tool for access distribution, dispersal patterns and connectivity. Species distribution models ideally can predict the most likely areas for species presence from a sample of distribution data and their correlation with environmental variables (Guisan and Zimmermann 2000). The knowledge of species distribution patterns and the identification of factors influencing these patterns are crucial for managing biodiversity (Krebs 1978; Brown 1984). In recent years, the modelling of species distributions has been increasingly used to identify suitable habitat (Rushton et
al. 2004), to predict potential distributions (Austin 2002; Robertson et al. 2003) and
identify broad-scale management units (Williams and Araújo 2002).
1.1.2. Effects of regressions and expansions on genetic
parameters
Genetic approaches have been used to identify factors that promote gene flow and connectivity between populations, as well as its overall effect on genetic structure of broader or fine-scale populations (Manel et al. 2003; Broquet and Petit 2009; Row et
al. 2012). When gene flow between populations is prevented, two major genetic threats
may occur: alleles become randomly fixed or are lost due to genetic drift, and prejudicial mutations may accumulate (McManus et al. 2015). It is also known that some species are particularly sensitive to loss of connectivity (Traill et al. 2010): For example, Canada lynx (Schwartz et al. 2002), badgers, long-tailed weasels, spotted skunks, mountain lions, bobcats, and coyotes (Crooks 2002),
To assess the impact of genetic variation in populations, particularly in comparison with environmental factors, inferences on the genetic structure of populations are often done to look for possible genetic clusters and their number. Population genetic structure is determined by the interaction between gene flow and genetic drift (Wright 1943; Kimura and Weiss 1964; Slatkin 1985). Knowledge of the within-population genetic structure should always be a prerequisite for decision making in the management of breeding and natural populations (Hamrick and Sherman-Broyles 1992; Williams and Hamrick 1996). Data from highly mobile large carnivores, such as the Canada lynx (Lynx Canadensis) (Row et al. 2012), the bobcat (Lynx rufus) (Reding et al. 2012), mountain lions (Castilho et al. 2011), wolverines (Kyle and Strobeck 2002), the grey wolf (Canis lupus) (Vila et al. 1999) and the red fox (Vulpes
vulpes) (Teacher et al. 2011), indicate weak population structuring prior to the last
glacial maximum (11.700 years ago), suggesting that the current genetic distributions appeared in consequence of the most recent glaciation (Hofreiter et al. 2004). However, the same species may display limited gene flow in the presence of geographical barriers. Geographical barriers, like mountains and seas, may prevent gene flow between populations and induce isolation, which can result in a cryptic population structuring like has been shown for the Canada lynx (Rueness et al. 2003; Row et al. 2012), the grey wolf (Pilot et al. 2006; Munoz-Fuentes et al. 2009), the Scandinavian lynx (Lynx lynx) (Rueness et al. 2003) and coyotes (Canis latrans) (Sacks et al. 2008).
Additionally, recent studies have revealed cryptic population structures correlating with transitions in habitat types and prey species composition. This is the case of the Canadian lynx, for which three demographically distinct populations were described, inhabiting three climatic regions with differential snow conditions, leading to different dynamics between predator and prey (the snowshoe hare Lepus americanus) (Rueness et al. 2003) and to genetic structure (Stenseth et al. 2004). In another example, Dalen et al. (2005) showed that genetic differentiation in the Artic fox appears to be directly correlated to prey specialization, revealing that the genetic structure of this species throughout its range corresponds to two ecotypes, one specialized on lemmings and another feeding on coastal food. Habitat and dietary differentiation has also been shown to correlate with genetic structure in the grey wolf Canis lupus (Pilot
et al. 2006; Carmichael et al. 2007; Musiani et al. 2007; Munoz-Fuentes et al. 2009).
The genetic diversity of expanding populations is influenced by the rates of long-range dispersal and by founder effects (Fabbri et al. 2007, Cohen et al. 2013). On the other hand, relict and isolated populations might face losses of genetic diversity if population expansion is delayed by years (Vila et al. 2003). This is in accordance with recent findings on the grey wolf genetic structure in Europe, for example the wolves in Alps, that suffered isolation, have significantly lower genetic diversity (heterozygosity, allelic richness, number of private alleles) than wolves in the Apennines (Fabbri et al. 2007). Small, isolated, and fragmented populations suffer loss of genetic diversity over time through inbreeding and genetic drift (Ellstrand and Elam 1993; Lacy 1997; Frankham and Ralls 1998; Chevolot et al. 2008). When population size suffers a deep reduction is normally referred to as a population bottleneck, which c an result in low levels of genetic diversity (Nei et al. 1975; Chakraborty and Nei 1977; Nei 1977; Leberg 1992). Expected and observed heterozygosity, effective and private alleles, and genetic distances between populations are an example of diversity analysis that give us important information about populations and their connectivity.
Most commonly, genetic studies have employed neutral markers such as microsatellites, which are useful for addressing questions relating to the origin of founders, inbreeding and relatedness (Jarne and Lagoda, 1996; Marsden et al. 2013). Microsatellites are tandemly repeated sequences found in all eukaryotes and also in the chloroplastic genome of plants. In general, microsatellite loci are highly polymorphic in natural populations, with average expected heterozygosity well above 50% which is a consequence of their high mutation rates. Microsatellites have been widely used to investigate the population structure, including the genetic relationships, among subpopulations (Forbes et al. 1995; Estoup et al. 1996) and the estimation of genetic
distances among closely related populations (Bowcock et al. 1994; Buchanan et al. 1994; Ciampolini et al. 1995; Estoup et al. 1995; Forbes et al. 1995; Arranz et al. 1996; Barker et al. 1997; MacHugh et al. 1997).
Applying molecular genetic tools has made possible to gain greater knowledge of the current status of populations of carnivores and to harness this information to develop efficient management strategies that may be of assistance in wildlife conservation. However, genetic studies across continents and with broader scale have mainly focused iconic carnivore species, such as lynxes (Schwartz et al. 2002; Rueness et al. 2003; Reding et al. 2012; Row et al. 2012; Ratkiewicz et al. 2014), bears (Kopatz et al. 2014), wolves (Vila et al. 1999; Pilot et al 2010; Stronen et al. 2013), coyotes (Sacks et al. 2008) and foxes (Teacher et al. 2011; Statham et al. 2014), but other carnivore species with large occurrence areas, such as Eurasian Golden Jackal, are still lacking comprehensive information.
1.2. The Golden Jackal as a case study
The Golden jackal Canis aureus (Fig. 1) is one of the most widely distributed canid species although there is little available information on its natural history. Golden jackals were considered to be found across many areas of Europe, Asia and Africa (Sillero-Zubiri et al. 2004). However, jackals from North and East Africa have been recently recognized as a different species, more related to wolves and with distinct evolutionary history than Eurasian jackal despite a high morphological similarity (Koepfli et al. 2015).
Eurasian golden Jackal is a medium-sized carnivore with mean body mass for females as 5.8kg, and for males 6.6kg, and a total length up to 74-84 cm (Sillero-Zubiri
et al. 2004). Basic coat color is golden but varies from pale creamy yellow to a dark
tawny hue on a seasonal basis (Sillero-Zubiri et al. 2004). Due to their tolerance of dry habitats and their omnivorous diet, the golden jackal can live in a wide variety of habitats. They occupy forested, mangrove, agricultural, rural and semi-urban habitats, they are omnivorous and opportunistic foragers, and their diet varies according to season and habitat, between invertebrates, fruit, rodents, hares, lizards, snakes and birds (Sillero-Zubiri et al. 2004). Jackals are territorial animals but their social Figure 1 – Phenotipic variation on the Eurasian Golden Jackal Canis aureus, in Europe (A; © Carlo Galliani), Iran (B; © Fariborz Heidari), Israel (C; © Yoav Perlman) and India (D; © Victor Sazatornili).
organization is extremely flexible depending on the availability and distribution of food resources (MacDonald, 1979; Sillero-Zubiri et al. 2004). The basic social unit is the breeding pair, which is sometimes accompanied by its current litter of pups and/or by offspring from former litters. Golden jackal is classified by the IUCN as Least Concern, due to its widespread range in areas with optimum food and shelter (Jhala and Moehlman 2008), but is listed as “vulnerable” in the Red Data Book for Greek Vertebrates (Karandinos and Parasch 1992), where suffered a huge population decline induced by human activities. Moreover, in Europe, jackal has become the most popular predator for hunting due to its valuable skin (Trouwborst et al. 2015).
The Eurasian golden jackal (Canis aureus) occurs in South Asia eastward to Thailand, Middle East, southeastern and central Europe (Demeter and Spassov 1993; Jhala and Moehlman 2004; Stoyanov 2012). Based on fossil records, it has been suggested that jackals have colonized Europe during the Upper Holocene (Bauer 2001), constituting a relict population, namely in Dalmatia (Coastal Croatia) and Greece, that reveal regression in last decades (Giannatos et al. 2005). Currently, golden jackal is most common on Southeastern Europe, with increasing expanding populations towards central and northeastern Europe (Arnold et al. 2012; Trouwborst et
al. 2015). These assessments of expansions and regressions in European populations
together with the fact that the available ecological information about this species actually include two different taxons (the African jackal mentioned above), confirms the necessity of studies that approach the ecology, distribution patterns and genetic characteristics to identify management units and potential colonization routes.
1.2.1. Distribution patterns of Eurasian golden Jackal
The golden jackal’s distribution is under documented in their global range. It’s known only a rough area available in IUCN, showing Southeast Europe, Middle East and Southeast Asia with presence of Golden Jackal (Fig.2). The exact boundaries of the occurrence area are not known, namely the expansion front in Europe, the northern range limit in Asia and the potential connection between Europe and Asia.
In Asia, there are few studies addressing jackal distribution and often involve a few number of records. Nevertheless, Golden Jackal’s documented range in Asia is vast, with records from the Middle East to Southeast Asia (Table 1). There are no evidences of expansions or regressions of populations in Asia, except at local scale in Israel (Cohen et al. 2013). In Europe, golden jackal appears better documented that in Asia, but their recent expansions and range extent are poorly known. Golden jackals nearly became extinct during the 1960s, in Europe, due to habitat loss and persecution with poisoned baits (Spassov 1989). Nucleus populations were found only in s ome dispersed regions, for example, Strandja (Bulgaria and Turkey), Dalmatian (coastal Croatia), Aegean Macedonia and the Peloponnesus (Spassov 1993; Giannatos 2004; Spassov 2007; Arnold et al. 2012). Apart from Greece, where the jackals are on the decline and listed as vulnerable in the national Red List, the species has expanded its European distributional range, most notably in Bulgaria, which now supports the largest jackal population in Europe (Krystufek et al. 1997) (Table 1).
Figure 2 - Geographic range of the Eurasian Golden Jackal according to IUCN Red List of Threatened Species (http://w ww.iucnredlist.org/) and main regions mentioned along the text: A – Baltic region; B – Panonian Basin; C – Danube river; D – Dalmatia (Coastal Croatia); E – Samos Island (Greece); F – Turkey; G – Levant; H – Black Sea; I – Caucasus; J – Elbrus Mountain (North Iran); K – Baluchistan (South of Iran); L – Caspian Sea; M – South former-URSS; N – Indian subcontinent; O – Southeast Asia
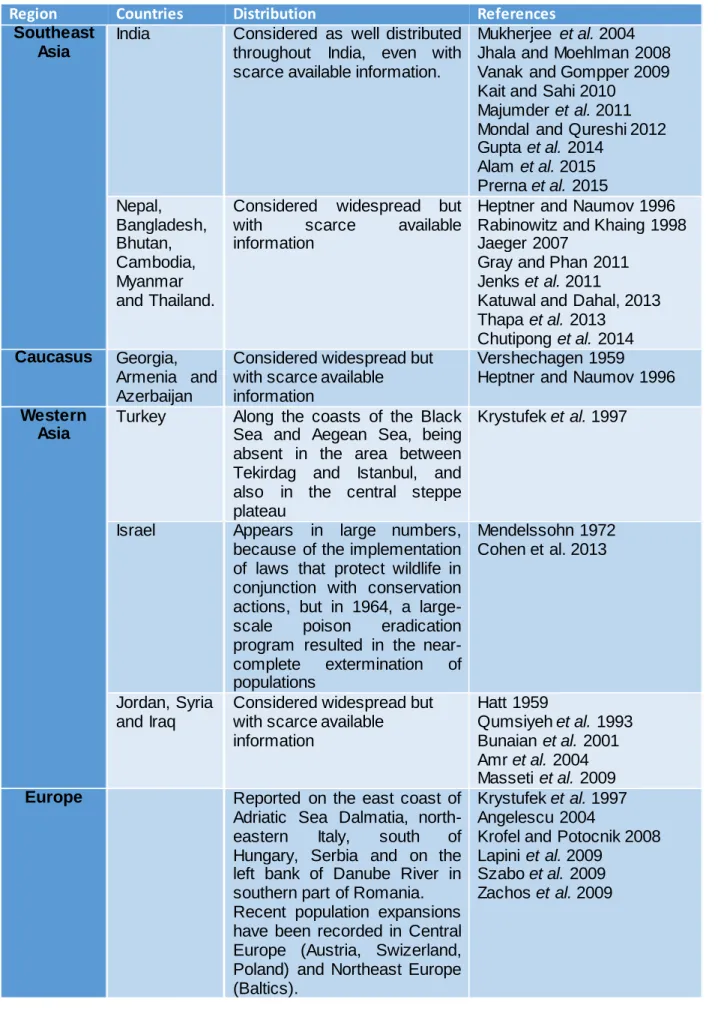
Table 1 – Documented distribution of golden jackal by regions in Asia and Europe.
Region Countries Distribution References
Southeast Asia
India Considered as well distributed throughout India, even with scarce available information.
Mukherjee et al. 2004 Jhala and Moehlman 2008 Vanak and Gompper 2009 Kait and Sahi 2010
Majumder et al. 2011 Mondal and Qureshi 2012 Gupta et al. 2014 Alam et al. 2015 Prerna et al. 2015 Nepal, Bangladesh, Bhutan, Cambodia, Myanmar and Thailand.
Considered widespread but
with scarce available
information
Heptner and Naumov 1996 Rabinowitz and Khaing 1998 Jaeger 2007
Gray and Phan 2011 Jenks et al. 2011
Katuwal and Dahal, 2013 Thapa et al. 2013
Chutipong et al. 2014 Caucasus Georgia,
Armenia and Azerbaijan
Considered widespread but with scarce available information
Vershechagen 1959 Heptner and Naumov 1996 Western
Asia
Turkey Along the coasts of the Black Sea and Aegean Sea, being absent in the area between Tekirdag and Istanbul, and also in the central steppe plateau
Krystufek et al. 1997
Israel Appears in large numbers,
because of the implementation of laws that protect wildlife in conjunction with conservation actions, but in 1964, a large-scale poison eradication program resulted in the near-complete extermination of populations Mendelssohn 1972 Cohen et al. 2013 Jordan, Syria and Iraq
Considered widespread but with scarce available information Hatt 1959 Qumsiyeh et al. 1993 Bunaian et al. 2001 Amr et al. 2004 Masseti et al. 2009 Europe Reported on the east coast of
Adriatic Sea Dalmatia, north-eastern Italy, south of Hungary, Serbia and on the left bank of Danube River in southern part of Romania. Recent population expansions have been recorded in Central Europe (Austria, Swizerland, Poland) and Northeast Europe (Baltics).
Krystufek et al. 1997 Angelescu 2004
Krofel and Potocnik 2008 Lapini et al. 2009
Szabo et al. 2009 Zachos et al. 2009
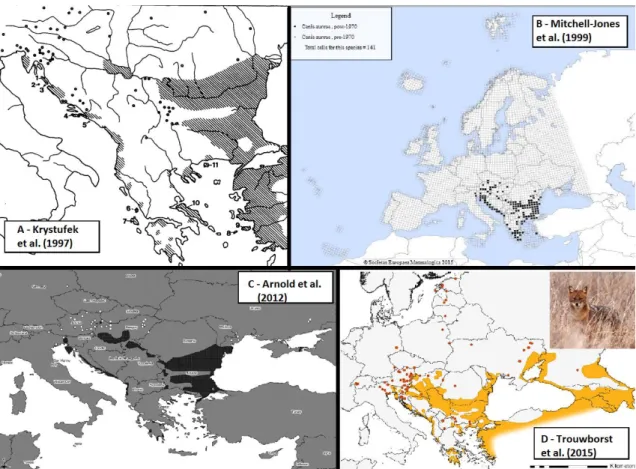
Detailed assessments of the jackal’s distribution have been done only in Europe (Fig. 3). Krystufek et al. (1997) (Fig. 3A) published the first review on jackal distribution based in a compilation of records without systematic survey and presenting course range maps. The first systematic survey for this species was conducted by Mitchell-Jones et al. (1999) (Fig. 3B) in the scope of the “Atlas of European Mammals” presenting confirmed records of golden jackal before and after 1970 at a 50x50 km UTM grid, and showing the first evidences of population expansion. More recently, Arnold et al. (2012) (Fig. 3C) presented an updated review on jackal distribution records and areas and showed that golden jackal was expanding towards north and west. Finally, a recent article presents a detailed and updated account of the current distribution of golden jackal in Europe (Trouwborst et al. 2015) (Fig. 3D), considering for the first time both areas occupied by territorial groups and records of vagrant animals, revealing new areas of occurrence in the Baltic region and in central Europe, such as Switzerland and Germany.
In Europe, various populations are in expansion (towards central and northeast Europe) while others have evidences of regression (e.g. Greece and Balkan region), revealing different population histories and most likely different genetic characteristics which should be reflected in different managements and legal measures. This new Figure 3- Main studies w ith distribution assessments of Golden Jackal in Europe: A – Krystufek et al. (1997); B – Mitchel-Jones et al. (1999); C – Arnold et al. (2012); D - Trouw borst et al. (2015)
expansion from Baltic region raised new legal issues, namely the consideration of golden jackal as invasive species and its inclusion as a hunting species in several European countries. Trouwborst et al. (2015) demonstrated that jackals are not an invasive species and because of that the governments of Baltic region, where population persist for centuries, should reevaluate hunting laws.
1.2.2. Genetic characterization of the Eurasian Golden Jackal
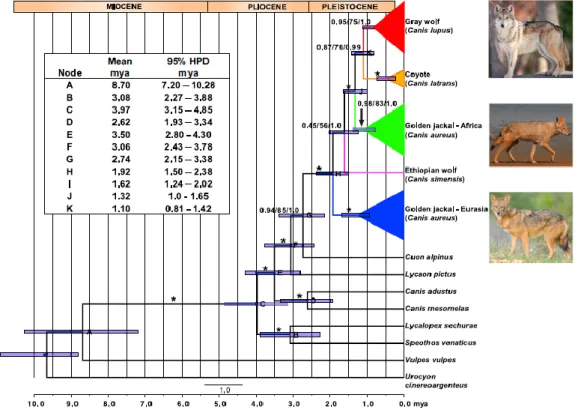
The golden jackal belongs to genus Canis. Phylogenetic studies show that grey wolf, coyote and Ethiopian Wolf (Canis simensis) form a monophyletic group, with the golden jackal as the most likely sister taxon (Fig. 4) (Sillero-Zubiri et al. 2004, Lord etal. 2013; Koepfli et al. 2015). The golden jackal is currently not considered an African
inhabitant. Very recently, Koepfli et al. (2015) show that African and Eurasian golden jackals are genetically distinct and independent lineages, and that African golden jackals likely represent a separate species, based on their results of mtDNA, nuclear loci, and whole genomes. Using morphologic data, they also demonstrate a spectacular morphologic similarity between East African and Eurasian golden jackals, suggesting parallelism, which may have mistaken taxonomists.
The genetic structure and diversity of golden jackal populations still remains largely unknown and merely genetic studies from regional character exist. Confirming this, a unique genetic study with golden jackals in Israel suggested that five subpopulations could be discerned among local individuals, and although values of genetic diversity were generally low between geographically adjacent subpopulations , were higher in comparisons involving the center subpopulation suggesting the genetic isolation of canids in this region. (Cohen et al. 2013).
In Europe, Zachos et al. (2009) demonstrated very low genetic variability among subpopulations in Serbia, and an Austrian vagrant jackal was genetically indistinguishable from the Serbian animals with respect to both mtDNA and microsatellites. This is interesting because it has been assumed that the golden jackals found in Italy, Slovenia and Austria came from Istria in northwestern Croatia (Krystufek
et al. 1997). In other genetic study, bayesian and landscape genetics models showed a
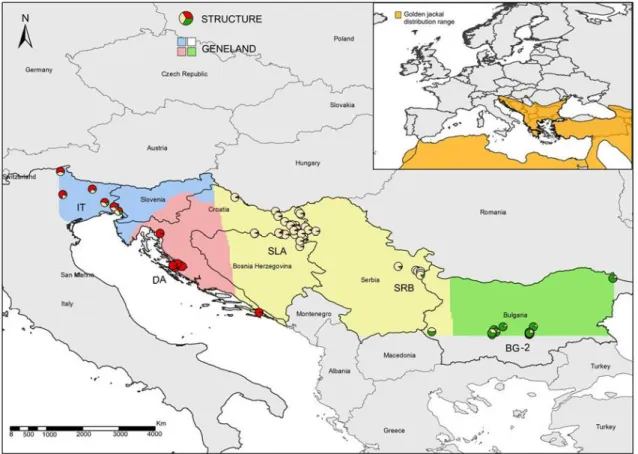
weak population subdivision between Bulgaria, Serbia and Italy, but golden jackals from Dalmatia clustered separately from the other samples (Fig. 5) (Fabbri et al. 2013). Moreover, allele richness and heterozygosity were smaller in Dalmatia than in the other populations. Reduced genetic diversity suggests that jackals in Dalmatia might have experienced a demographic bottleneck in the past (Cornuet and Luikart 1996) and have survived in isolation for centuries. Population structure and assignment tests concordantly indicated that jackals colonizing Italy have admixed genotypes that originated from the Dalmatian and Slavonian populations.
Nevertheless, further genetic analyses of jackals from other countries in southeastern Europe are needed, and there are also missing studies addressing distribution patterns and genetic traits of golden jackals in intercontinental scale, including Middle East and Southeast Asian populations. Several sub-species were described based on morphology, but genetic studies are missing (Ellerman and Morisson-Scott 1951; Coetzee 1977; Sillero-Zubiri et al. 2004).
Figure 5 – Patterns of genetic structure of Golden Jackal in Europe based in the analysis of 14 microsatellites and according to results from. Structure and Geneland (shaded areas) ( adapted from Fabbri et al, 2013).
1.3. Objectives
This study aims to investigate the distribution patterns and genetic structure of the Eurasian golden jackal by focusing three main goals:
1) Assess the past and current range of golden jackals in Europe and Asia by an exhaustive bibliographic compilation of presence records. With this approach we expect to improve the knowledge on the current distribution of the Eurasian golden jackal, evaluate the distribution trends of the expanding golden jackal population in Europe and identify areas with fossil records of this species. 2) Determine the potential distribution of golden jackal in Europe and Middle East
by modelling known presence records. With this approach, we intend to identify areas of potential connectivity between European and Middle East populations and to provide insights on the potential distribution in the areas where presence is poorly known, such as Turkey, Belarus and Ukraine.
3) Analyze population structure and genetic diversity in golden jackals from Europe and Middle East based on microsatellite data. With this approach, we expect to determine local and large scale patterns of genetic diversity and differentiation, major population clusters and make inferences on source populations and routes of expansion in recently colonized European areas.
Considering these three main goals, we intend to address the following questions:
What are the time periods with a higher number of presence records and bibliographic sources?
What is the degree of updated of IUCN distribution range of golden jackal updated and how much area are outdated?
Are all golden jackal populations in Europe a result of recent expansions or there are some relict populations?
What are the potential areas of connectivity between Europe and the Middle East?
What is the degree of connectivity and isolation between golden jackals populations in Europe and Middle East?
What is the source of the recent population occurring in Central and Northeastern Europe?
What is the degree of genetic diversity across Europe and Middle East and how is it geographically distributed?
Is genetic variability geographically structured?
The results of this study are expected to contribute to increase our understanding on the range patterns as well as the genetic diversity and population structure of the Eurasian golden jackal, in order to increase the available knowledge on this species and to improve our capabilities for its efficient management and conservation.
2. Materials and Methods
2.1. Distribution patterns
2.1.1. Data collection
A compilation of presence records from golden jackal was done based in an intensive literature review, focused both in scientific journals and grey literature. For that, search engines were used such as Google Scholar, Web of Science, Sci-Hub and BookSc. In this search, the keywords used were “golden jackal”, “Canis aureus”, “carnivore”, “mammals”, each combined with the country name within this species known range. The compilation of presence records was obtained based on both text and figures from various scientific articles, technical reports and websites (references in Annex 1). For records present in text, an excel database was constructed in which country, locality/city/region, continent, latitude, longitude, date of occurrence, reference of article or journal and type of record (territorial group, vagrant animal, photographed, shot, runover or fossil record) was annotated. When latitude and longitude values were missing, we considered the geographic coordinates of the locality, city or region that was mentioned. Figures were georeferenced to extract the coordinates of presence records. Tissue samples used for genetic analysis were also considered as presence records whenever the exact geographic coordinate was known. Based on these presence records, a new global range of Eurasian golden jackal was constructed to update global range maps available at the IUCN. Furthermore, it was made a comparison between the total areas of update and present IUCN global range, as well as, for a continental scale in Europe and Asia (the whole Russia and Turkey were considered in Asian continent, and Ukraine and Belarus in Europe), using the IUCN criteria (http://www.iucnredlist.org/documents/RedListGuidelines.pdf).
Considering the timescale of each presence record in all jackal range in Europe and Asia, maps were made for prehistoric records (Late Postglacial, Holocene, Neolithic and Bronze age; from 20,000 years ago to 2,600 years ago) and historic-present records (from 1384 to historic-present). Only for Europe, where more data are available, distribution trends of the species were accessed by mapping records to the scale of UTM 50X50 km and considering the following time intervals: prehistoric records, between 1384-1850, 1850-1950, 1950-1980, 1980-2010, and after 2010. All spatial analysis were done using a Geographic Information System (QGIS 2.8.).
Furthermore, number of presence records per time intervals were analysed to Europe and Asia.
Based on literature search, the number of bibliographic sources per decade and per type of publication (Scientific Citation Index (SCI) journal, non-SCI journal, Book, Report or Website) were performed simultaneously to Europe and Asia. A journal was considered a non-SCI journal when the impact factor was 0.
2.1.2. Modelling potential distribution
To model the potential distribution of golden jackals in Europe and Middle East, we used 653 presence records and 11172 absences (generated by subtracting the total of squares with the number of presence records) at a scale of UTM 50km×50km, obtained from the compilation of bibliographic records mentioned above. We used 22 predictor variables related to topography, climate and human activity, which are expected to affect jackal occurrence (Table 2). All 19 climatic variables and altitude were obtained from WorldClim – Global Climate Data (Hijmans et al. 2005) and averaged on the UTM cells with the raster package (Hijmans 2015) under the R software (R Core Team 2014). Variables related to Human activity included human density (Oak Ridge National Laboratory (2008) and the Global Radiance Calibrated Nighttime Lights (NOAA's National Geophysical Data Center (2015). The values of these variables per UTM cell were extracted with the Zonal Statistics plugin in QGIS 2.6 (QGIS Development Team, 2015).
To build the distribution model of Golden Jackal we used the favorability function described in Real et al. (2006), a GLM that computes local variations in species presence probability in relation to overall species prevalence. With the favorability function, thresholds for all models are levelled according to the species prevalence in each area. A favorability value of 0.5 means that presence of the species is as probable as its prevalence in the corresponding study area, i.e., neutral environmental favorability.
Regressions were performed using forward–backward stepwise variable selection (Pearce and Ferrier 2000) using Akaike's Information Criterion (AIC). Any non-significant variables left in the model after this procedure were removed. Stepwise selection is commonly used in distribution modelling (Araújo et al. 2005; Bulluck et al. 2006; Arntzen 2006) as it maximizes predictive efficiency in an objective and
reproducible way and is a useful and effective tool when the individual importance of each variable is not known a priori (Hosmer and Lemeshow 2000). This methodology is implemented in a software package, fuzzySim (Barbosa 2015), which allows a variety of methods for converting (multiple) species presence/absence data into continuous, fuzzy surfaces, including inverse distance to presence raised to any power, trend surface analysis of any given degree and generalized linear models based on presence–absence. Such models have been successfully used for several species before (Barbosa et al. 2009; Barbosa et al. 2010).
Table 2 - Environmental variables used to model the distributions of the Golden Jackal in Europe and Middle East and their positive (+) or negative (-) influence.
Type of variable
Variable Influence
(+/-)
Source
Climate Annual Mean Temperature + http://www.worldclim.org/bioclim
Climate Mean Diurnal Range (Mean of monthly (max temp - min temp))
+ http://www.worldclim.org/bioclim
Climate Isothermality (* 100) - http://www.worldclim.org/bioclim
Climate Temperature Seasonality (standard deviation *100)
- http://www.worldclim.org/bioclim Climate Max Temperature of Warmest
Month
- http://www.worldclim.org/bioclim Climate Min Temperature of Coldest
Month
+ http://www.worldclim.org/bioclim Climate Temperature Annual Range
(BIO5-BIO6)
http://www.worldclim.org/bioclim Climate Mean Temperature of Wettest
Quarter
+ http://www.worldclim.org/bioclim Climate Mean Temperature of Driest
Quarter
http://www.worldclim.org/bioclim Climate Mean Temperature of Warmest
Quarter
+ http://www.worldclim.org/bioclim Climate Mean Temperature of Coldest
Quarter
- http://www.worldclim.org/bioclim
Climate Annual Precipitation http://www.worldclim.org/bioclim
Climate Precipitation of Wettest Month - http://www.worldclim.org/bioclim Climate Precipitation of Driest Month + http://www.worldclim.org/bioclim Climate Precipitation Seasonality
(Coefficient of Variation)
- http://www.worldclim.org/bioclim Climate Precipitation of Wettest Quarter + http://www.worldclim.org/bioclim Climate Precipitation of Driest Quarter - http://www.worldclim.org/bioclim Climate Precipitation of Warmest
Quarter
http://www.worldclim.org/bioclim Climate Precipitation of Coldest Quarter + http://www.worldclim.org/bioclim
Topographic Altitude http://www.worldclim.org/bioclim
Human Night Light - ftp://ftp.ngdc.noaa.gov/DMSP/w
eb_data/ x_rad_cal/rad_cal.tar
2.2. Genetic analyses
2.2.1. Samples
A total of 224 tissue samples of golden jackal (animals founded dead by shot or runover, for example) were obtained by a network of collaborators across most jackal range in Europe and Middle East (Figure 6) comprising the following countries: Germany (1), Austria (3), Slovenia (4), Hungary (15), Croatia (31), Serbia (49), Bulgaria (19), Romania (5), Macedonia (4), Greece (10), Latvia (9), Estonia (7), Georgia (6), Azerbaijan (1), Iran (42), Israel (15) and Turkey (3). All tissue samples were preserved in ethanol at room temperature until DNA extraction.
2.2.2. DNA extraction
The DNA of tissue samples was extracted using QIAGEN’s EasySpin Kit, following an adapted protocol for tissue samples (available in Annex A3). The success of DNA extraction was assessed by electrophoresis on 0.8% agarose gels stained with Gel Red, in TBE 0.5x buffer, run for 10 to 15 minutes at 300V. Further visualization Figure 6 - Location of the samples available for this study and the geographic distribution of Eurasian golden jackal according to the IUCN (http://w w w .iucnredlist.org/). Purple dots – successful samples in DNA extraction and microsatellites genotyping. Red dots – samples that failed DNA extraction or genotyping.
through UV radiation was achieved in a Biorad Universal Hood II Quantity One 4.4.0. According to the estimated DNA concentration, the samples were appropriately diluted in ultrapure water to allow proper amplification PCR and stored at - 20 °C, where they remained throughout the work laboratory.
2.2.3. Microsatellite amplification and genotyping
In this study we used 43 autosomal microsatellites developed for canids, summarized in the Annex A4 and already optimized in the lab by Godinho et al. (2011, 2015). PCR reactions were performed in four multiplex reactions (MS1, MS2, MS3 - Supplementary Material in Annex A5) at a final volume of 10μL, with 5μL of Qiagen Master Mix, 1μL of DNA, 1μL of the primer mix and 3μL of pure water and in another multiplex reaction (Finnzymes) at final volume of 10μL, with 5μL of Fusion Master Mix, 1μL of DNA, 3μL of the primer mix and 1μL of pure water. For multiplex MS1, MS2 and MS3 touchdown PCR reactions were conducted. For MS1 the PCR profile was the following: initial denaturation at 95ºC for 15 minutes; 20 cycles with a denaturation step at 95ºC for 30 seconds, annealing at 58ºC for 45 seconds and extension at 72ºC for 45 seconds; 15 cycles of 95ºC for 30 seconds, 56ºC for 45 seconds, 72ºC for 30 seconds; 10 cycles of 95ºC for 30 seconds, 53ºC for 45 seconds, 72ºC for 30 seconds, followed by a final elongation step at 60ºC for 30 minutes. For MS2, the PCR was made with an initial denaturation at 95ºC for 15 minutes; 35 cycles with a denaturation s tep at 95ºC for 30 seconds, annealing at 56ºC for 45 seconds and extension at 72ºC for 45 seconds; 8 cycles of 95ºC for 30 seconds, 53ºC for 45 seconds, 72ºC for 30 seconds, followed by a final elongation step at 60ºC for 30 minutes. Finnzymes multiplex, a commercial kit, reactins were performed according to the manufacture’s instructions. For MS3, PCR profile was the following: initial denaturation at 95ºC for 15 minutes; 7 cycles with a denaturation step at 95ºC for 30 seconds (decreasing 0.5ºC each cycle), annealing at 60ºC for 45 seconds and extension at 72ºC for 45 seconds; 22 cycles of 95ºC for 30 seconds, 57ºC for 45 seconds, 72ºC for 30 seconds; 8 cycles of 95ºC for 30 seconds, 53ºC for 45 seconds, 72ºC for 30 seconds, followed by a final elongation step at 60ºC for 30 minutes. Amplifications were performed in Biorad T100 Thermal Cyclers, and a negative control was used in each PCR to monitor for possible contaminations. After the amplification, PCR products were accessed by electrophoresis on 2% agarose gel stained with Gel Red, using a mass DNA ladder (NZYDNA Ladder V), with further conditions being identical to the ones described for the extraction electrophoreses. PCR products were diluted, if necessary, according to
the observed quality in the agarose gels and were then separated by capillary electrophoresis on an automatic sequencer ABI3130xl Genetic Analyzer (AB Applied Biosystems), using 1μl of amplification product for 10μl of formamide 75-400 (-250) LIZ NEW size standard.
Microsatellite reading and scoring was performed in GENEMAPPER v4.0 (Applied Biosystems). Automated scoring was combined with manual checking to mitigate the amount of errors. Very sporadic suspicious genotypes were declared as missing data. Samples were PCR amplified up to three times in case of amplification failure.
2.2.4.
Statistical analyses
Samples and loci presenting 40% or more of missing data were discarded from the analysis. A final dataset was created with 184 samples from Asia and Europe, representing 82% of the initial sampling.
Bayesian clustering and admixture analyses were performed in STRUCTURE v2.3.4 (Pritchard et al. 2000), using admixture model with correlated frequencies and no priors for putative populations. Ten independent simulations were performed for each K (1 to 8), with 1.0 x 10⁶ MCMC interactions and a burn-in of 5.0 x 10⁵ interactions. Population information was not considered in this analysis in order to infer the most probable number of genetic clusters without a priori definition of populations. The results were uploaded to the STRUCTURE HARVESTER 0.6.94 (Earl and vonHoldt 2012) in order to identify the most likely number of genetic clusters (K) according to the highest value of ΔK (Evanno et al. 2005). To visualize patterns of genetic differentiation among individuals, a principal coordinate analyses (PCoA) was performed using GenALEx v6.5 (Peakall and Smouse 2006). A second dataset with 142 samples from Europe was created and bayesian clustering and admixture analyses were performed in STRUCTURE v2.3.4, to compare our results with other results from literature. The spatial locations of genetic clusters were analysed further by landscape genetic analyses in GENELAND 4.0.3 (Guillot et al. 2005), with 106 MCMC iterations (thinning = 100 and post-process burn-in = 50 iterations).
Genetic diversity was examined for nine populations defined from results of STRUCTURE and by geographical coherence with the existence of historic-present records and recent distribution trends: Baltics (Latvia and Estonia), Samos Island
(Greece), Dalmatia (coastal Croatia), Central Europe (Germany, Austria, Slovenia, Hungary and western of Serbia), South Europe (Eastern Serbia, Bulgaria, Romania and Greece), Caucasus (Azerbaijan, Georgia and Northwestern Iran), Northeastern Iran, Baluchistan (Southern Iran) and Israel. Deviations from Hardy-Weinberg equilibrium and tests for linkage disequilibrium across all populations and loci were performed in GENEPOP v4.2 on the web (Raymond and Rousset 1995; Rousset 2008). Genalex 6.5 (Peakall and Smouse 2006, 2012) was used to calculate genetic diversity index such as observed (Ho) and expected heterozygosity (He), mean number of private alleles per locus and FST pairwise analyses between populations.
3. Results
3.1. Available knowledge on golden jackal distribution
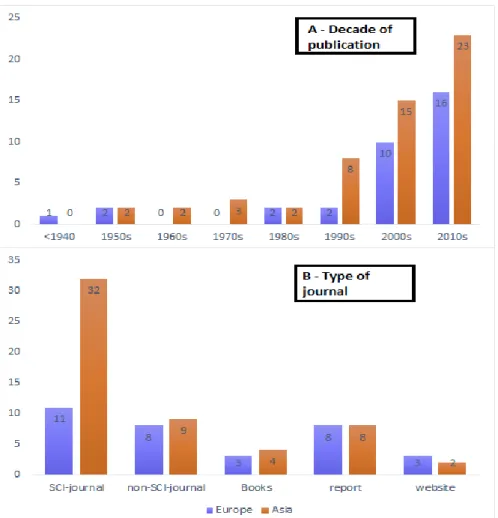
A total of 86 publications were found with references to golden jackal presence in its entire range, from which 55 were from Asia and 33 from Europe. Considering the year of publication, there is a clear trend towards an increase of available literature with time, which is noticed in both continents, being 73% of publications dated after 2000 (Fig. 7A). Regarding publication type, in Europe most of publications on jackals are found in reports or nonscientific journals, such as books, reports and websites; (67%), whereas in Asia 58% of publications were in Scientific Citation Index (SCI) journals (Fig. 7B). Only four reviewed publications, all of them in Europe, were concerning distribution atlases at a large (e.g. above country level) or continental scale resulting from a detailed and systematic survey to detect jackal presence.3.2. Distribution patterns and trends
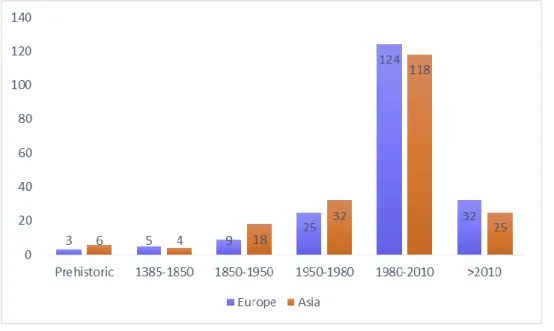
Based in bibliographic search, a total number of 1842 presence records of Eurasian Golden Jackal were obtained across their entire range in Europe and Asia. In general, until 1980, we found more records from Asia than Europe, occurring a significant increase of records between 1980 and 2010 in both continents, and more recently, there are more records of golden jackal in Europe than in Asia (Fig. 8).
Figure 8 - Number of presence records per time periods
Presence records were analysed in two main time periods: prehistoric records (Last postglacial, Holocene, Neolithic and Bronze Age), ranging from 20,000 years ago to 2,600 years ago (N=9 records) and historic records, ranging from 1384 (XIVth century) to present times (N=1833 records) (Fig. 9). Prehistoric records of jackals were found in Europe and Middle East. The oldest fossil record is from Ksar Akil (Palestine), dating from late postglacial, approximately 20.000 years ago. From lower Holocene, more precisely around 11.700 years ago, it was found a fossil in Hvar Island (Croatia). Also from Holocene, four more fossils were found in Mousterian Cave (West Iran), Apsheron Peninsula (Azerbaijan), Saraibulakh ridge and Tskhali-Tsiteli gorge (Armenia). In Greece, golden jackal’s remains were found in Delphi and Kitsos, dating from Neolithic (10.200 – 4.000 years ago). More recently, from Bronze Age (3.300 – 2.600 years old), a fossil was found in Bisotun Cave, near Behistun, West Iran.
Figure 9 - Presence records of golden jackals compiled for Europe and Asia in tw o time periods: prehistoric times (A) and historic-present times (B) w ith shaded area that represents the updated range distribution of golden jackal. C – Comparison betw een IUCN global range (green) and Updated global range (red) of Eurasian golden jackal
At least one presence record was obtained per country within golden jackal known range (Fig. 9 and Annex 2). However, a much higher number of known records were obtained in Europe (N=1250) than in Asia (N=592), reflecting the amount of available literature and knowledge in jackal distribution. Europe, Iran and Caucasus are the regions where more information on jackal distribution was obtained. Our bibliographic search allowed to detect the presence of golden jackals in wide new areas located north from the previously known geographic distribution of the species according to IUCN, including most of Central and Northeast Europe (Switzerland, Italy, Germany, Austria, Czech Republic, Slovakia, Hungary, Romania, Moldavia, Ukraine, Poland, Belarus, Latvia, Estonia), northern Black sea and Caucasus (Ukraine, Russia) and central Asia (Turkmenistan, Uzbequistan, Kazakhstan and Tajikistan). The 1842 presence records allowed to map an updated global range of Eurasian golden jackal with 1713.95 km2, increasing about 72% of IUCN global range (Fig. 9 and 10). In Europe the area of presence of golden jackal increases up to five times of IUCN global range and, in Asia, increases 49%.
Figure 10 - Updated and IUCN distribution area of golden jackal for the total global range, and for European and Asian ranges, separately.
The distribution trend of golden jackal was evaluated in Europe, based on records represented in 50x50 km grid square across several time intervals (Fig. 11). Jackals are known from pre-historic times only from three records in Dalmatia (coastal Croatia) and southern Greece. Between 1384 and 1850, seven jackal records were obtained from Dalmatia, the Panonian Basin (Hungary), and around the Black sea (Bulgaria and South of Russia). After 1850 until 1950, 24 records were obtained roughly in the same areas and after 1950 up to 1980, 80 records were obtained,
suggesting the expansion along the plains adjacent to Danube River and in coastal areas of Greece and Albania. Between 1980 and 2010, 453 records of golden jackal show the expansion across coast of Mediterranean Sea and Black Sea, as well as until Germany, Slovakia and Austria in the North. After 2010, 334 records comprise the expansion of the species until Switzerland, in the West, and Latvia and Estonia, in the North. Comparing our results with IUCN distribution range of golden jackal, we notice the existence of records outside the area indicated by IUCN for the species occurence.
Figure 11 - Distribution of golden jackals in Europe represented in 50x50 km grid squares, across several time periods. A - Prehistoric records. B - Records 1384 until 1850. C - Records betw een 1850 and 1950. D - Records betw een 1950 and 1980. E - Records betw een 1980 and 2010. F – Records after 2010. Shaded area represents the know n geographic distribution of golden jackal according to the IUCN (http://w w w.iucnredlist.org/)
3.2.1. Potential distribution model
The map of environmental favourability values for Golden Jackal in Europe and Asia is represented in Fig. 12. In general the Asian continent shows lower values of environmental favourability in comparison with Europe. According to the map, both north and south of the Black Sea, that is, both areas of connectivity between Europe and Asia, seem environmentally appropriate for the migration of golden jackals. The high levels of environmental favourability in Central and Western Europe show that the recent expansion of jackals is plausible, as well as possible expansion to the south coast of Scandinavia, where the species is not currently recorded present. The model we analyzed showed good predictive capacity, showing the AUC equal to 0.835.
Figure 12 - Potential distribution of Golden Jackal according to a environmental favourability model based on records at a scale of 50 × 50-km UTM grid.
1
0 0.5
3.3. Genetic structure of Golden Jackal populations
Genetic clustering analyses using STRUCTURE showed, according to the Evanno Method, that the most likely number of clusters found in the dataset is two (k=2; Annex A6). These two clusters are constituted by Europe and Asia individuals (Fig. 13). Samples from Latvia and Estonia exhibit some degree of genetic admixture between Asia and Europe, as it also happens with samples from Caucasus. However, Baltic golden jackals have a higher component of European genome while in the Caucasus individuals are more related to Asian ones. Clusters can be well defined using Structure until k=7 (Fig. 13). In this analysis the seven clusters are the following: Levant (Israel), South eastern Iran, North of Iran and Caucasus, Baltics, Dalmatia (Coastal Croatia), core range in Europe (central Europe and Greece) and Samos Island (Greece). Based on geographical coherence together with existence of historic-present records and recent distribution trends, we considered nine populations in the following analyzes, separating the core range in Europe in Central and Southern Europe, and in Asia in Caucasus and Northeast Iran.