Benchmarking the Performance of Hypervisors on Different Workloads
Devi Prasad Bhukya, Carlos Gonçalves, Diogo Gomes, Rui L. Aguiar
Instituto de Telecomunicações, Universidade de Aveiro, Aveiro, Portugal bdeviprasad@av.it.pt, cgoncalves@av.it.pt, dgomes@av.it.pt, ruilaa@ua.ptAbstract—Many organizations rely on a heterogeneous set of applications in virtual environment to deliver critical services to their customers. Different workloads utilize system resources at different levels. Depending on the resource utilization pattern some workloads may be better suited for hosting on a virtual platform. This paper discusses a framework for benchmarking the performance of Oracle database workloads, such as Online Analytical Processing (OLAP), Online Transaction Processing (OLTP), Web load and Email on two hypervisors, namely Xen and VMware. Further, Design of Experiments (DOE) is used to identify the significance of input parameters, and their overall effect on two hypervisors, which provides a quantitative and qualitative comparative analysis to customers with high degree of accuracy to choose the right hypervisor for their workload in datacenters.
Keywords—Virtualization; DOE; Full Factorial Design; Main Effect; Interaction Effect
I. INTRODUCTION
Virtualization [1][2][3] is a technology where user can run more than one operating systems on a single system side by side. Initially, computer hardware was designed to run a single operating system at a time with a single application. This leaves most machines vastly underutilized. Virtualization lets user to create more than one Virtual Machine (VM) on a single physical machine and run different operating systems in different VMs with multiple applications on the same physical computer. Each VM shares the resources of that one physical computer across multiple environments under the monitoring of a Virtual Machine Monitor (VMM) or Hypervisor [4].
Virtualization works by inserting a thin layer of software called hypervisor directly on the computer hardware or on a host operating system. The virtualization architecture [5] we are using to do this experiment is by directly inserting the hypervisor on the hardware, which is called Bare-Metal architecture. Virtualization creates a virtual version of an operating system, a server, a storage device or network resources. The areas where virtualization is used are mainly network virtualization, storage virtualization and server virtualization. Virtualization is the best option available today for maximum utilization of the system resources by sharing of application and database. This helps to reduce the number of servers, hardware devices in the data center, which not only reduces the infrastructure and maintenance costs but also, reduces power consumption. The major benefit of using a Bare-Metal architecture is the overhead of a layer can be avoided; smaller footprint of the underlying Operating System (OS) uses considerably less system resources thereby granting the hypervisor and its VMs access to more Central Processing
Unit (CPU) cycles, available memory and storage space on the hardware platform.
There are different types of virtualization, for different approaches. User has a choice to select any type of virtualization depending on his application/workload need. The main categories are Storage virtualization, Hardware virtualization, Network virtualization and Server virtualization. There are three types of virtualization techniques [6] that are mainly used i.e., Full Virtualization, Para Virtualization and Hardware Emulation.
Different workloads utilize hypervisor resources at different levels and depending on the resource utilization pattern some workloads may be better suited for hosting for particular hypervisor. This study is intended to compare how different Oracle workloads, such as Online Analytical Processing (OLAP), Online Transaction Processing (OLTP), Web Load and Email applications perform on different hypervisor environments. The rest of the work is organized as follows: Section 2 discusses about state of the art. Section 3 explains experimental procedure. Section 4 presents benchmarking analysis. Section 5 discusses about related work and Section 6 presents the conclusions.
II. STATEOFTHEART
Actually, performance of any system depends on various system and application factors. Higher performance is achieved in any system by tuning its individual system factors. Optimal values for each system tunable factor should be obtained by conducting several experimental runs and it takes a long time and blocks valuable resources such as cost, manpower and time. In traditional approach, performance benchmarking analysts are not aware of the experimental designs and analysis techniques often reaching misleading conclusions due to the following mistakes, such as: variations caused by experimental errors are not taken into account; important system parameters are not controlled; effects of different factors are not isolated; simple One-Factor-At-a-Time(OFAT) [22]designs are used; interactions among various factors are ignored; and too many experiments are conducted.
In addition, traditional performance tuning and benchmarking of hypervisor systems continues to be a tedious and time-consuming job with respect to any workloads. Since the features of upcoming hypervisor products are so complex, benchmarking needs in depth knowledge of the product and its domain. In the real world, hypervisor customers usually comes with a benchmarking requirement for their product with their competitors to software service based company and they will always go for a cost effective way of benchmarking. They also identify systems having many parameters that require careful hand tuning to get good performance.
In this work, a DOE methodology is proposed to overcome the above drawbacks and misleading conclusions of traditional approach of a hypervisors performance tuning and benchmarking experimentation.
III. EXPERIMENTALWORK
The goal is to compare two hypervisors performance in Oracle workloads. In this study, we are interested to know how the hypervisors factors interact with the oracle workload. We conducted the benchmarking of the hypervisor with test bed configuration, as shown in Figure 1. Table 1 represents the hardware and their configuration. To virtualize a system two types of hypervisors are used Xen and VMware. The two hypervisors are identified as their kernel configurations are the same.
Figure 1. Architecture of virtualizing the system. TABLE I.DESCRIPTION OF SYSTEMHARDWARE
Hardware Configuration
Processor Intel(R) Core(TM) 2 Duo CPU E7500 @ 2.93 GHz
NIC Intel PRO/1000 PT
Physical
memory 160 GB
RAM 4 GB
Since real database workloads are hard to obtain, benchmarks [7] were used as the database workloads in this research. Orion [8] is a tool for predicting the performance of an Oracle database without having to install Oracle or create a database. Orion is expressly designed for simulating Oracle database Input/output (I/O) workloads using the same I/O software stacks as in Oracle database. For each type of workload, Orion can run tests at different levels of I/O load to measure various performance metrics like Mbps, IOPS (Input Output per Second) and I/O latency. The Orion benchmarks developed by Oracle are widely accepted for testing the performance of Oracle database systems under various workloads. The Orion was installed in the VM and the application was pumped using Orion tool and its corresponding throughput (Mbps) recorded.
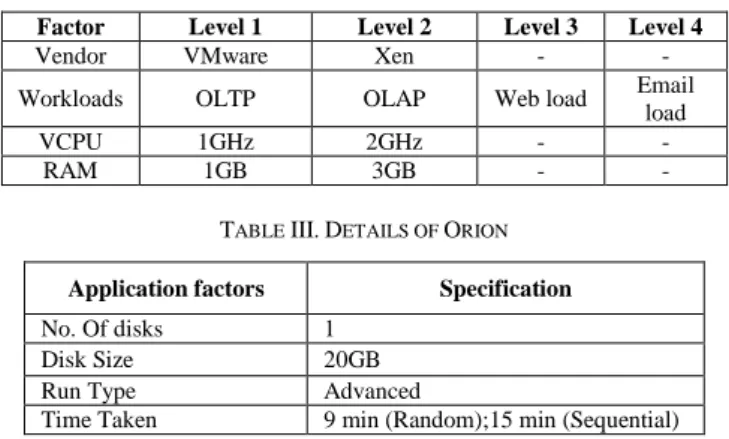
The performance of hypervisor depends on its various system factors. Each hypervisor have several factors associated with each other. Due to test lab availability and server limitation for this paper work, we have decided to take three important system factors of hypervisor with two levels and one factor with four levels at application level. These limitations are due to available servers in the present test lab. The vendors are set of two levels like Xen and VMware; Virtual CPUs
(VCPU) with two levels like 1 GHz and 2GHz; Random Access Memory (RAM) with two levels like 1 GB and 3 GB, and Workloads are set of four levels i.e., OLTP, OLAP, Web load and E-mail. Table 2 summarizes the factors and levels.
TABLE II.DESCRIPTION OF FACTORS AND THEIR LEVELS IN THE EXPERIMENT
Factor Level 1 Level 2 Level 3 Level 4
Vendor VMware Xen - -
Workloads OLTP OLAP Web load Email load
VCPU 1GHz 2GHz - -
RAM 1GB 3GB - -
TABLE III.DETAILS OF ORION
Application factors Specification
No. Of disks 1
Disk Size 20GB
Run Type Advanced
Time Taken 9 min (Random);15 min (Sequential) In this paper, the workloads are simulated by using an Orion benchmark tool with their individual read write ratio, application block size and workload type. Table 3 represents the specifications of Orion while simulating the workloads in hypervisor benchmarking. Further, benchmarking of hypervisors for various real world workloads, such as OLAP, OLTP, Web load and E-mail workload have been proposed. The workload factors and their levels are summarized in Table 4. Table 5 describes the description of the VM system configuration. In this experiment, Windows Server 2003 guest operating system used. On the guest operating system the benchmark tool Orion version 10.2.0.1.0 were installed and VM configuration have been changed as per test case.
TABLE IV.DESCRIPTION OF THE WORKLOADS PROFILE
Workload Read : Write Ratio Application block size (kb) Application type OLTP 70:30 8 Random OLAP 100:0 1024 Sequential
Web load 90:10 16 Random
Email load 50:50 4 Random
TABLE V.DETAILS VIRTUAL MACHINES
Virtual Machine Description
VCPU 1 GHz,2 GHz
RAM 1 GB, 3 GB
Operating System Windows Server 2003 Enterprise Edition (64-bit) with Service Pack 2
ORION 10.2.0.1.0
IV. BENCHMARKINGANALYSIS
To benchmark hypervisors over different workload, we used Design of Experiments (DOE), a robust statistical methodology, for optimizing the experiments. DOE [9][10] is used for performance tuning, optimization as well as screening the few vital factors to control the process. A process modeling method, DOE is defined as: A systematic and rigorous approach to engineering problem-solving that applies principles and techniques at the data collection stage so as to
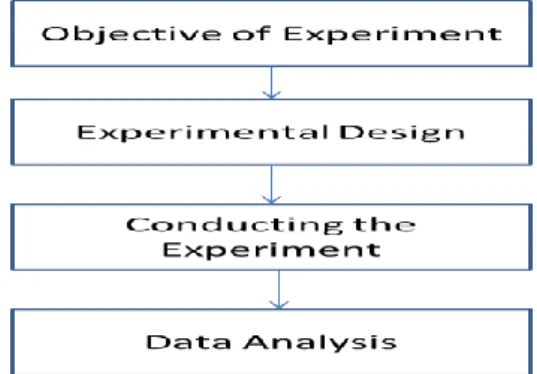
ensure the generation of valid, defensible and supportable engineering conclusions. By using the interaction analysis features of DOE, one can benchmark their products. DOE can be applied for benchmarking framework and it has systematic procedure, as shown in Figure 2. In this study, benchmarks the hypervisor are also done in four steps: 1. objective of the experiment; 2. experimental design; 3. conducting experiment; and 4. data analysis.
Figure 2. Flow chart of experiment.
Initially, we have to set the goal in the first stage of our experiment. Objective of the experiment plays an important role in any experiment as it is the area where experimenter identifies the problem and purpose of comparison; parameters of comparison; and also estimates the budget, schedule and resources for the experiment. The next step is experimental design where the experimenter will design the experiment like identifying the factors and levels, the design, the tools to be used in the experiment, etc. The design we choose in this paper is Full Factorial Design [11]. This design provides an option to conduct the runs of every combination without leaving any level of any factor. In this study, we have chosen four factors to benchmark the hypervisor and used statistical tool called Minitab [12] for DOE. The full factorial design has generated 96 test runs for this experiment. While generating test cases, the experimenter has the option of selecting techniques like replication, randomization and blocking in the experiment to reduce the experimental errors. The next stage is to conduct the experiment. In this stage the experimenter runs each test case and measuring the output using Orion tool. The experiment was carried out as per test case and the outputs were measured in MBPS. Each run were noted in the Minitab tool. Before analyzing the performance benchmarking of application workload, we need to check whether the response data is statistically sound or not in Minitab tool. The response data was tested with some prime data analyses namely, check for outlier [13], check for normality [14], check for any pattern and presence of time trend with the residuals of the response data [15]. In our experiment, we found that response data passes all above statistical test for further analyses.
A. Main Effects Study
The effect of the factor over the response is analyzed by using the main effect [16] feature of the DOE as shown in Figure 3 and it shows that performance of VMware is better when compared to Xen; performance of OLAP is better
compared to the remaining chosen workloads, such as OLTP, Web load and email; performance of VCPU 1 is better than VCPU2; and performance of RAM with 1 GB has better performance when compared to RAM with 3 GB.
Figure 3. Main effects of factors vendors, workloads, VCPUs and RAM. B. Interaction Effect
The combined effect of two or more than two different factors can be shown through DOE interaction effect [17]. The presence of interaction effect gives an idea about the impact of one factor on the level of the other factor. Figure 4 shows the interaction effect of hypervisors with workload over its throughput. It clearly reveals that VMware has better performance than Xen on most of the workloads. Eventually, the performance of OLTP workload is the same in both the hypervisors.
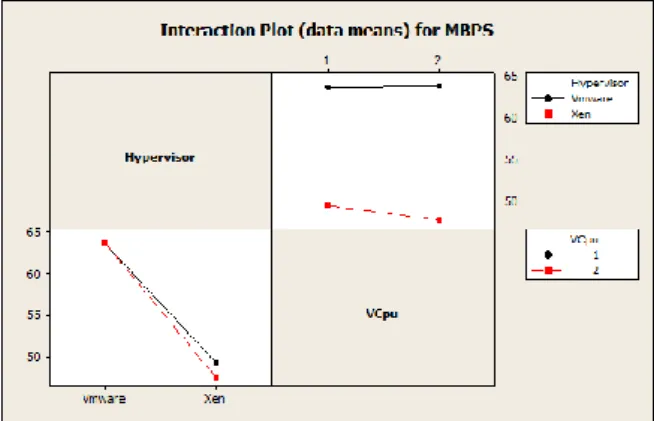
Figure 4. Interaction effects of hypervisors and workloads. Figure 5 shows the interaction effect of hypervisors and VCPU. It shows that the performance of VMware has better performance than Xen. Further, the performance of VMware is better at 2GHz VCPU than 1GHz VCPU by 0.1633%. The performance of Xen is better at 1GHz VCPU than 2GHz VCPU by 1.7539%. The overall performance of VMware is better compare to Xen while using VCPU resources in VM.
Figure 5. Interaction effect of hypervisors and VCPUs.
Figure 6 shows the interaction of hypervisors and RAM. It gives the information that the performance of VMware has better performance than Xen on both the RAM size. Although, the performance of VMware is better at 3GB RAM than 1GB RAM by 2.1991%. However, the performance of Xen is better at 1GB RAM than 3GB RAM by 3.9221%.
Figure 6. Interaction effects of hypervisor and RAM.
V. RELATEDWORK
Many researchers have considered the performance of hypervisors but few of them focused on benchmarking the hypervisor technologies with workloads. The following papers are analysed to understand about the hypervisor performance and benchmarking in the present work.
Vijay Vardhan Reddy [18] conducts different performance tests on three hypervisors namely ESXi, Xenserver and KVM under private cloud environment. The author gathered the performance metrics of the mentioned hypervisors with various benchmarks tools such as Passmark, SIGAR and Netperf. The output of the paper was indicated that ESXi server and XEN server shows impressive performance in compare to KVM.
Andrea and Riccardo [19] investigated a quantitative comparison between Xen and KVM hypervisors. Their experiments shows that CPU performance provided by Xen hypervisor is best compare to KVM while increasing number of virtual machines runs concurrently on host which was using para-virtualized approach.
Walters et al. [20] evaluated the performance of Xen, OpenVZ, VMware Server for High Performance Computing
(HPC) using OpenMP and MPI benchmark. In their experiments, it found that VMware server had worst performance compare to other hypervisors in most of the cases. In this work, they focused on HPC application performance.
Xavier et al. [21] studied the performance evaluation of container based virtualization technologies for HPC environments. They evaluated trade-off between Linux vServer, OpenVZ and Linux Containers for HPC systems. The results show that container based virtualization as alternative to HPC context when performance and isolation are required.
We believe our work is matching to the work presented in this section. We presented a framework for benchmarking the performance of Oracle database workloads, such as Online Analytical Processing (OLAP), Online Transaction Processing (OLTP), Web load and Email on two different hypervisors. We used DOE framework in our work to identify the key interaction among hypervisors and workload input factors with respect to their output. The output of the research paper may help the end users, IT industries to select the suitable hypervisor and workloads for their datacentre infrastructure requirements
VI. CONCLUSION
In this work, we have used the DOE for benchmarking the hypervisor on different oracle workloads. The outcome of the study shows that VMware outperform when compared to Xen. The experimental evaluation of hypervisors performance was done effectively by using DOE methodology. The investigating phenomena suggest that virtualizing their datacenters with Oracle database having maximum application on OLAP workload are recommended to choose VMware over to Xen. This approach also provides good product comparative analysis to customers with high degree of accuracy with good predictabilities in product improvement, product marketing and product selection.
ACKNOWLEDGEMENT
This work was supported by project Cloud Thinking (CENTRO-07-ST24-FEDER-002031), co-funded by QREN, “Mais Centro” program.
REFERENCES
[1] Smith, James E. "A unified view of virtualization." In Proceedings of the 1st ACM/USENIX international Conference on Virtual Execution Environments, pp. 1-1. ACM, 2005. [2] Kroeker, Kirk L. "The evolution of virtualization."
Communications of the ACM, pp. 18-20,52, no. 3,2009. [3] Devi Prasad Bhukya, and S Ramachandram, “Performance
Evaluation of Virtualization and Non Virtualization on Different Workloads using DOE Methodology”, IACSIT International Journal of Engineering and Technology, pp 404-408, Vol.1,No.5, 2009.
[4] Chen, Siming, Mingfa Zhu, and Limin Xiao. "Implementation of virtual time system for the distributed virtual machine monitor." In Computing, Communication, Control, and Management, 2009. CCCM 2009. ISECS International Colloquium on, pp. 571-576, vol. 4, IEEE, 2009.
[5] Wang, Jiang, Sameer Niphadkar, Angelos Stavrou, and Anup K. Ghosh. "A virtualization architecture for in-depth Kernel
isolation." In System Sciences (HICSS), 2010 43rd Hawaii International Conference on, pp. 1-10, IEEE, 2010.
[6] http://www.vmware.com/files/pdf/VMware_paravirtualization.p df
[7] Devi Prasad Bhukya, and Ramachandram S. "A Case Study of Identifying Benchmarking the Relative Performance of SAN Switches” – Proceedings of the International Conference on Software Engineering Theory and Practice (SETP-09), pp 120-127, Orlando, USA, July 13-16, 2009.
[8] www.oracle.com/technology/software/tech/orion/index.html [9] D. C. Montgomery, “The use of Statistical Process Control and
Design of Experiments in Product and Process Improvement”, IEE Transactions, 24, 5, pp. 4-17, 1992.
[10] Antony, Jiju, and Frenie Jiju Antony. "Teaching advanced statistical techniques to industrial engineers and business managers." Journal of Engineering Design pp 89-100, 9, no. 1, 1998.
[11] Mutnury, Bhyrav, Nam Pham, Moises Cases, Daniel N. De Araujo, and Greg Pitner. "Design issues in telecommunication blade systems and their resolution through design of experiments." In Electronic Components and Technology Conference, 2009. ECTC 2009. 59th, pp. 1887-1893. IEEE, 2009.
[12] MinitabInc, http://www.minitab.com/products/minitab/ [13] Belsley, David A., Edwin Kuh, and Roy E. Welsch. Regression
diagnostics: Identifying influential data and sources of collinearity. Vol. 571. John Wiley & Sons, 2005.
[14] Montgomery, and Douglas C. Design and analysis of experiments. John Wiley & Sons, 2008.
[15] Mason, Robert L., Richard F. Gunst, and James L. Hess. Statistical design and analysis of experiments: with applications to engineering and science. vol. 474. John Wiley & Sons, 2003. [16] Keppel, Geoffrey. Design and analysis: A researcher's handbook
. Prentice-Hall, Inc, 1991.
[17] Federer, Walter Theodore, "Experimental design", Experimental design. 1955.
[18] Reddy, P. Vijaya Vardhan, and Lakshmi Rajamani. "Evaluation of Different Hypervisors Performance in the Private Cloud with SIGAR Framework.", International Journal of Advanced Computer Science and Applications, 2014, pp. 60-66, vol.5, no.2
[19] Chierici, Andrea, and Riccardo Veraldi. "A quantitative comparison between xen and kvm." Journal of Physics: Conference Series., 2010, vol. 219. no. 4, IOP Publishing [20] Walters, Chaudhary, Cha, Guercio Jr., and Gallo, "A
comparison of virtualization technologies for HPC”, IEEE International Conference."Advanced Information Networking and Applications, 2008.
[21] Xavier, Marcelo, Fabio, Tiago, Timoteo, Cesar , "Performance evaluation of container-based virtualization for high performance computing environments”, IEEE Euromicro International Conference on Parallel, Distributed and Network-Based Processing (PDP), 2013
[22] Czitrom, Veronica. "One-factor-at-a-time versus designed experiments." The American Statistician, 1999, 126-131