IN VIVO QUANTIFICATION OF AREA-AT-RISK FOLLOWING
TRANSIENT ISCHEMIA IN MOUSE HEART USING
MULTI-PARAMETRIC MAGNETIC RESONANCE IMAGING
by
Ana Luísa Braga Bastos da Silva
IN VIVO QUANTIFICATION OF AREA-AT-RISK FOLLOWING
TRANSIENT ISCHEMIA IN MOUSE HEART USING
MULTI-PARAMETRIC MAGNETIC RESONANCE IMAGING
Thesis presented to Escola Superior de Biotecnologia of the Universidade Católica
Portuguesa to fulfil the requirements of Master of Science degree in Biomedical
Engineering
by
Ana Luísa Braga Bastos da Silva
Place: British Heart Foundation Experimental MR Unit, Wellcome Trust Centre for
Human Genetics, University of Oxford, Oxford, United Kingdom
Supervision: Doctor Jürgen Schneider
III
Resumo
Introdução:
Modelos de animais com doença de isquemia/reperfusão (I/R) cardíaca mimetizam o cenário clínico no qual um período de isquemia (restrição do fluxo de sangue) é seguido pelo restabelecimento do fluxo sanguíneo no miocárdio (reperfusão). Como os métodos histológicos utilizados para quantificar a área de risco (AAR) do miocárdio não são os ideais, exigindo a eutanásia precoce dos ratos, a medição da AAR, que inclui a área de necrose (AON) e o miocárdio reversivelmente afetado, é um dos principais objetivos a atingir em ressonância magnética por imagem (MRI). Deste modo, este projeto tem como objetivo quantificar a AAR utilizando a técnica não invasiva multi-paramétrica de MRI.Métodos:
Diversos ratos foram submetidos à oclusão da artéria coronária esquerda. A técnica de MRI, com um campo magnético de 9.4 Tesla, foi realizada após a injeção dos agentes de contraste gadolinium (Gd) e micro partículas de óxido de ferro (MPIO). O Gd permite avaliar o tecido necroso (AON) (Rehwald et al, 2002) e coloca-se a hipótese de que o MPIO, quando conjugado com um anticorpo específico, é capaz de localizar as moléculas de adesão vascular (VCAM-1) que se expressam nas células endoteliais depois de ocorrer inflamação (lesão de IR) (McAteer et al, 2007 & Akhtar et al, 2010). Várias experiências foram, então, realizadas em ratos saudáveis (n=6) e em ratos que foram submetidos a 30 min (n=7) e 45 min (n=5) de isquemia. Além disso, em dois dos sete ratos sujeitos aos 30 min de isquemia, o MPIO foi conjugado com um anticorpo irrelevante. Todos os ratos foram sujeitos a 24 h de reperfusão. Posteriormente, as experiências de MRI foram repetidas em ratos sujeitos a 30 min de isquemia e 16 h de reperfusão (n=2) para testar se a expressão das VCAM-1 seria mais pronunciada quando submetidos a um tempo de reperfusão mais curto. A análise quantitativa foi realizada considerando o septo ventricular e o músculo-esquelético como regiões de interesse (ROI) e utilizando diversos valores de limite.Resultados:
Após 30 min de isquemia e 24 h de reperfusão, a área de lesão reversível do miocárdio foi maior do que após 45 min de isquemia e 24 h de reperfusão. Também se verificou que, após 24 h de reperfusão, a área reversivelmente afetada foi maior no miocárdio inferior e não na zona irrigada pela artéria coronária esquerda. O MPIO conjugado com um anticorpo irrelevante não foi capaz de localizar as VCAM-1. Depois de 16 h de reperfusão obteve-se uma excelente consistência entre os resultados obtidos pela histologia e pela técnica de MRI com MPIO. Assim, a análise quantitativa provou que, após 16 h de reperfusão, todo o miocárdio era afetado. A análise dos resultados utilizando Gd comprovou que, após 24 h de reperfusão, os ratos afetados tinham a maior área de tecido não viável no miocárdio anterior, isto é, onde se desenvolve a isquemia.Conclusões:
Devido a algumas limitações do projeto, até ao momento não foi possível quantificar aAAR do miocárdio com esta técnica. No entanto, este projeto foi particularmente importante para comprovar a eficácia do MPIO no coração e para provar que 30 min de isquemia seguidos de 16 h de reperfusão é o tempo mais adequado para adquirir imagens em MRI usando o agente de contraste MPIO. Este trabalho também mostrou que o septo ventricular não permanece normal depois da lesão de IR, e que os resultados de MRI com MPIO, após 24 h de reperfusão, não são afetados pela presença do Gd, ao contrário dos resultados obtidos após 16 h de reperfusão.
V
Abstract
Background:
Animal models of cardiac ischemia/reperfusion (IR) injury mimic the clinical scenario where a period of ischemia, i.e. restriction of the blood flow, is followed by restoration of blood flow in the myocardium resulting in reperfusion injury. As histological methods used to quantify the area-at-risk (AAR) of the myocardium are not ideal, requiring mice to be euthanized in early time points, the measurement of the AAR, which includes the area-of-necrosis (AON) and the salvage myocardium, is one of the main goals to reach in cardiac magnetic resonance imaging (MRI). Therefore this project aims to quantify the AAR using non-invasive multi-parametric MRI technique.Methods:
Left coronary artery occlusion has been done in mice and MR experiments were carried out at 9.4 Tesla following the injection of gadolinium (Gd) and microparticles of iron oxide (MPIO) contrast agents. Gd allows to assess necrotic tissue (AON) (Rehwald et al, 2002) and it is hypothesized that MPIO, conjugated to a specific antibody, are able to target vascular adhesion molecules (VCAM-1) expressed in endothelial cells after inflammation (IR injury) (McAteer et al, 2007 & Akhtar et al, 2010). Several experiments were then performed in healthy mice (n=6) and in diseased mice subjected to 30 min (n=7) and 45 min (n=5) of ischemia. Additionally, in two of seven 30 min ischemic mice the MPIO contrast agent was conjugated to an irrelevant antibody. These mice were subjected to 24 h of reperfusion. Furthermore, the MR experiments were repeated in 30 min ischemic mice subjected to 16 h of reperfusion (n=2) in order to test whether VCAM-1 expression is more pronounced at shorter reperfusion times. The quantitative analysis was done considering both ventricular septum and skeletal muscle as regions of interest (ROI) and using different threshold values.Results:
After 30 min of ischemia and 24h of reperfusion the area of reversible injury in the myocardium was higher than after 45 min of ischemia and 24 h of reperfusion. Furthermore, after 24 h of reperfusion, the reversible injury was higher in inferior myocardium and not in the territory supplied by the left coronary artery. MPIO marked with an irrelevant antibody was not able to trace VCAM-1. After 16 h of reperfusion, it was obtained excellent consistency between Post-MPIO results and histology. Therefore, quantitative analysis proved that, after 16 h of reperfusion, the entire myocardium was affected. LGE (Late Gadolinium Enhanced) data analysis proved that, after 24 h of reperfusion, diseased mice had the most affected region (irreversible injury) in anterior myocardium, i.e. where the ischemia develops.Conclusions:
Due to some limitations of the project, it was not possible so far to conclusively assess the AAR of the myocardium with this technique. However, this project was particularly important to validate the MPIO contrast binding in heart and to prove that 30 min of ischemia followed by 16 h of reperfusion is a suitable time point to acquire MR images in mice using MPIO contrast agent. In addition, this work also proved that ventricular septum does not remain unaffected after IR injury and MPIO results, after 24 h of reperfusion, are not affected by the presence of the Gd, contrary to the MPIO results obtained after 16 h of reperfusion.VII
Acknowledgements
I would like to express my sincere gratitude to Dr Jurgen Schneider for being my supervisor and for his valuable help, sound advice and good teaching. I am also very grateful to him for giving me the incredible opportunity to join BMRU group at University of Oxford – Wellcome Trust Centre for Human Genetics.
I would like to thank very much to Dr Erica Dall’Armellina for all the support and precious help.
I am also extremely indebted to Dr Mahon Maguire, Ms. Vicky Thornton, Dr Kiterie Faller, Mr. Kyle Caldock, Mrs. Lee-Anne Stork and Dr Maélène Lohezic for all the support given and for having welcomed me so well in BMRU group.
I gratefully acknowledge Professor João Paulo Ferreira for supporting me during these past six months.
I expand my thanks to Professor Durval Campus Costa for his valuable help in thesis corrections.
My special thanks to my family and friends for all the motivation and enthusiasm.
Lastly, I am extremely grateful to Cristiano Amaral and to my parents, Manuel Bastos da Silva and Albertina Braga, for the incredible and unconditional support provided during all this time.
IX
Contents
Page
Resumo III Abstract V Acknowledgments VII List of figures XI List of tables XVList of abbreviations XIX
Chapter 1 – Introduction 1 1.1. Background 1 1.1.1. The basis of NMR 1 1.1.2. Physiological basis 6 1.2. Thematic framework 9 Chapter 2 – Methodology 11 2.1. Mouse model 11
2.2. Magnetic Resonance Imaging 11
2.3. Multi-parametric MR data acquisition 12
2.4. Data analysis 12 2.5. Statistical analysis 14 Chapter 3 – Results 15 3.1. MPIO Results 15 3.2. LGE Results 26 Chapter 4 – Discussion 31
Chapter 5 – Conclusions and Future Research 37
5.1. Conclusions 37 5.2. Future research 37 References 39 Annex 45 Annex A 47 Annex B 48 Annex C 52
XI
List of figures
Page
Figure 1 – Example of the relation between T1 and TR: a tissue with short T1, when TR is short, produces a larger MR signal than a tissue with long T1; when the TR is long, the signal differences between both T1 disappear.
5
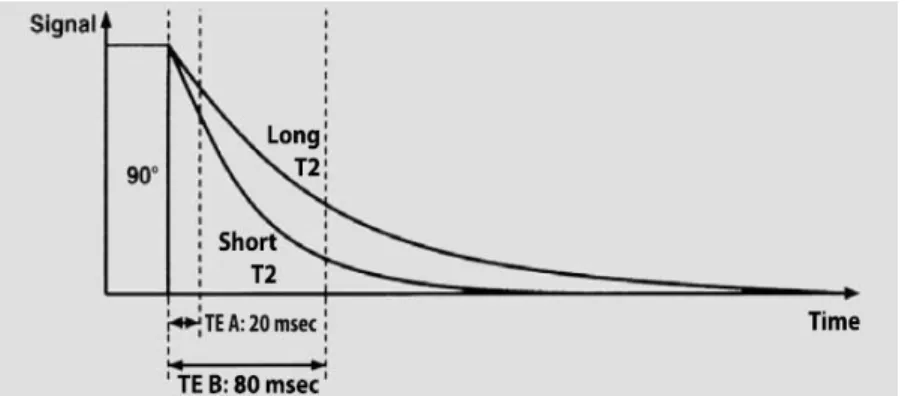
Figure 2 – Example of the relation between T2 and TE: when TE is short, there are no significant differences between T2 values; when TE is long, there are different T2 values and hence different signals.
5
Figure 3 – Image of mid-ventricular slice of IR30/24h mouse: a) 3D anatomical image of the left ventricle; b) segmentation of the endocardial and epicardial borders, septum and skeletal muscle areas; c) thresholded mask divided into six segments: 1 – Anterior septum; 2 – Inferior Septum; 3 – Inferior; 4 – Inferior Lateral; 5 – Anterior Lateral; 6 – Anterior.
14
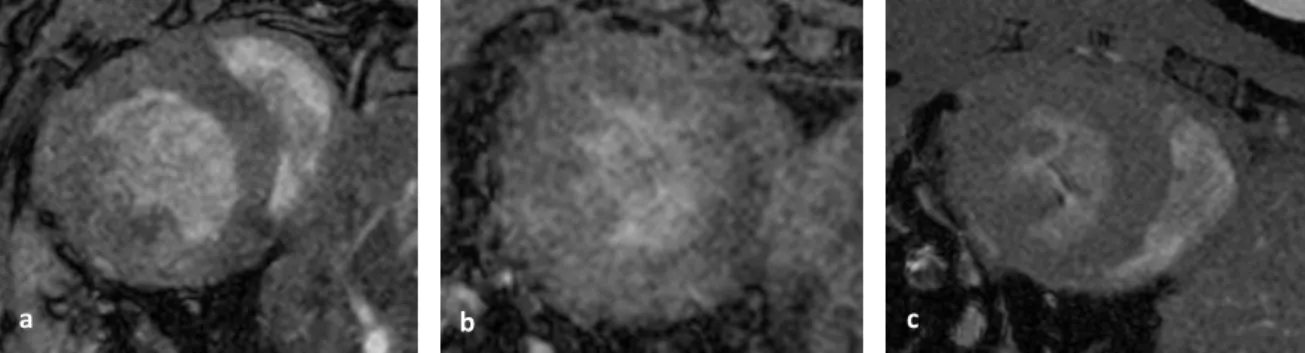
Figure 4 – Pre-MPIO mid-ventricular slice images of sham (a), IR30/24h (b) and IR45/24h (c) mice.
15
Figure 5 – Post-MPIO mid-ventricular slice images of sham (a), IR30/24h (b) and IR45/24h (c) mice and thresholded mask of sham (d), IR30/24h (e) and IR45/24h mice (f), using the threshold value of Mean(ROI)-1xSD(ROI) of the skeletal muscle ROI. The white spots in thresholded masks represent the IR injury.
15
Figure 6 – Results of percentage of affected myocardium of all mice after MPIO administration, considering skeletal muscle as ROI and using all threshold values.
17
Figure 7 – Results of percentage of affected myocardium of all mice after MPIO administration, considering septum as ROI and using all threshold values.
18
Figure 8 – Results of percentage of affected myocardium of each myocardial segment in all mice after MPIO administration, using the threshold value of Mean(ROI)-1xSD(ROI) of the skeletal muscle ROI.
19
Figure 9 – Pre-MPIO mid-ventricular slice image of one IR30/16h mouse (a) and respective thresholded mask, considering skeletal muscle as ROI and the threshold value of Mean(ROI)+0xSD(ROI) (b).
XII
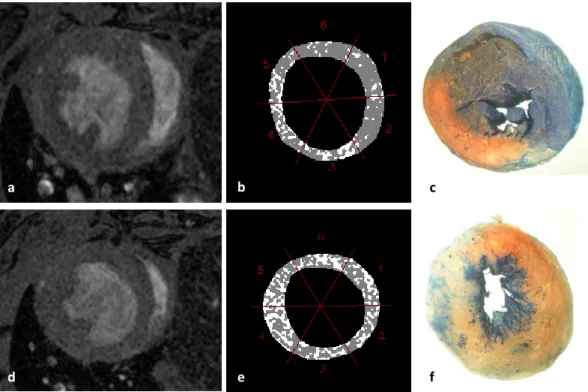
Figure 10 – Post-MPIO mid-ventricular slice images (a; d) of one IR30/16h mouse and respective thresholded masks, considering skeletal muscle as ROI and threshold value of Mean(ROI)+0xSD(ROI), (b; e) and corresponding histological images (c; f). The white spots in thresholded masks represent the IR injury.
21
Figure 11 – Pre- and Post-MPIO results of the percentage of affected myocardium in all mice, considering skeletal muscle as ROI and using the threshold value of Mean(ROI)-1xSD(ROI). Post-MPIO results were acquired over time (each scan takes approximately 15 min) and Post-MPIO_01 to Post-MPIO_05 data represent a time series.
22
Figure 12 – Pre- and Post-MPIO results of the percentage of affected myocardium of all IR30 injured mice (16 h and 24 h of reperfusion) and all sham mice, considering skeletal muscle as ROI and using the threshold value of Mean(ROI) -1xSD(ROI). Post-MPIO results were acquired over time (each scan takes approximately 15 min) and Post-MPIO_01 to Post-MPIO_05 data represent a time series.
23
Figure 13 – Pre- and Post-MPIO results of the percentage of affected myocardium in all mice, considering septum as ROI and using the threshold value of Mean(ROI) -3xSD(ROI). Post-MPIO results were acquired over time (each scan takes approximately 15 min) and Post-MPIO_01 to Post-MPIO_05 data represent a time series.
24
Figure 14 – Pre- and Post-MPIO results of the percentage of affected myocardium of all IR30 injured mice (16 h and 24 h of reperfusion) and all sham mice, considering septum as ROI and using the threshold value of Mean(ROI)-3xSD(ROI). Post-MPIO results were acquired over time (each scan takes approximately 15 min) and Post-MPIO_01 to Post-MPIO_05 data represent a time series.
24
Figure 15 – Results of percentage of affected myocardium of each myocardial segment in all mice, after MPIO administration considering the 1st time point of image acquisition, using threshold value of Mean(ROI)-1xSD(ROI) of the skeletal muscle ROI.
25
Figure 16 – LGE mid-ventricular slice images of sham (a), IR45/24h (b) and IR30/24h (c) mice and thresholded mask of sham (d), IR45/24h (e) and IR30/24h mice (f), using a threshold value of Mean(ROI)+4xSD(ROI). The white spots in thresholded masks represent the IR injury.
XIII
Figure 17 – Results of percentage of affected myocardium in all Gd injected mice, considering all threshold values.
27
Figure 18 – Results of percentage of affected myocardium of each myocardial segment in all Gd injected mice, using the threshold value of Mean(ROI)+4xSD(ROI).
29
Figure A.1 – Results of percentage of affected myocardium of all mice before and after MPIO administration, considering skeletal muscle as ROI and using the threshold value Mean(ROI)-1xSD(ROI).
47
Figure C.1 – Results of percentage of affected myocardium of one IR30/16h mouse before and after MPIO administration, considering skeletal muscle as ROI and using all threshold values.
XV
List of tables
Page
Table 1 – β values used in the data analysis of all 3D anatomical images considering different ROIs.
13
Table 2.1 – Mean and standard deviation of percentage of affected myocardium of all mice after MPIO administration, considering skeletal muscle as ROI and using all threshold values.
16
Table 2.2 – Statistical analysis of sham, IR45/24h, IR30/24h and IR30/24h_IgG mice, after MPIO administration and considering skeletal muscle as ROI.
17
Table 3.1 – Mean and standard deviation of the percentage of affected myocardium of all mice after MPIO administration, considering septum as ROI and using all threshold values.
18
Table 3.2 – Statistical analysis of sham, IR45/24h, IR30/24h and IR30/24h_IgG mice, after MPIO administration considering septum as ROI.
18
Table 4.1 – Mean and standard deviation of percentage of affected myocardium of each myocardial segment in all mice after MPIO administration, using threshold value of Mean(ROI)-1xSD(ROI) of the skeletal muscle ROI.
19
Table 4.2 – Statistical analysis of myocardial segments of IR30/24h mice, after MPIO administration and considering threshold value of Mean(ROI)-1xSD(ROI).
20
Table 5.1 – Percentage of affected myocardium in each myocardial segment of all mice, after MPIO administration considering the 1st time point of images acquisition. It was used the threshold value of Mean(ROI)-1xSD(ROI) and the skeletal muscle as ROI.
25
Table 5.2 – Statistical analysis of myocardial segments of both IR30/16h mice, considering threshold value of Mean(ROI)-1xSD(ROI).
26
Table 6.1 – Mean and standard deviation of the percentage of affected myocardium of all Gd injected mice, considering all threshold values.
27
Table 6.2 – Statistical analysis of sham, IR45/24h, IR30/24h and IR30/24h_IgG mice after Gd administration.
XVI
Table 7.1 – Mean and standard deviation of percentage of affected myocardium of each myocardial segment in all Gd injected mice, using threshold value of Mean(ROI)+4xSD(ROI).
28
Table 7.2 – Statistical analysis of myocardial segments of IR45/24h mice injected with Gd, considering threshold value of Mean(ROI)+4xSD(ROI).
29
Table 7.3 – Statistical analysis of myocardial segments of sham mice injected with Gd, considering threshold value of Mean(ROI)+4xSD(ROI).
29
Table A.1 – Mean and standard deviation of the percentage of affected myocardium of all mice, before and after MPIO administration, considering skeletal muscle as ROI and using threshold value of Mean(ROI)-1xSD(ROI).
47
Table A.2 – Statistical analysis of sham, IR45/24h, IR30/24h and IR30/24h_IgG mice, before MPIO administration and considering skeletal muscle as ROI.
47
Table B.1 – Percentage of affected myocardium of all mice, after MPIO administration in each time point, considering the skeletal muscle as ROI and using the threshold value of Mean(ROI)-1xSD(ROI).
48
Table B.2 – Percentage of affected myocardium of all mice, before MPIO administration, considering the skeletal muscle as ROI and using the threshold value of Mean(ROI)-1xSD(ROI).
49
Table B.3 – Mean and standard deviation of the percentage of affected myocardium of all IR injured mice and all sham mice, after MPIO administration in each time point, considering skeletal muscle as ROI and using the threshold value of Mean(ROI)-1xSD(ROI).
49
Table B.4 – Mean and standard deviation of the percentage of affected myocardium of all IR injured mice and all sham mice, before MPIO administration, considering skeletal muscle as ROI and using the threshold value of Mean(ROI)-1xSD(ROI).
49
Table B.5 – Percentage of affected myocardium of all mice, after MPIO administration in each time point, considering the septum as ROI and using the threshold value of Mean(ROI)-3xSD(ROI).
XVII
Table B.6 – Percentage of affected myocardium of all mice, before MPIO administration, considering the septum as ROI and using the threshold value of Mean(ROI)-3xSD(ROI).
50
Table B.7 – Mean and standard deviation of the percentage of affected myocardium of all IR injured mice and all sham mice, after MPIO administration in each time point, considering septum as ROI and using the threshold value of Mean(ROI) -3xSD(ROI).
51
Table B.8 – Mean and standard deviation of the percentage of affected myocardium of all IR injured mice and all sham mice, before MPIO administration, considering septum as ROI and using the threshold value Mean(ROI)-3xSD(ROI).
51
Table C.1 – Percentage of affected myocardium of one IR30/16h mouse, before and after MPIO administration, considering skeletal muscle as ROI and using all threshold values.
XIX
List of abbreviations
AAR
Area-at-Risk
AON
Area-of-Necrosis
A-V
Atrium-Ventricular
B
0Static Magnetic Field
BMRU
British Heart Foundation MR Unit
ECG
Electrocardiogram
e.m.f
Electromotive force
FID
Free Induction Decay
Gd
Gadolinium
IDL
Interactive Data Language
IR
Ischemia-Reperfusion
IR30/16
Ischemia-Reperfusion injury with 30 min of Ischemia and 16h of Reperfusion
IR30/24
Ischemia-Reperfusion injury with 30 min of Ischemia and 24h of Reperfusion
IR30/24_IgG
Ischemia-Reperfusion injury with 30 min of Ischemia and 24h of Reperfusion
and MPIO marked with IgG antibody
IR45/24
Ischemia-Reperfusion injury with 45 min of Ischemia and 24h of Reperfusion
LAD
Left Anterior Descending
LGE
Late Gadolinium Enhanced
LV
Left Ventricle
MPIO
Micro Particles of Iron Oxide
MR
Magnetic Resonance
MRI
Magnetic Resonance Imaging
MRS
Magnetic Resonance Spectroscopy
M
xyTransverse Magnetization
M
zLongitudinal Magnetization
NMR
Nuclear Magnetic Resonance
RF
Radiofrequency
ROI
Region-of-Interest
RV
Right Ventricle
SPECT
Single-Photon Emission Computed Tomography
SNR
Signal-to-Noise Ratio
TE
Echo Time
XX
In vivo Quantification of Area-at-Risk Following Transient Ischemia in Mouse Heart Using Multi-parametric Magnetic Resonance Imaging
1
Chapter 1
Introduction
1.1. Background
1.1.1. The basis of NMR
The Nuclear Magnetic Resonance (NMR) technique is commonly used as a non-invasive means to provide anatomical and functional information of tissue and organs. Since the early 1970s, the NMR technique has been used on humans, and quickly became a powerful diagnostic tool (Gadian, 1995; Prasad & Storey, 2008).
In these recent years, the NMR technique has been significantly developed and can be divided into magnetic resonance imaging (MRI) and magnetic resonance spectroscopy (MRS) (Schaeffter & Dahnke, 2008). Whilst MRS is used for the detection of metabolites resulting in a spectrum, MRI of water is based on the detection of signals from hydrogen nuclei (protons) (Gadian, 1995) and provides 3D information of the human body through the image without ionizing radiation (Schneider et al., 2006).
Several references of literature describe the complex NMR technique. Therefore, fundamental concepts of NMR will be summarized following based on some authors: Gadian (1995), Prasad & Storey (2008), Schaeffter & Dahnke (2008), Weishaupt et al. (2006) and Ridgway (2010).
The NMR is based on magnetic properties of certain atomic nuclei, e.g. hydrogen (1H), phosphorus (13P) or carbon (13C). These nuclei have a magnetic property known as spin, which can be described in a simplified and classic picture as the spinning motion of the nucleus about its own axis. Thus, the spinning nucleus produces a magnetic moment (µ), i.e. a physical vector quantity expressing the strength and direction of the magnetic field surrounding the nucleus.
When a static magnetic field (B0) is applied to these randomly oriented spins, the nuclear magnets align along the field and precess around the axis, defined by B0, with an angular frequency. This frequency is called the Larmor frequency. In fact, the spins can align in one of two orientations, spin up or spin down, corresponding, respectively, to low and high energy levels, being the energy difference between these states proportional to the magnitude of the B0. As a consequence of this alignment, slightly more spins will align parallel to the B0 direction – the orientation of lower energy – resulting in macroscopic magnetization of the sample, i.e. longitudinal magnetization (Mz).
In order to induce the resonance of the nuclei, an additional oscillating magnetic field is applied, allowing the nuclei transitions between the two energy states. In fact, the oscillating field is a radiofrequency (RF) magnetic field that perturbs the magnetization of the sample, flipping the
In vivo Quantification of Area-at-Risk Following Transient Ischemia in Mouse Heart Using Multi-parametric Magnetic Resonance Imaging
2
longitudinal magnetization to an arbitrary angle (flip angle) with respect to the B0, resulting in transverse magnetization (Mxy).
In addition to the B0 and RF field, MRI technique requires magnetic field gradients to localize and encode MR signals in order to produce an image. The magnetic field gradients superpose B0 and vary linearly with position. In MRI, the localization is achieved by slice selection, phase encoding and frequency encoding.
The first gradient magnetic field to be applied, at the same time as the RF pulse is transmitted, limits the resonance frequency of the nuclei to a slice of the image.
Following slice selection, a second gradient field is applied in order to change the proton frequency, which leads to an alteration on the relative phase of the protons. The phase is expressed by an angle and it refers to the position of a magnetic moment on its circular path. When two spins have a phase difference of 0°, it means they are in phase. On the other hand, when a gradient is applied, two nuclei with different resonance frequencies are phase shifted from each other by a certain angle (dephasing). Gradient fields cause these phase shifts as a function of the position of the spins, forming the basis of phase encoding process in MRI.
After phase encoding, the third gradient magnetic field is applied at the same time as the signal is measured, causing the rotation of the protons at different frequencies according to their position in the gradient magnetic field – frequency encoding process. Hence, as long as there are selected gradient fields in each direction, the nuclei spatial location is recovered and 3D spatial information can be obtained (General Electric Company, 1981).
The transverse magnetization induces an electromotive force (e.m.f) in the receiver coil which is subsequently amplified and processed to give an identifiable NMR signal. The e.m.f induced electric signal is referred to as free induction decay (FID). Fourier Transformation is the mathematical tool used to transform a time-independent signal into its equivalent frequency components, creating an image or spectrum. Contrary to the NMR signal that can be generated as a FID, for anatomic imaging and tissue characterization, the MRI signal is commonly detected and measured in form of an echo (gradient echo sequences), due to the additional dephasing caused by the gradient magnetic fields (Karamitsos et al., 2009). These gradient magnetic fields cause the decrease of the FID signal amplitude, which rapidly decays with a constant time T2* (see below).
The detected NMR signal is always degraded by noise. The signal-to noise ratio (SNR) expresses the relationship between the signal and the amount of (image) noise. Mathematically, the SNR is the quotient between the signal intensity, measured in area of interest, and the standard deviation of the signal, in a region outside the imaged area. The signal and therefore the SNR increases with a higher magnetic field.
The main units that basically constitute a NMR instrument are: the magnet, the gradient system, the transmitter, the receiver and the computer. The capability of a NMR instrument depends fundamentally on the magnitude and homogeneity of the B0, which isgenerated by the magnet. The homogeneity of the static magnetic field can be adjusted and improved by shim coils. The MRI relies on magnetic gradient fields: the gradient system consists of three coils and corresponding amplifiers. The transmitter generates RF pulses, which are applied to the sample/ tissue via an RF coil. The
In vivo Quantification of Area-at-Risk Following Transient Ischemia in Mouse Heart Using Multi-parametric Magnetic Resonance Imaging
3
same or additional RF coils can be used to detect the NMR signal. Lastly, the computer has several functions, e.g. control the experiment, accumulate the data, process and display the data.
Magnetic Resonance Imaging - Relaxation Processes
As mentioned previously, following the magnetization of the sample and its perturbation, the rotation of magnetization in the xy-plane (Mxy) occurs. Is this transverse magnetization that gives rise to the MRI signal in the receiver coil. However, the signal rapidly becomes weaker, due to relaxation processes that reduce the transverse magnetization over time, causing the return of the spins to equilibrium. The relaxations processes are characterized by two time constants, designated T1 and T2.
The spin-lattice relaxation time T1, or longitudinal relaxation, corresponds to the recovery of the magnetization along the B0 direction (Mz). In other words, the T1 time is the time necessary for the excited spins recover and be available for the next excitation. This spin-lattice relaxation process is characterized by energy dissipation of the nuclear spins to their surroundings while the nucleus returns to its lowest energy state and is, once again, oriented along the magnetic field.
On the other hand, the spin-spin relaxation time T2, or transverse relaxation, is related to the decay of magnetization in the perpendicular direction of B0 (Mxy). The T2 time determines how quickly a signal fades after excitation. In contrast with spin-lattice relaxation, the spin-spin relaxation process is characterized by energy exchanges between nuclear spins, and not with the lattice. The nuclear spins interaction will cause some nuclei to speed up, others to speed down, leading to the decay of the transverse magnetization. The nuclei return then to the equilibrium.
Depending on the constant time T1, the Mz may have or not recovered at the time the next RF pulse is applied. If the excitation occurs before the complete recover of the Mz, which may happen when the constant time T1 is long, the signal will be attenuated. The time interval between two successive excitations is the repetition time (TR).
The time constant T1 depends on the strength of the field B0 and the internal motion of the molecules. As a matter of fact, the molecular mobility of water is one of the responsible for relaxation times T1 and T2. Indeed, the slow motion only contributes to relaxation time T1 and whenever mobility of water increases, T2 also tends to increase.
T1 and T2 relaxation processes occur simultaneously, becoming clear that T2 can be affected by T1 and, consequently, T2 cannot be longer than T1 (Price et al., 2011).
If the magnetic field were ideally homogeneous, i.e. if all nuclei experience exactly the same magnetic field, the transverse decay constant would be equal to T2. However in reality the magnetic field has always some degree of inhomogeneity. Therefore, in practice, the inhomogeneity also contributes to dephasing, resulting in signal decay that is much faster than the process described for T2 relaxation. The time constant of decay T2*, which is always shorter than T2, takes this effect into consideration (General Electric Company, s.d.).
The relaxation times can be measured with FID, as well as, with several other methods. In fact, these measurements are important in order to select the most suitable RF pulse interval, to know
In vivo Quantification of Area-at-Risk Following Transient Ischemia in Mouse Heart Using Multi-parametric Magnetic Resonance Imaging
4
the T1 and T2 dependent effects on signal intensities, to understand the differences between T1 and T2 and to provide tissue characterization.
Magnetic Resonance Imaging – Contrast Mechanisms
MRI technique is capable of measuring many contrast mechanisms. The intrinsic contrast in MRI is mostly generated by proton density and relaxation times T1 and T2. Moreover, specific MR sequences, i.e. combinations of RF pulses and sequence timings, are commonly used to generate contrast in MR images (Karamitsos et al., 2009; McAteer et al., 2007; Schneider et al., 2006; Prasad et al., 2004).
The proton density, i.e. the number of excitable spins per unit volume, represents the maximum signal that can be obtained from tissue. However, it is important to mention that if the signal value was simply proportional to nuclear density, then anatomical contrast would be poor (General Electric Company, s.d.).
Images with contrast based on relaxation times T1 and T2 are called T1– and T2–weighted images or T2*-weighted image. Indeed, these images might provide an excellent means of distinguishing tissues and visualizing pathologies, as proton density and T1 and T2 relaxation times vary from one tissue to another and between normal and diseased tissue (Karamitsos et al., 2009).
T1 contrast is strongly related to TR. As presented in the example of Figure 1, in the case of long TR, more excited spins return to their stable state and regains the Mz, and hence a good signal can be collected – the signal differences for long and short T1 are imperceptible. When short TR is selected, the image contrast is very affected by T1 relaxation time.
For short TR’s, the images with short T1 are bright, with a strong signal, whereas the images with long T1 are dark, with a weak signal.
Similar to T1, the T2 contrast is also dependent of a time interval: echo time (TE). The echo time is the interval between application of the excitation pulse and collection of the MRI signal. The Figure 2 demonstrates an example of the relation between T2 contrast and TE. When the TE is short, the signal differences between tissues are small because at the echo time collection only a little signal has decayed. When TE is long, all nuclei have decayed resulting in the collection of different signals. In this case, images with short T2 are dark whereas images with long T2 are bright, producing a strong signal.However, this situation is not applied to T2*.
In vivo Quantification of Area-at-Risk Following Transient Ischemia in Mouse Heart Using Multi-parametric Magnetic Resonance Imaging
5
Figure 1 – Example of the relation between T1 and TR: a tissue with short T1, when TR is short, produces a larger
MR signal than a tissue with long T1; when the TR is long, the signal differences between both T1 disappear
(Weishaupt et al, 2006).
Figure 2 – Example of the relation between T2 and TE: when TE is short, there are no significant differences
between T2 values; when TE is long, there are different T2 values and hence different signals (Weishaupt et al,
2006).
Despite the intrinsic contrast of MRI images depict tissue changes, contrast agents have been used in order to have a greater degree of specificity and to enhance the differences between tissues (Karamitsos et al., 2009). MR contrast agents basically modify the magnetic properties of protons in their vicinity, changing the properties of the tissue and hence its T1 and T2 values. Contrast agents have paramagnetic properties, i.e. contain unpaired electrons (Dall’Armellina et al., 2010).
Gadolinium chelate Gd-DTPA is a widely used T1 contrast agent in MRI, i.e. it shortens the T1 of the protons. After injection, and in presence of injured tissue, gadolinium chelate contrast agent leaves the vascular compartment and enters the interstitial space. This does not enter in intact cells due to gadolinium large molecular size (Wassmuth & Schulz-Menger, 2011). Using gadolinium contrast agent, the damaged tissue is visualized as a white region in the image – T1 weighted images.
In addition, other contrast agents commonly used in cellular imaging and tracking are based on iron oxide. The specificity of each contrast agent can be achieved by conjugating particles of iron oxide to antibodies. Microparticles of iron oxide (MPIO) has been particularly used in MRI due to its effects on local magnetic field homogeneity and therefore on detectable contrast. Plus, the size of the MPIO allows these particles to retain specificity for molecular targets (McAteer et al., 2007). For
In vivo Quantification of Area-at-Risk Following Transient Ischemia in Mouse Heart Using Multi-parametric Magnetic Resonance Imaging
6
instance, this contrast agent is able to target the vascular cell adhesion molecules (VCAM-1), which are up-regulated in the presence of diseased tissue.
Magnetic Resonance Imaging – Image Acquisition
MRI is an important diagnostic technique also widely used in cardiac medicine. This technique is capable to assess cardiac anatomy and function, enabling the tissue characterization, the distinction between healthy and diseased myocardium and the assessment of contractile function, myocardial injury and myocardial viability. (Dall’Armellina et al., 2010)
The image of the (human’s) heart has to be acquired in a phase of no or little motion of the ventricles. This requires either very fast imaging sequences or the acquisition of the MRI signals over multiple heart beats. This is possible owing to cardiac synchronization where the pulse sequence is synchronized and the signal is acquired in a particular time point in the cardiac cycle. Cardiac synchronization is achieved by using an Electrocardiogram (ECG).
The mouse heart beats are about 10 times faster than in humans, and the length of the cardiac cycle is normally 100-150 ms compared to approximately 1 s in humans (Schneider & Neubauer, 2006). In mice, the phase with minimal cardiac motion, i.e. the diastolic phase, is about 30-40 ms long. Contrary to clinical MR scanners (1.5-3 T), research animal MR systems typically have static magnetic field strengths of 4.7-17.6 T. High magnetic fields are required for cardiac experiments in mice as the necessary spatial and temporal resolution are achieved with the increase in SNR. In order to obtain maximal SNR, specific RF coils, optimized in geometry for the animal size, and the homogeneity of the RF field are used. The monitoring of the mouse inside the magnet is possible using ECG and respiratory signals, which can also be used to synchronized the MR experiments with the cardiac cycle and thus to minimize the influence of cardiac and respiratory motion on MR experiments (Karamitsos & Neubauer, s.d.; Schneider & Neubauer, 2006).
1.1.2. Physiological basis
The adult heart lies obliquely in the mediastinum with its base directed to the atria, in the posterior and superior parts of the heart, and its apex directed to the ventricles, in the anterior and inferior portions of the heart (Seeley et al., 2003).
Three layers compose the heart: the epicardium, the myocardium and the endocardium. The epicardium is a thin membrane that constitutes the outside surface of the heart. The myocardium is composed of cardiac muscle cells and it is responsible for the contractile motion of the heart. Inside the heart, the layer that covers all the heart chambers is the endocardium (Seeley et al., 2003). The left ventricular wall is approximately three times thicker (thickness range from 6 to 16 mm) than the right ventricular wall (Opie, 2004). Contrary to the right ventricle (RV) that has a complex crescent shape, the left ventricle (LV) has a well known ellipsoid shape.
In vivo Quantification of Area-at-Risk Following Transient Ischemia in Mouse Heart Using Multi-parametric Magnetic Resonance Imaging
7
that causes blood to flow through the arteries. The RV of the heart pumps the blood through pulmonary circulation and its LV pumps the blood through systemic circulation. Four valves regulate the blood flow through the heart: atrium-ventricular valves (A-V valves), i.e. tricuspid and mitral valves, which regulate blood flow between atrium and ventricle in the right and left sides of the heart, respectively; pulmonary valve that controls blood flow from the RV into the pulmonary arteries and aortic valve that regulates the blood flow from LV into aorta. To hold A-V valves, each ventricle contains cone-shaped muscles called papillary muscles (Seeley et al., 2003).
The contraction of cardiac muscle is called systole and its relaxation is called diastole. The cardiac cycle therefore consists of repetitive pumping process that begins with the onset of the systole and ends with the beginning of the next systole. Cardiac muscle contractions cause pressure changes within the heart chambers, i.e. atria and ventricles, and the blood moves from areas of higher pressure to areas of lower pressure (Seeley et al., 2003). Regarding this, it is worth pointing out that MR images are acquired during the passive ventricular filling, when there is no movement of the ventricles, i.e. when ventricular pressure is lower than atrium pressure, the A-V valve opens and the blood flows passively into the ventricle.
Nowadays, cardiac IR experiments are being performed in surgically modified mice, which became the animal models of choice because of their genetic malleability, rapid breeding cycle and economic husbandry (Bohl et al., 2009).
Since a primary goal of mice research is its application to human physiology and disease, it is important to understand the limitation in which mouse heart differs from human’s heart. The most important differences in cardiac structure in humans and mice are confined to the atrium and venous parts. The ventricular structure is similar in hearts of mice and humans (Doevendans et al., 1998). Moreover, although there are many differences in cardiovascular physiology in humans and mice, the main difference is undoubtedly the physical size of the heart (Tarnavski et al., 2004; Doevendans et al., 1998).
Myocardial ischemia is a common occurrence in patients with acute coronary syndrome.
Ischemia – the restriction of blood flow owing to artery obstruction – activates inflammatory pathways, including the up regulation of vascular adhesion molecules (VCAM-1) that persist on the vascular endothelial surface even after long ischemia periods. In addition, with cessation of the blood flow, several biochemical alterations happen in cells due to the lack of oxygen and the reduction in cellular energy. The aerobic metabolism of myocardial cells and the maintenance of high-energy stores are essentials for normal myocardial function (Akhtar et al., 2010; Boyle et al., 1996; Bowden et al., 2002; Dall’Armellina et al., 2010; Kerrigan & Scotland, 1993; Nahrendorf et al., 2008).
Dall’Armellina (2010) stated that during ischemia, as time progresses, the ischemic myocardial injury affects the sub-endocardium, and then the epicardium, until it becomes transmural, i.e. the ischemic injury extends through the wall of the ventricle.After long period of ischemia, the myocardium possesses a region of edema, which is the salvage myocardium, and necrotic tissue. The region of irreversible injury, i.e. area-of-necrosis, if left untreated, will expand in the next hours. Furthermore, in
In vivo Quantification of Area-at-Risk Following Transient Ischemia in Mouse Heart Using Multi-parametric Magnetic Resonance Imaging
8
acute ischemia, the ischemic tissue results in necrosis and the region of reversible injury is minimal (Bowden et al., 2002; Boyle et al, 1997; Carden & Granger, 2000; Collard & Gelman, 2001; Hassan & Tillmanns, 2010).
After reperfusion, i.e. restoration of blood flow, a variety of microvascular alterations occur, such as endothelial swelling and an increase of capillary permeability (Kerrigan & Scotland, 1993). Therefore, although the restoration of blood flow is essential, reperfusion may enhance tissue injury.
In vivo Quantification of Area-at-Risk Following Transient Ischemia in Mouse Heart Using Multi-parametric Magnetic Resonance Imaging
9
1.2. Thematic framework
Medicine, more and more, requires the development of different techniques and interventions aimed at reducing and preventing diseases. Myocardial dysfunction is one of the most common cardiac diseases and it is associated with significant morbidity and mortality. Its diagnostic using a non-invasive method is therefore important and MRI technique has been considered the best choice (Karamitsos et al., 2009; Prasad & Storey, 2008).
In order to reduce myocardial ischemia and reperfusion injury, clinically or in research, it would be of interest to use a global method capable of quantifying and assessing all physiological and biological cardiac parameters at just one time-point, instead of submitting the patient to a multiple tests. As MRI provides several important measurements of structure, function, and cellular and molecular events in mouse models of cardiovascular disease, the British heart foundation MR unit (BMRU) has been trying to develop a non-invasive, more sensitive and comprehensive technique that aims to achieve that goal, providing a complete study of the IR injury of the myocardium. For that, several MRI techniques have been used: cine-imaging is used for an accurate assessment of global cardiac function, i.e. volume and mass of the LV (Rajappan et al., 2000; Prasad et al., 2004); phase contrast cine-data allows assessment of regional cardiac function, i.e. myocardium velocities (Myerson et al., 2011; Prasad & Storey, 2008; Prasad et al., 2004); T1-mapping is used to quantify the injury and assess perfusion (Kober et al., 2004); T2-mapping aims to measure the increase in tissue water content (edema); Late Gadolinium Enhanced (LGE) data is used to assess the area-of-necrosis (AON) of the myocardium; and Pre- and Post-MPIO data assess MPIO contrast binding and specificity and evaluate the area-at-risk (AAR) of the myocardium.
Bohl (2009) stated that after IR injury the myocardial infarction is variable indicating three myocardial subsets: 1) the unaffected myocardium (remote myocardium); 2) the AAR, i.e. myocardium that was initially subjected to ischemia – affected myocardium, and 3) the AON, which is the non-viable tissue within the AAR. Therefore, this project is involved in this enormous and audacious study and it aims to test whether or not multi-parametric MRI can be used to assess and quantify the AAR of the myocardium in mouse heart. The assessment of the AAR is particularly important when attempting to appraise patients with previous infarction or those with multivessel disease (Hassan & Tillmanns, 2010).
Clinically, the AAR of the human myocardium can be measured on SPECT (Pereztol-Valdés et al., 2004) by injection of a technetium-based tracer before opening the occluded vessel. However, this method requires the injection of a radioactive isotope and scanning with a gamma-camera, which is invasive to the patient (Carlsson et al., 2009; Hassan & Tillmanns, 2010). T2-weighted Imaging has also been used clinically at 1.5 Tesla (T) magnetic field. Nevertheless, the image contrast is not very pronounced at high fields (9.4T) and hence it cannot be applied on research (Carlsson et al., 2009; Wright et al., 2009; Hassan & Tillmanns, 2010).
Although the AON can be assessed with MRI using Gd as contrast agent (Rehwald et al, 2002), on research the AAR is only appraised by ex vivo histological methods (Bohl et al, 2009), which
In vivo Quantification of Area-at-Risk Following Transient Ischemia in Mouse Heart Using Multi-parametric Magnetic Resonance Imaging
10
present some disadvantages, e.g. there is no residual tissue for further biochemical analysis and measurements require mice to be euthanized, which mean that serial studies are not possible in the same animal.
Therefore, the purpose of this project is to overcome the undesirable histological approach using the non-invasive MRI technique to assess the AAR of the myocardium. MR experiments were performed after the injection of the Gd (to assess the AON) and MPIO (to assess the living myocardium) contrast agents in mice, because, previously at BMRU, MPIO was successfully tested in brain and kidneys with IR injury(McAteer et al, 2007 & Akhtar et al, 2010). When conjugated to a specific antibody, MPIO is able to target vascular adhesion molecules (VCAM-1) that showed to be up-regulated in presence of IR injury. In fact, VCAM-1 expression is a dynamic process depending on the severity of the disease as VCAM-1 and its ligand α4β1 integrin mediate leukocyte recruitment and inflammation (Akhtar et al., 2010).
Although treatments of myocardial ischemia are aimed to restore blood flow, it has been demonstrated that the restoration of the blood flow after a period of ischemia exacerbate the damage to the myocardium (ischemia-reperfusion injury) (Parks & Granger, 1986). The mechanisms of which are not fully understood.
Considering these facts, the aims of this project are 1) to test the feasibility of the MPIO contrast binding in heart, as MPIO may improve the differentiation between normal and diseased myocardium (Kemp et al., 2010); 2) to test whether VCAM-1 expression is more pronounced at shorter reperfusion times than 24 h, which was the time point considered in some scientific papers (Luo et al, 2011; Arslan et al, 2009); and 3) to quantify the AAR of the myocardium using MRI technique.
In vivo Quantification of Area-at-Risk Following Transient Ischemia in Mouse Heart Using Multi-parametric Magnetic Resonance Imaging
11
Chapter 2
Methodology
2.1. Mouse model
MRI experiments were performed on adult C57BL/6 mice obtained from a commercial breeder (Harlan UK) with a weight ranging between 15 and 35 g.
In a first step, three different groups of mice were subjected to MRI experiments with the simultaneous injection of the MPIO and Gd contrast agents: IR30/24h mice – 30 min of ischemia followed by 24 h of reperfusion (n=7); IR45/24h mice – 45 min of ischemia followed by 24h of reperfusion (n=5); and sham operated mice used as control group (n=4). Moreover, in two of seven IR30/24h mice, the MPIO contrast agent was conjugated to an irrelevant antibody (IgG antibody) – IR30/24h_IgG mice.
In a second stage of the project, the protocol was changed: mice were injected with only MPIO contrast agent. Three groups of mice were then subjected to MRI experiments: IR30/16h mice – 30 min of ischemia followed by 16 h of reperfusion (n=2); IR30/24h mice – 30 min of ischemia followed by 24 h of reperfusion (n=2); and sham operated mice used as control group (n=2). At this stage, the post-MPIO data were acquired over time, considering five time points: 10 min; 20 min; 30 min; 40 min; up to 1 hour, with exception of one IR30/16h mouse in which the first time point was not considered.
In this study, the MRI system, all animal and surgical procedures, the image acquisition and the data analysis were performed in the same way.
IR operation in mice aims to create transient ischemia of the left ventricle by occlusion of left anterior descending (LAD) coronary artery. Mouse cardiac surgery to induce ischemia with subsequent reperfusion was performed as described by Tarnavski et al (2004).
2.2. Magnetic Resonance Imaging
Mice were kept under controlled conditions for temperature, humidity and light. Anesthesia was induced in an anesthetic chamber using 4% isoflurane in 100% oxygen. Animals were then positioned in a purpose-built mouse holder, secured in position with surgical tape and maintained at 1.5%-2% isoflurane at 2l/min oxygen flow via nose cone throughout the MRI experiments. The temperature (37oC) was maintained with a blanket that was heated by air.
To obtain the ECG, two needle electrodes were inserted subcutaneously in the front paws. A pressure-transducer for respiratory gating was attached to the animal’s abdomen. The biosignals were
In vivo Quantification of Area-at-Risk Following Transient Ischemia in Mouse Heart Using Multi-parametric Magnetic Resonance Imaging
12
processed and displayed using an in-house-built gating device. Heat therapy and subcutaneous saline were provided to help recovery.
Experiments were carried out on a horizontal bore 9.4 Tesla MR system (Varian) comprising a gradient system (1000 mT/m, inner diameter 60 mm) and a 33mm quadrature driven birdcage resonator, used to transmit and receive the magnetic resonance signals.
2.3. Multi-parametric MR data acquisition
The MR experiments were made following intravenous or intraperitoneal injection of contrast agents – Gd and MPIO.
For this project various images were acquired:
Late Gadolinium Enhanced data (3D) – images acquired after LGE-based contrast agent administration;
Post-MPIO (3D) – images acquired after MPIO-based contrast agent administration; Pre-MPIO (3D) – images acquired before MPIO-based contrast agent administration;
2.4. Data analysis
The data analysis was performed in a purpose written software tool bmru_XPARAM developed in IDL (Interactive Data Language).
The standard imaging plane is perpendicular to the long axis (base – apex) and is called short axis.
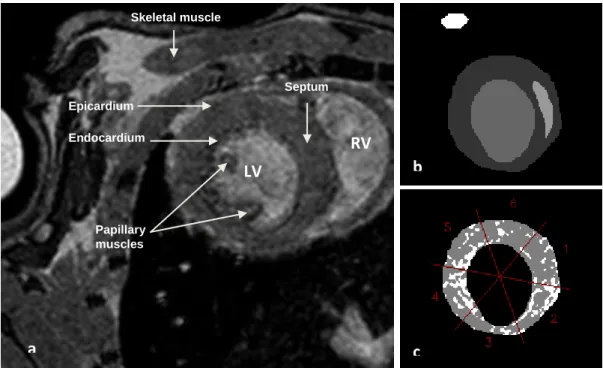
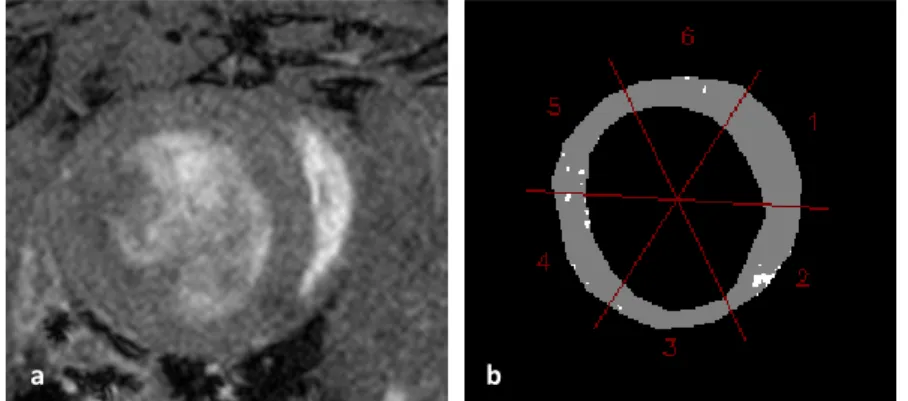
In all data sets of 3D anatomical images, i.e. Pre- and Post-MPIO images and LGE images, the segmentation was applied to the whole heart, slice by slice, from base to apex. The segmentation of the images consists on the manual trace of the epicardial and endocardial borders of the LV. A reference region of interest (ROI) to facilitate thresholding was placed in ventricular septum of the heart and in skeletal muscle (Figure 3). The segmentation of the images was performed excluding the papillary muscles, which are seen as dark spots inside the bright ventricular cavity, and the suture region, i.e. dark region in the anterior wall. The segmentation of the diastolic images started on the base slices of the heart.
After the segmentation, in each slice of the data set, the myocardium was divided into six segments: anterior septum, inferior septum, inferior, inferior lateral, anterior lateral and anterior (Figure 3), in accordance with the segment model used by the operator.
From this phase on, the thresholding process of the images was possible (Figure 3) and the number of voxels of normal and affected myocardium, as well as, the percentage of normal and affected myocardium were obtained for whole heart and each myocardial segment.
In vivo Quantification of Area-at-Risk Following Transient Ischemia in Mouse Heart Using Multi-parametric Magnetic Resonance Imaging
13
The threshold of all the segmented images was calculated as the following expression:
Threshold = Mean (ROI) + β. Standard Deviation (ROI) (1) β being a integer factor.
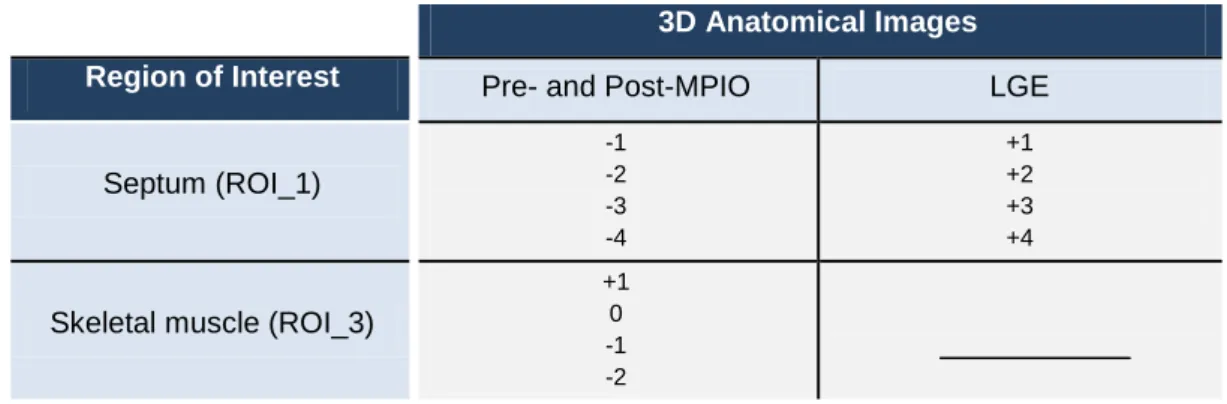
The threshold analysis was done considering both ROIs, i.e. the septum and skeletal muscle surfaces, and it was different for MPIO and LGE images (Table 1). Furthermore, in MPIO data sets the number of low-intensity voxels was obtained below the threshold values, and in LGE data sets the number of high-intensity voxels was obtained above the threshold values.
The number of voxels was quantified using bmru_XPARAM software.
Table 1 – β values used in the data analysis of all 3D anatomical images considering different ROIs.
After data analysis, the percentage of affected myocardium was analyzed in all mice, comparing the results of the entire heart and myocardial segments, considering all threshold values and both reference structures septum and skeletal muscle.
In a second stage of this project, the segmentation of the images of all mice was done only for the first time point when the images were acquired. As, in Post-MPIO, mice were kept in the same position during MR experiments over time, the segmented mask obtained for the first time point was used in the data analysis of the remaining time points.
Threshold values
3D Anatomical Images Region of Interest Pre- and Post-MPIO LGE
Septum (ROI_1) -1 -2 -3 -4 +1 +2 +3 +4
Skeletal muscle (ROI_3)
+1 0 -1 -2
In vivo Quantification of Area-at-Risk Following Transient Ischemia in Mouse Heart Using Multi-parametric Magnetic Resonance Imaging
14
Figure 3 – Image of mid-ventricular slice of IR30/24h mouse: a) 3D anatomical image of the left ventricle; b) segmentation of the endocardial and epicardial borders, septum and skeletal muscle areas; c) thresholded mask divided into six segments: 1 – Anterior septum; 2 – Inferior Septum; 3 – Inferior; 4 – Inferior Lateral; 5 – Anterior Lateral; 6 – Anterior.
2.5. Statistical analysis
All statistical analysis was evaluated using software SPSS 17 for windows.
In this study, the use of parametric tests was not possible due to small sample sizes. Therefore, the statistical analysis was performed using the non-parametric test of Kruskal Wallis, which compares more than two independent samples.
Regarding the percentage of affected myocardium, the statistical analysis was performed in order to test if there are significant differences between sham, IR45/24h, IR30/24h and IR30/24h_IgG mice.
The results were considered statistically significant for a p-value (p) of less than 0.05, i.e. the null hypothesis was rejected when p-value (p) was less than 0.05.
Papillary muscles
a
)
)
)
b
)
)
)
c
)
)
)
Skeletal muscle Septum Epicardium EndocardiumLV
RV
In vivo Quantification of Area-at-Risk Following Transient Ischemia in Mouse Heart Using Multi-parametric Magnetic Resonance Imaging
15
Chapter 3
Results
3.1. MPIO Results
MR experiments were performed in sham operated and diseased mice which were subjected to 30 min and 45 min of ischemia and 24 h of reperfusion, as suggested by literature.
Comparing Pre-MPIO images (Figure 4) with Post-MPIO images (Figure 5) of sham, IR30/24h and IR45/24h mice, there was marked improvement of the tissue contrast, particularly between blood and myocardium, after MPIO administration.
Figure 4 – Pre-MPIO mid-ventricular slice images of sham (a), IR30/24h (b) and IR45/24h (c) mice.
Figure 5 – Post-MPIO mid-ventricular slice images of sham (a), IR30/24h (b) and IR45/24h (c) mice and
thresholded mask of sham (d), IR30/24h (e) and IR45/24h mice (f), using the threshold value of Mean(ROI) -1xSD(ROI) of the skeletal muscle ROI. The white spots in thresholded masks represent the IR injury.
a b c
b c
a
In vivo Quantification of Area-at-Risk Following Transient Ischemia in Mouse Heart Using Multi-parametric Magnetic Resonance Imaging
16
A qualitative analysis demonstrated that sham mice did not show any signal of injured myocardium (Figure 5a) and the voxels (white spots) presented in the thresholded mask (Figure 5d) were caused by nonspecific retention of the iron beads. After 30 min of ischemia and 24 h of reperfusion, there was MPIO around the endocardium showing the area of affected myocardium (Figures 5b and 5d). On the other hand, after 45 min of ischemia and 24 h of reperfusion the area of affected myocardium was smaller.
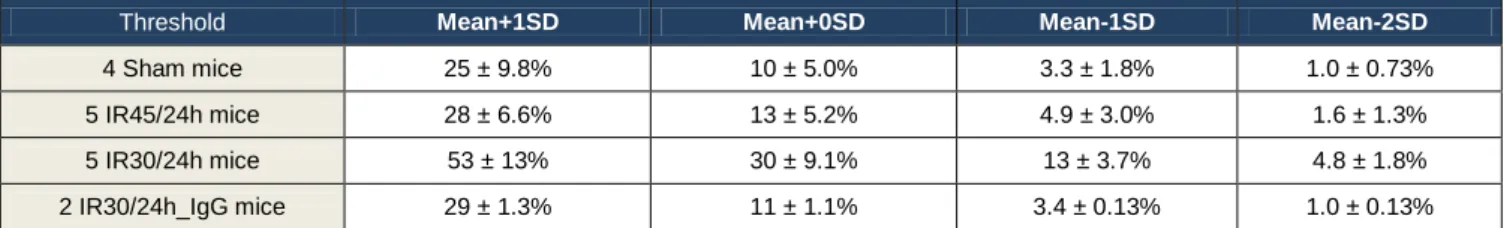
Table 2.1 and Figure 6 show the percentage of affected myocardium of all mice after MPIO administration considering skeletal muscle as ROI and using all threshold values.
A quantitative analysis, for various threshold values, proved that the area of affected myocardium was larger after 30 min of ischemia and 24 h of reperfusion than after 45 min of ischemia and 24 h of reperfusion (Figure 6). As MR experiments were also performed in IR30 min mice in which MPIO was conjugated to an irrelevant antibody (IR30/24_IgG mice), this study also proved that MPIO is only able to target VCAM-1 when conjugated to a specific antibody, i.e. the results showed that the area of affected myocardium in IR30/24h_IgG mice was small (Figure 6). Statistically significant differences were found between sham, IR30/24h, IR45/24h and IR30/24h_IgG mice groups with p<0.05 (Table 2.2).
Table 2.1 – Mean and standard deviation of percentage of affected myocardium of all mice after MPIO administration, considering skeletal muscle as ROI and using all threshold values.
Threshold Mean+1SD Mean+0SD Mean-1SD Mean-2SD
4 Sham mice 25 ± 9.8% 10 ± 5.0% 3.3 ± 1.8% 1.0 ± 0.73%
5 IR45/24h mice 28 ± 6.6% 13 ± 5.2% 4.9 ± 3.0% 1.6 ± 1.3%
5 IR30/24h mice 53 ± 13% 30 ± 9.1% 13 ± 3.7% 4.8 ± 1.8%
In vivo Quantification of Area-at-Risk Following Transient Ischemia in Mouse Heart Using Multi-parametric Magnetic Resonance Imaging
17
Figure 6 – Results of percentage of affected myocardium of all mice after MPIO administration, considering skeletal muscle as ROI and using all threshold values.
Table 2.2 – Statistical analysis of sham, IR45/24h, IR30/24h and IR30/24h_IgG mice, after MPIO administration and considering skeletal muscle as ROI.
Chi-square (ϰ2 ) Degrees of freedom P value Mean+1SD 8.8 3 0.032 Mean+0SD 9.4 3 0.025 Mean-1SD 9.9 3 0.019 Mean-2SD 8.6 3 0.035
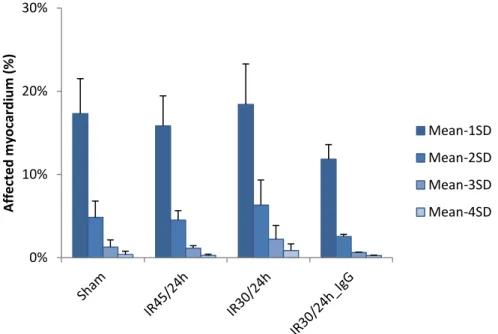
Table 3.1 and Figure 7 show the results of the percentage of affected myocardium of all mice, after MPIO administration, considering septum as ROI and using all threshold values.
The data analysis was also performed considering septum as a reference structure and the results showed that septum did not remain unaffected after IR injury (Figure 7). Importantly, sham operated mice yield false positive results apparently showing a significant number of voxels below the threshold indicating MPIO presence. Furthermore, there were no statistically significant differences between different mice groups (p>0.05) (Table 3.2).
0% 10% 20% 30% 40% 50% 60% 70% A ff e cte d m yo car d iu m ( % ) Mean+1SD Mean+0SD Mean-1SD Mean-2SD
In vivo Quantification of Area-at-Risk Following Transient Ischemia in Mouse Heart Using Multi-parametric Magnetic Resonance Imaging
18
Table 3.1 – Mean and standard deviation of the percentage of affected myocardium of all mice after MPIO administration, considering septum as ROI and using all threshold values.
Figure 7 – Results of percentage of affected myocardium of all mice after MPIO administration, considering septum as ROI and using all threshold values.
Table 3.2 – Statistical analysis of sham, IR45/24h, IR30/24h and IR30/24h_IgG mice, after MPIO administration and considering septum as ROI.
The Pre-MPIO data sets were also analyzed (Table A.1 and Figure A.1 in Annex A) showing a high percentage of affected myocardium in sham mice. However, in Pre-MPIO data, statistically significant differences were not found between sham, IR45/24h, IR30/24h and IR30/24h_IgG mice (p>0.05) (Table A.2 in Annex A).
0% 10% 20% 30% A ff e cte d m yo car d iu m ( % ) Mean-1SD Mean-2SD Mean-3SD Mean-4SD
Threshold Mean-1SD Mean-2SD Mean-3SD Mean-4SD
4 Sham mice 17 ± 4.2% 4.8 ± 2.0% 1.3 ± 0.87% 0.37 ± 0.40% 5 IR45/24h mice 16 ± 3.6% 4.5 ± 1.1% 1.1 ± 0.31% 0.28 ± 0.13% 5 IR30/24h mice 18 ± 4.9% 6.3 ± 3.0% 2.2 ± 1.7% 0.86 ± 0.80% 2 IR30/24h_IgG mice 12 ± 1.8% 2.5 ± 0.3% 0.62 ± 0.040% 0.24 ± 0.060% Chi-square (ϰ2) Degrees of freedom P value Mean-1SD 3.5 3 0.32 Mean-2SD 5.7 3 0.13 Mean-3SD 2.7 3 0.44 Mean-4SD 1.1 3 0.79
In vivo Quantification of Area-at-Risk Following Transient Ischemia in Mouse Heart Using Multi-parametric Magnetic Resonance Imaging
19
In order to better understand and investigate the MPIO binding and the area of the damaged myocardium, hearts were analyzed on a segment by segment basis.
Table 4.1 and Figure 8 show the results obtained for myocardial segments of all mice, using the threshold value of -1xSD(ROI) below the mean and considering skeletal muscle as ROI. Table 4.2 shows the statistical analysis done for mice group with highest percentage of affected myocardium (IR30/24h) and considering the threshold value of Mean(ROI)-1xSD(ROI).
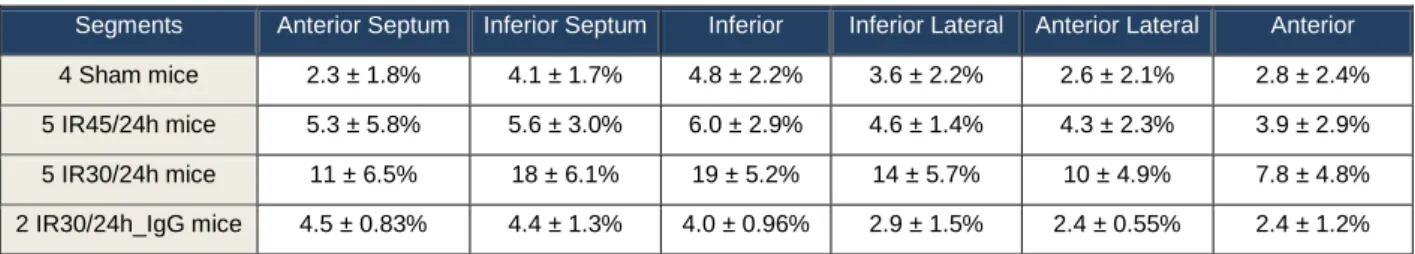
After 24 h of reperfusion, the most affected segments of the myocardium were inferior septum and the inferior and not the territory supplied by the left coronary artery (Figure 8). Statistically significant differences were found between myocardial segments with p<0.05 (Table 4.2).
Table 4.1 – Mean and standard deviation of percentage of affected myocardium of each myocardial segment in all mice after MPIO administration, using the threshold value of Mean(ROI)-1xSD(ROI) of the skeletal muscle ROI.
Figure 8 – Results of percentage of affected myocardium of each myocardial segment in all mice after MPIO administration, using the threshold value of Mean(ROI)-1xSD(ROI)of the skeletal muscle ROI.
0% 10% 20% 30%
Sham IR45/24h IR30/24h IR30/24h_IgG
A ff e cte d m yo car d iu m ( % ) Anterior Septum Inferior Septum Inferior Inferior Lateral Anterior Lateral Anterior
Segments Anterior Septum Inferior Septum Inferior Inferior Lateral Anterior Lateral Anterior
4 Sham mice 2.3 ± 1.8% 4.1 ± 1.7% 4.8 ± 2.2% 3.6 ± 2.2% 2.6 ± 2.1% 2.8 ± 2.4% 5 IR45/24h mice 5.3 ± 5.8% 5.6 ± 3.0% 6.0 ± 2.9% 4.6 ± 1.4% 4.3 ± 2.3% 3.9 ± 2.9% 5 IR30/24h mice 11 ± 6.5% 18 ± 6.1% 19 ± 5.2% 14 ± 5.7% 10 ± 4.9% 7.8 ± 4.8% 2 IR30/24h_IgG mice 4.5 ± 0.83% 4.4 ± 1.3% 4.0 ± 0.96% 2.9 ± 1.5% 2.4 ± 0.55% 2.4 ± 1.2%