Sección Especial / Special Section: V Workshop on Lidar Measurements in Latin America
Atmospheric particulate matter fractions measured at Camagüey,
Cuba. Preliminary results
Mediciones de las fracciones de material particulado atmosférico en
Camagüey, Cuba. Resultados preliminares
Boris Barja
(1,*), Juan Carlos Antuña
(1), Rene Estevan
(1), Sandra Mogo
(2,S), Elena Montilla
(3),
Victoria E. Cachorro
(3,S), Angel de Frutos
(3,S)1. Grupo de Óptica Atmosférica de Camagüey, Centro Meteorológico de Camagüey, Camagüey, Cuba. 2. Departamento de Física, Universidade da Beira Interior, Portugal. 3. Grupo de Óptica Atmosférica, Universidad de Valladolid, Spain. (*) Email: bbarja@cmw.insmet.cu S: miembro de SEDOPTICA / SEDOPTICA member Recibido / Received: 16/11/2010. Versión revisada / revised versión: 28/03/2011. Aceptado / Accepted: 29/03/2011 ABSTRACT:
Gravimetric measurements of the particulate matter fractions PM10 and PM1, conducted at Camagüey, Cuba are reported. Samples were collected with a low volume particulate impactor Dekati PM10 two times a week, between February and October 2008. Sampling was conducted both under the local background conditions and in the presence of the Saharan dust events. The mean values of particulate matter concentrations were 28.4 µg/m3 and 14.6 µg/m3 for PM10 and PM1, respectively. The maximum/minimum concentrations of particulate matter measured for PM10 and PM1 were 73.3 µg/m3 / 13.1 µg/m3 and 33.4 µg/m3 / 4.9 µg/m3, respectively. An analysis of the eight major inorganic species (Na+, K+, Ca2+, Mg2+, NH4+, Cl–, NO3– and SO4 2–) in aerosol samples using ionic chromatography was conducted. An aerosol classification was developed depending on the air masses origins, wind velocity and direction at the measured site. The air masses origins were determined using backward trajectories derived from the HYSPLIT model.
Key words: PM10, Aerosols.
RESUMEN:
Se reportan las medidas gravimétricas de las fracciones de material particulado PM10 y PM1realizadas en Camagüey, Cuba. Las muestras fueron colectadas con un impactador de partículas de bajo volumen Dekati PM10, dos veces a la semana entre Febrero y Octubre del 2008. El muestreo se realizó tanto en condiciones de fondo local como en la presencia de eventos de polvo del Sahara. Los valores medios de concentración de material particulado resultaron 28.4 µg/m3 y 14.6 µg/m3 para PM10 y PM1, respectivamente. Los valores máximos/mínimos de concentración de material particulado medidos para PM10 y PM1 fueron de 73.3 µg/m3/13.1 µg/m3 y 33.4 µg/m3/4.9 µg/m3, respectivamente. Se realizó un análisis de las ocho especies inorgánicas importantes (Na+, K+, Ca2+, Mg2+, NH4+, Cl–, NO3– y SO4 2–) en las partículas de aerosol presentes en las muestras, a partir de cromatografía iónica. Se desarrolló una clasificación de los aerosoles en dependencia del origen de las masas de aire, dirección y velocidad del viento en el sitio de medición. El origen de las masas de aire fue determinado utilizando las trayectorias inversas obtenidas con el modelo HYSPLIT.
REFERENCES AND LINKS
[1] J. Haywood, O. Boucher, “Estimates of the direct and indirect radiative forcing due to tropospheric aerosols: A review”, Rev. Geophys. 38, 513‐543 (2000).
[2] IPCC, 2007. Climate Change. The Physical Science Basis. Contribution of Working Group I to the Fourth Assessment Report of the Intergovernmental Panel on Climate Change, S. Solomon, D. Qin, M. Manning, Z. Chen, M. Marquis, K.B. Averyt, M. Tignor and H.L. Miller, Edts., Cambridge University Press, Cambridge, United Kingdom and New York, NY, USA (2007).
[3] C. Pope, R. Burnett, M. Thun, E. Calle, D. Krewski, K. Ito, G. Thurston,. “Lung cancer, cardiopulmonary mortality, and long‐term exposure to fine particulate air pollution”, J. Amer. Med. Assoc. 287, 1132– 1141 (2002).
[4] S. S. Park, Y. J. Kim, “Source contributions to fine particulate matter in an urban atmosphere”,
Chemosphere 59, 217–226 (2005).
[5] R. J. Charlson, J. M. Hales, R. D. Cess, J. A. Coakley, J. E. Hansen, D. J. Hofmann, “Climate forcing by anthropogenic aerosols”, Science 255, 423–430 (1992).
[6] S. Chandra, S. Satheest, J. Srinivasan, “Can the state of mixing of black carbon aerosols explain the mistery of ‘excess’ atmospheric absorption?”, Geophys. Res. Lett. 31, L19109 (2004).
[7] J. M. Prospero, “Saharan dust transport over the north Atlantic Ocean and Mediterranean: An Overview”, in The Impact of Desert Dust from Northern Africa Across the Mediterranean, S. Guerzoni and R. Chester, Edts., pp. 133‐151, Kluwer Academic Publishers, The Netherlands (1996).
[8] J. P. Díaz, F. J. Expósito, C. J. Torres, F. Herrera, J. M. Prospero, M. C. Romero, “Radiative properties of aerosols in Saharan dust outbreaks using ground‐based and satellite data: Applications to radiative forcing”, J. Geophys. Res. 106, 18403‐18416 (2001).
[9] J. M. Prospero, I. Olmez, M. Ames, “Al and Fe in PM 2.5 and PM 10 suspended particles in South‐ Central Florida: The impact of the long range transport of African mineral dust”, Water Air Soil Poll.
125, 291‐317 (2001).
[10] J. M. Prospero, E. Bonatti, C. Schubert, T. N. Carlson, “Dust in the Caribbean atmosphere traced to an African dust storm”, Earth Planet. Sc. Lett. 9, 287‐293 (1970).
[11] J. M. Prospero, “Long‐term measurements of the transport of African mineral dust to the southeastern United States: Implications for regional air quality”, J. Geophys. Res. 104, 15917‐15927 (1999).
[12] J. R. Herman, P. K. Bhartia, O. Torres, C. Hsu, C. Seftor, E. Celarier, “Global distribution of UV‐absorbing aerosols from Nimbus7/ TOMS data”, J Geophys. Res. 201, 16911‐16922 (1999).
[13] I. Chiapello, C. Moulin, J. M. Prospero, “Understanding the long‐term variability of African dust transport across the Atlantic as recorded in both Barbados surface concentrations and large‐scale Total Ozone Mapping Spectrometer (TOMS) optical thickness”, J. Geophys. Res. 110, D18S10 (2005). [14] E. Mojena López, P. Ortíz Bultó, A. Ortega Gózales, A. Rivero Valencia, “Tormentas de polvo del
Sahara. Su impacto en el Atlántico, Mar Caribe y el Golfo de México”, Rev. Cub. Meteorol. 13, 95‐101 (2005).
[15] O. Cuesta‐Santos, A. Wallo Vázquez, A. Collazo Aranda, P. Sánchez, Navarro, M. González González, R. Labrador Montero, “Aspectos de la composición química del aire en la zona de la ribera este de la Bahía de La Habana”, Rev. Cub. Meteorol. 9, 90‐99 (2002).
[16] E. Molina Esquivel, L. A. Brown Colás, V. Prieto Díaz, M. Bonet Gorbea, L. Cuéllar Luna, “Crisis de asma y enfermedades respiratorias agudas, contaminantes atmosféricos y variables meteorológicas en Centro Habana”, Rev Cub. Med. Gen. Integr. 17, 10‐20 (2001). [17] M. V. Karyampudi, S. P. Palm, J. A. Reagen, H. Fang, W. B. Grant, R. M. Hoff, C. Moulin, H. F. Pierce, O. Torres, E. V. Browell, S. H. Melfi, “Validation of the Saharan dust plume conceptual model using lidar, Meteosat, and ECMWF data”, B. Am. Meteorol. Soc. 80, 1045‐1075 ( 1999). [18] S. Mogo, V. E. Cachorro, M. Sorribas, A. M. de Frutos, “Optical properties of atmospheric PM fractions related with air masses in the central Iberian Peninsula”, Opt. Pura Apl. 39, 331‐340 (2006). [19] HYSPLIT model at NOAA ARL website http://www.arl.noaa.gov/ready/ (October 2009).
[20] J. M. Prospero, “The chemical and physical properties of marine aerosols: An introduction”, in Chemistry of Marine Water and Sediments, A. Gianguzza, E. Pellizzetti and S. Sammarano, Edts., pp. 35‐ 82, Springer‐Verlag Berlin, Heidelberg (2002). [21] X. Li‐Jones, J. M. Prospero, “Variations in the size distribution of non‐sea‐salt sulfate aerosol in marine boundary layer at Barbados: Impact of African dust”, J. Geophys. Res. 103, 16073‐16084 (1998).
1. Introduction
Atmospheric aerosols play an important role in the climate. It is well known that aerosols affect directly the climate because of their effects on the solar and atmospheric radiation [1]. But the knowledge for determining aerosols net effect on climate is still considered at a medium‐low level of scientific understanding [2]. Aerosols can behave as a cooling or warming factor, depending on the process that predominates, light absorption or scattering. Also, they can affect the climate indirectly by modifying cloud physical and radiative properties influencing clouds lifetime and precipitation processes [2]. Also the atmospheric aerosols affect the air quality, and in turn the human health [3]. By these reasons atmospheric aerosols studies have increased over the years.
Atmospheric particulate matter (PM) aerosols represent a complex mixture of organic and inorganic substances. Depending on its origin, the aerosols are classified as anthropogenic and natural. The first one is a main component of atmospheric pollution and is responsible for the lack of the visibility in urban centers [4]. They are produced by the human activities such as industries, agriculture, emission from the automobile traffic, etc. They have in general the greatest impact on the climate near the surface [5,6]. The naturals are generated by natural phenomena such as the dust from dessert lifted up to the atmosphere by convection, volcanoes, evaporation of sea spray, pollen grains, plant and insect parts, etc. An example of natural source of PM is the Saharan dust [7] and their effect on the radiation and clouds far away from their origins [8,9].
Particulate in the atmosphere is a mixture of solid, liquid or solid and liquid particles suspended in the air. Those particles vary in size, composition and origin. The particle could be mixed with other particles or forming a core‐ shell structure. These different states can change the optical properties of the particles [6].
It is convenient to classify particles by their aerodynamic properties for several reasons. Particles aerodynamic properties are related with its transport and removal from the atmosphere. The aerodynamic properties of the particles also determine its deposition within the respiratory system and also are associated with the particles chemical composition and sources. These properties are conveniently summarized by the aerodynamic diameter that is the size of a unit density sphere with the same aerodynamic characteristics. Particles are sampled and described based in their aerodynamic diameter, usually called simply the particle size. The PM consists in general of two main fractions: coarse particles and fine particles. For measurement purposes the boundary between these two fractions of particles usually lies between 1 μm and 2.5 μm in aerodynamic diameter (PM1 and PM2.5, respectively).
It is well known that the geometrical, microphysical, chemical and optical properties of the aerosols are determinant in their interaction with the radiation. The scattering and absorption of the solar and terrestrial radiation is related with the particles size, elemental composition and altitude in the atmosphere. The greater aerosols fall to the surface near the emission source, because of gravitational settling, with a short life time in the atmosphere. The smaller ones remain in the atmosphere for longer time been transported long distances from the source.
The aerosols characteristics have a high spatial and temporal variability. It is important to characterize the aerosols properties in different sites of the earth in order to evaluate these properties in a global way. There are numerous reports about the aerosols measurements at surface in the Caribbean. The principal results have been reported by the group of Professor Joseph M. Prospero at the University of Miami [e.g. 7‐11]. These studies are related mainly with the arrival to the Caribbean
and southeast of the United State of the Saharan dust layer [12,13]. In Cuba the studies of the aerosols begin in the 1970´s decade when the satellite technique was available by first time [14]. There are several studies about the total suspended particles in the atmosphere in some locations of Havana province, near industrial sources [15,16]. This report shows the values of gaseous pollutants, total suspended particles and their chemical composition. Its results show the contribution of the sea and anthropogenic aerosols.
This work reports the gravimetric measurements of the particulate matter fractions PM10 and PM1 at the Camagüey Meteorological station site, Cuba. Samples were collected with a low volume particulate impactor Dekati PM 10 two times a week, during the period from February to October 2008. The determination of the particulate matter concentration and of the eight major inorganic species was conducted. An aerosol classification was developed depending on the air masses origins and direction at the site of measurement. The air masses origins were determined using backward trajectories analysis. Two days case studies are described. The first one is the higher mass concentration value in the dataset. The second one is an example day of the Saharan dust intrusion.
2. Experimental: Sampling location,
methods and dataset
The particles were collected in the Meteorological Station of Camagüey, Cuba (21.42º N, 77.85º W, 122 m asl). The station is outside the Camagüey city, at 7 km in the northeast direction, besides the road to Nuevitas city. Camagüey is a medium size town, with about 325000 inhabitants, located in the central‐ east region of Cuba. There are two seasons that dominate the region, rainy (May to October) and little rainy (November to April), with mean temperatures (and relative humidity) values of 27ºC (76.7% ) and 23.8ºC (74.5%), respectively. At Camagüey Meteorological station the average of the monthly accumulative precipitation (and the average of the number of rainy days) varies from 169 mm (79 days) in the rainy period to 51
mm (38 days), in the little rainy period. The average of the annual accumulate is 1309 mm while the annual average of the number of rainy days is 115. The predominant wind direction is from de northeast and east. The location receives also influences of different air masses origins such as the polar, cold and dry air from the North American continent; tropical, warm and moist air from the Caribbean Sea; and the air from the Atlantic Ocean. The last one has two principal directions, from the northeast corresponding with trades winds and from the east – southeast. The Saharan desert dust intrusion in Cuba is related with eastern air mass direction. The 90% of the days in July for the country are reported with dust. Dusty day frequency values are higher than 40% for the period from April to August [14]. Saharan dust is commonly carried in a layer extended from the surface to roughly 3 km over the western Atlantic [17].
The sampling site is in between a roadway and the landing strip of the “Ignacio Agramonte” Airport. The distance of the site to both roads is near 100 m. The collecting instrument, particle impactor, was located in the meteorological station ceiling. There is no high automobile and airplane traffic in the roads. A smaller town is located near the site, 1.0 km in the northeastern direction.
The particle was collected with a Dekati PM10 impactor. The flow rate through the impactor was a constant value of 16.5 l/min during 24 h of measurement. The particles were collected over polycarbonate membrane filters with 0.2 µm pores. The impactor has three stages with the thermodynamic cutoff diameter of 1 m and 10 m. These three stages allow the separation of three PM fractions in the ranges < 1 m (fine mode), 1 m to 10 m (coarse mode) and > 10 m. The filters were weighed before and after collection, in order to obtain the PM mass deposited, based in the gravimetric method. Before the process of weighting the filters remained during 24 h with stable room ambient conditions (temperature 20ºC 5ºC and relative humidity 20% 5%). Care was taken to eliminate electrostatic charges from them. The daily mean concentration of PM is determined dividing the PM mass between the air volumes
passing through the impactor. The PM concentration dataset consist of 65 days, with a frequency of two measurements per week from February to October 2008.
After the gravimetric determinations a set of the filters was selected for evaluating the concentration of the most important ions. The filters were treated with deionized water and the soluble matter ultrasonically extracted. Samples were placed in the ultrasound bath for half an hour. Levels of Cl‐, NO3‐, SO42‐, Mg2+, Ca2+, K+, Na+ and NH4+ were determined by means of ionic chromatography with conductometric detection [18].
The predominant wind direction during the 24 hours of measurement is determined using measurements of the automatic meteorological station. The air masses backward trajectories were computed using the HYSPLIT (HYbrid Single‐Particle Lagrangian Integrated Trajectory) Model which was accessed through the NOAA ARL web site. The calculations were performed for three altitude levels (500 m, 1500 m, and 3000 m) at 14:00 GMT, with a time of calculation backward of 120 hours each day, using reanalysis data [19].
3. Results and discussions
3.1. Mass and chemical concentrations
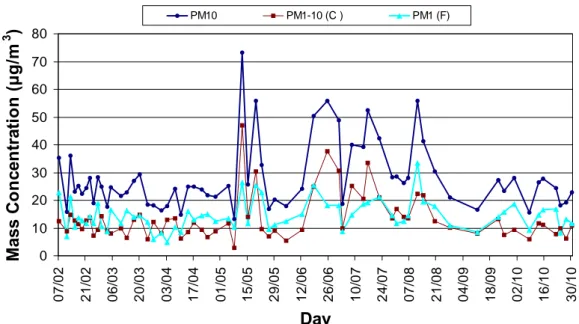
Figure 1 shows time series of the daily mean mass concentration of PM1 (particles with diameter less than 1 m, PM1‐10 (particles with diameter between 1 m and 10 m) and PM10 (the sum of PM1 and PM1‐10). The measurement period from February to October 2008 includes all the months for the rainy period and three months for little rainy period. The mean daily PM10 concentration show higher values in the months of the rainy period with some days showing PM10 concentration values above 50 g/m3. This peaks occurrence extent from May to August the period time of the Saharan dust arrival to the Caribbean.
Figure 1 depicts the monthly and hourly frequencies of clear sky conditions at Camagüey for the period 1984 to 2007.
These results are in agreement with other reports in the literature for the Caribbean region and the south‐eastern region of the United State [11,13]. The higher concentration values at Barbados and Miami are found in the summer months [11]. The principal contribution to the PM concentration values in the summer time over the Caribbean is the Saharan dust carried by the synoptic scale transport from the African Continent. This seasonal transport of the African dust is shown effectively by the TOMS UV observations of absorbing aerosols [13].
The statistical results of the series of mean daily concentrations values of PM fractions are summarized in Table I. It shows that PM10 concentration mean daily values range from 13.15 g/m3 to 73.35 g/m3 with an average value of 27.92 g/m3. The mean contribution of fine and coarse mode to the PM10 particles is the 52.1 % and 47.9 %, respectively. The average concentration values of the fine and coarse modes are almost similar with values 14.55 g/m3 and 13.37 g/m3, respectively. There is slightly higher contribution from the fine particles than coarse ones. Coarse to fine ratios (C/F) are smaller than 1.0 in two‐thirds of the day measured, with average value of 0.95. The PM10 peaks during the May to August period show higher concentration of coarse mode than fine one, almost for all the cases. The amounts of both fine and coarse mode particles in our site are almost similar. Taking into account that fine particles are associated with pollution particles while coarse particles are related with dust particles [18], we may conclude that the particulate matter at Camagüey has contribution both from dust and pollution. TABLE I Daily Mass Concentration (µg/m3). Statistics for all dataset. Fraction PM10 PM1 (Fine) PM1‐10 (Coarse) Mean 27.92 14.55 13.37 Max. 73.35 33.44 46.94 Min. 13.15 4.94 2.85 Std Dev. 11.96 5.29 8.13 Quartile 75% 28.46 16.80 13.95 Median 24.91 13.95 11.50 Quartile 25% 20.29 11.08 8.78
0 10 20 30 40 50 60 70 80 07 /0 2 21 /0 2 06 /0 3 20 /0 3 03 /0 4 17 /0 4 01 /0 5 15 /0 5 29 /0 5 12 /0 6 26 /0 6 10 /0 7 24 /0 7 07 /0 8 21 /0 8 04 /0 9 18 /0 9 02 /1 0 16 /1 0 30 /1 0
Day
M
as
s C
o
nc
en
tr
at
io
n (
μ
g/m
3)
PM10 PM1-10 (C ) PM1 (F) Fig. 1. Daily PM fraction concentration during the measurement period from February 2008 to October 2008.The values of PM10 measured at Camagüey are in the same order of magnitude of the values of PM10 concentration reported for Miami using a seven years statistics (1989‐1996) [11]. The mean value of 18.21 g/m3 registered at Miami is lower than the mean value at Camagüey. At
Miami maximum and minimum PM10
concentrations were 133.34 g/m3 and 1.47 g/m3, respectively, showing a broader ranger than the one registered for Camagüey. It should be considered in the former comparison the fact that our data covers only nine months of extent contrasted with 7 years of the Miami study [11].
A study about the content of Al and Fe in PM2.5 and PM10 particles, conducted in South Central Florida, showed that the coarse mode is predominant in the Saharan dust intrusion. Between one third and a half of the PM10 mass concentration falls in the fine mode [9]. At Camagüey measurements illustrate similar behavior, in the peaks registered between May and August period. The coarse levels of mass concentration were higher than the fine level.
Among the few studies on particulate matter conducted in Cuba, a study of the relation between respiratory diseases and air pollutants in Havana City, the capital of our country located 500 km west of our site, report statistics of PM10 particles [16]. The authors show statistical
results for one year, between October 1996 and September 1997. The mean value for this year was 61.2 g/m3. For the years 2002, 2004, and 2005 this monitoring station reported mean values of daily PM10 concentration of 88.1g/m3, 36.5 g/m3 and 48.1 g/m3 respectively. These values are higher than the mean valued reported in our site for the nine months of the 2008 year. That difference is produced by the different conditions at Camagüey site and at the site in Havana. The sampling site in Havana is located besides a high traffic street in the city. Beside, being the country capital, Havana city has a population of 2 millions inhabitants and it is surrounded by numerous industries and factories. All those conditions cause a higher emission of particulate matter that the one existing at Camagüey.
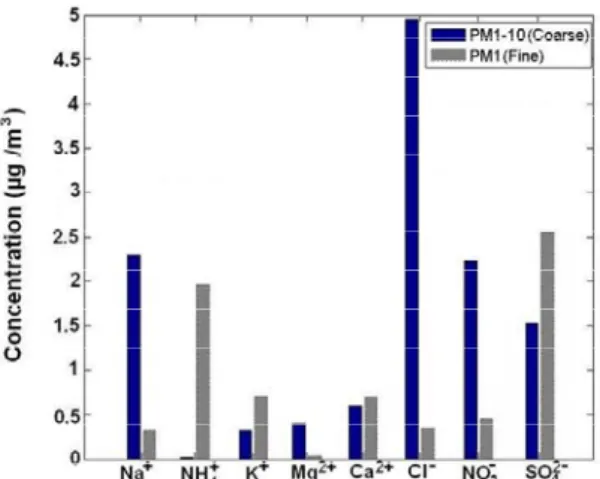
Figure 2 shows the average concentration of anions and cations in the coarse and fine modes in Camagüey. In general there are important contributions of sulphate, nitrate, Cl‐, NH4+ and Na+ to the PM mass. The coarse mode has significant levels of Cl‐ ion with an average concentration of 4.9 g/m3, Na+ ion with an average concentration of 2.3 g/m3, nitrate with an average concentration of 2.2 g/m3 and sulphate with an average concentration of 1.5 g/m3. In the fine mode the sulphate and NH4+
ion are the mainly contributors with average concentrations of 2.6 g/m3 and 1.9 g/m3 respectively. The Ca2+, Mg2+ and K+ ions have lower values of concentration that the corresponding for the previous mentioned ions. The Ca2+ ion show similar concentration values for both modes. The Mg2+ ion highest concentration is registered in the coarse mode. The K+ contributes equally to both modes, but the concentration level in the fine mode is twice the concentration in the coarse mode. These results suggest the presence of marine aerosols and contaminants in our local atmosphere in conjunction with dust. But that conclusion should be considered with caution until a longer set of measurements would be available.
Fig. 2. Average concentration of chemical species in the particulate matter for fine and coarse particles.
SO42‐ ions are a product of gaseous precursors and must be associated to fine
particles, principally the non sea salt SO42‐ [20]. In our case the SO42‐ ion have an important contribution in the coarse mode (Fig. 2). As a consequence of the complex chemistry NO3‐ is found almost totally in the coarse mode [20, 21]. The NH4+ is found almost completely in the fine mode in our data, similar to the results shown in the literature [20].
In a first approximation we may consider Na+ and Cl‐ ions as sea salt indicatives. Both then show its main contribution in the coarse mode. Also the contribution to the coarse mode of the SO42‐ could be associated to sea salt aerosols. The sea salt and mineral dust particles are characterized by high concentrations in the coarse mode [21].
Camagüey city is distant about 100 km, both to the north and south coasts of the island of Cuba. There are several industrial facilities such as a fossil fuel electric power plant, a cement plant and limestone quarry between 20 and 100 km to north‐ northeast of the city. To evaluate the possible contribution of such pollution sources to the PM10 levels a classification of the measurement days according to the local wind direction was conducted..
Table II shows the occurrence frequency of eight different predominant local wind directions during all the measurement days. The eight local wind directions were North (N), Northeast (NE), East (E), Southeast (SE), South (S), Southwest (SW), West (W), and Northwest (NW). The predominant wind directions are the East and Northeast, with frequencies of 46.1 % and 33.8 %, respectively. TABLE II Days frequency, mean PM10 and PM1 concentration, and mean concentration for major ionic components in eight local wind direction categories. WD F (%) PM10 (g/m3) PM1 (g/m3) DI Mean Mass Concentration for ionic components (g/m3) Na+ NH4+ K+ Mg2+ Ca2+ Cl‐ NO3‐ SO42‐ N 4.6 23.13 14.36 1 0.78 2.14 0.51 0.09 0.81 0.69 1.11 2.17 NE 33.8 23.81 12.87 9 1.65 1.37 0.61 0.21 0.55 2.55 1.45 2.15 E 46.1 27.77 13.66 20 1.22 0.69 0.39 0.23 0.65 2.84 1.24 1.91 SE 4.6 23.69 15.54 1 1.50 1.12 1.03 0.18 1.15 1.83 1.66 1.81 S 0 ‐ ‐ ‐ ‐ ‐ ‐ ‐ ‐ ‐ ‐ ‐ SW 9.2 49.87 25.11 3 1.41 1.24 0.72 0.32 1.01 3.36 2.32 2.54 W 0 ‐ ‐ ‐ ‐ ‐ ‐ ‐ ‐ ‐ ‐ ‐ NW 1.5 18.31 12.26 1 0.50 1.45 0.46 0.05 0.55 0.46 0.69 1.62 Wind direction (WD), frequency (F), and number of days with ion concentration measurements (DI).
In Table II the highest mean PM10 and PM1 daily concentration values are in the case of the local wind direction from the Southwest, with 9.2 % of occurrence frequency. The lower values of mean PM10 and PM1 concentration values are in the days with predominant local wind direction from NW, and this is the direction with the lowest frequency value.
The mean concentration for major ions for PM10 in each local wind direction is also shown in Table II. Note that only 35 measurement days have information about concentration of the major ionic components for PM10 (days with both PM1 and PM1‐10 chemical concentration information). The maximum mean concentration values of Cl‐,
NO3‐, Mg2+ and SO42‐ in PM10 are in the case that the local wind flow is from the SW direction. The NE and E directions follow in the scale with similar values for different ionic components. The SW local wind direction appear related with a highest pollutant and natural aerosols contribution to our site, during the measurement period. The most frequent local wind directions in our site, NE and E, are linked also with important levels of aerosols in our site. Both local wind directions are associated with the trades wind and the arrival of the eastern waves. The SW local wind direction in our site are related with the secondary high pressure centre weakening or a synoptically weather phenomenon.
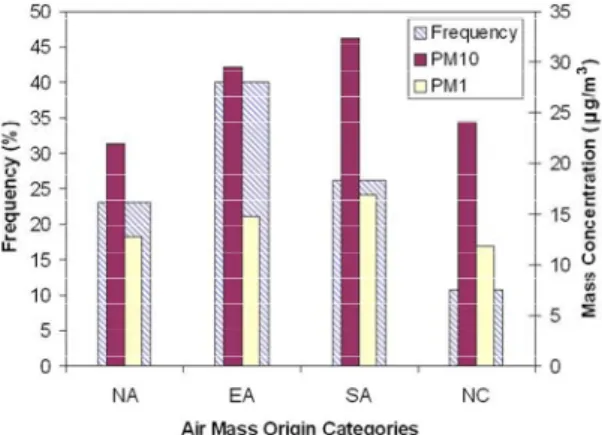
The origins of the air masses for the measurement days were classified in four categories, North‐Atlantic (NA), East‐Atlantic (EA), South‐Atlantic (SA) and North‐Continent (NC). The classification was based in the origin and trajectory of the air mass. The results shown in Fig. 3 indicate the EA locations have the largest frequency values. The frequency values were 23.1%, 40.0%, 26.1% and 10.8% for the NA, EA, SA and NC locations, respectively. The mean PM10 and PM1 concentration values for the air masses origin categories have their maximum value for the ones originated at the SA locations, with 32.4 g/m3 and 16.9 g/m3, respectively. These air mass origins EA and SA are related with the arrival of the eastern waves and the Saharan dust transported to the Caribbean.
The results shown for the air masses are consistent with the previous results obtained for the local wind direction classification. The most frequent predominant local wind direction is the East. The maximum mean values for PM10 and PM1 are obtained in the SW local wind direction and for the SA origin of the air mass.
Fig. 3. Frequency of occurrence, mean PMN10 and PM1 concentrations for the air mass origins categories.
3.2. Two cases of study
Two days from the 65 measurements days were chosen. The first one (case 1) is the day with highest value of daily PM10 concentration in the data, May 12, 2008. The second one (case 2) is June 25, 2008, the day with maximum value of PM10 concentration in the data during the period of the maximum Saharan dust intrusions, from June to August.
The case 1 has the largest concentration value of PM10 of 73.3 g/m3. The fine and coarse mode have concentration values of 26.4 g/m3 and 46.9 g/m3 respectively. The concentration value for the coarse mode is the highest in the data as well. The value for the fine mode is the second in the high magnitude. The concentration of the coarse mode is higher than the fine mode.
Table III show the concentrations of ion component for the case 1. Concentration of NO3‐ ion the highest values of all the dataset. The Na+ concentration is higher than the upper limit of the technique, so it saturates the equipment. Concentration of Cl‐, Ca2+, K+ and SO42‐ ions are not the highest value in all data, but they have values higher than the mean value. Remaining
ions have values higher or near the mean in the fine mode. The ions component show the existence of high level of pollution, related with high NO3‐ and SO42‐ ions concentration, mixed with possible marine aerosols and/or dust, related with reasonable high concentration of Ca2+, K+ , Na+ and Cl‐. TABLE III Concentration (µg /m3) for major ionic components measured at Camagüey for May 12th, 2008. PM1 (Fine) PM1‐10 (Coarse) Na+ 0.58 Saturate NH4+ 1.61 0.07 K+ 1.07 0.53 Mg2+ 0.13 0.86 Ca2+ 1.15 2.23 Cl‐ 0.30 9.60 NO3‐ 1.02 5.30 SO42‐ 2.30 3.38
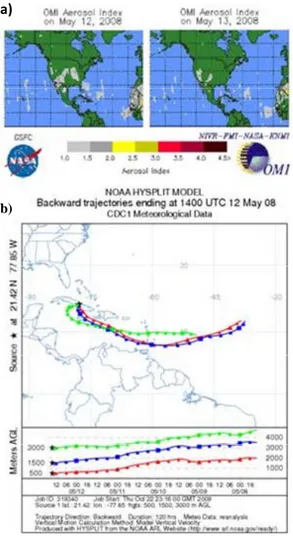
Figure 4 shows the wind rose during the 24 hours measurement interval. The SW direction of the wind was more frequent with 91 %. This direction was previously related with the high levels of PM and ions concentrations. The Aerosol Index (AI) product from Ozone Monitoring Instrument (OMI) and the results from the backward trajectories from HYSPLIT model for the case 1 are shown in the Figure 5. In Fig. 5(a) the AI denotes the presence of aerosols in the area, but with low values of the AI. It seems to have a low concentration of aerosols in the area and no aerosols over the site. The AI in previous days (not shown), confirm high values of AI in the western of the African Continent, for the first day of May. The five to six following days showed the transport of the Saharan dust trough the Atlantic. The remnants of this Saharan dust cloud arrived to the Caribbean and Cuba on May 7th and May 8th, respectively. In Fig. 5(b), the backward trajectories for 5 days show that the air mass origin was in the Eastern Atlantic. The air mass moved through the Caribbean Sea and the southern region of the site. The air mass measured seems to be a mixture of the Saharan dust clouds, marine aerosols and perhaps pollution aerosols from the northern region of the South American continent.
Fig. 4. Wind rose during the measurement interval (24 hours) in June 12th‐13th, 2008.
a)
b)
Fig. 5. (a) Aerosol index from ozone monitoring instrument for June 12th‐13th, 2008. (b) Backward
trajectories calculated from HYSPLIT model for June 12th, 2008, 14:00 UTC.
The case 2 was the day with PM10 higher values in the period from June to August, with 55.9 g/m3. The fine and coarse mode have concentration values for this day of and 18.3 g/m3 and 37.7 g/m3 respectively. The concentration of the coarse mode is higher than the fine mode.
Table IV show the concentrations of ion component for the case 2. NO3‐ and SO42‐ ions are between the highest concentrations values in the data. The Na+ concentration is higher than the upper limit of the technique, so it saturates the equipment. Concentration of Cl‐ is the highest value in all data. Concentrations of Ca2+ and Mg2+ have values higher than the mean in the coarse mode. The SO42‐ion has for this day the highest value of concentration in all the dataset.
The ions component show the existence of moderate level of pollution, related with reasonable high NO3‐ and SO42‐ ions concentration, mixed with possible marine aerosols and/or dust, related with high concentration of Ca2+, Mg+ , Na+ and Cl‐.
TABLE IV Concentration (µg /m3) for major ionic components measured at Camagüey for May 25th, 2008. PM1 (Fine) PM1‐10 (Coarse) Na+ 0.37 Saturate NH4+ 0.65 0.00 K+ 0.23 0.68 Mg2+ 0.04 1.15 Ca2+ 0.17 1.31 Cl‐ 0.41 16.73 NO3‐ 0.38 2.32 SO42‐ 2.35 3.31
Figure 6 shows the wind rose during the measurement interval. The E direction of the wind was more frequent with 82 %. This direction is the most frequent in our site and was previously related with the high levels of PM and ions concentrations. The AI and the results of the backward trajectories for the case 2 are shown in Fig. 7. The AI denotes the presence of the aerosol in the area. In Fig. 7(a) there is a high value of the AI, for the measurement day. Concentration of aerosols in the area and over the site is evident and elevated. The AI in previous days (not shown) is characterized by high values in the western of the African Continent, for the June 20, associated with a Saharan dust cloud. This Saharan dust cloud arrives to the Caribbean and Cuba by June 23. In Fig. 7(b), the backward trajectories for 5 days show that the air mass origin was in the Eastern Atlantic. The air mass passes over the Atlantic
Ocean and the eastern region of the site. The air mass measured seems to be a mixture of the Saharan dust clouds, marine aerosols and perhaps other pollution aerosols from the local and regional sources. Fig. 6. Wind rose during the measurement interval (24 hours) in June 25th‐26th, 2008. a) b) Fig. 7. (a) Aerosol index from ozone monitoring instrument for June 25th‐26th, 2008. (b) Backward
trajectories calculated from HYSPLIT model for June 25th, 2008, 14:00 UTC.
3. Conclusions
Preliminary results of the measurements of the concentration of PM10 and PM1 fractions and its chemical composition at Camagüey, Cuba are reported for the period February to October of 2008. The mean values of PM10 and PM1 are 27.92 µg/m3 and 14.55 µg/m3, respectively. The highest concentration of PM is observed between May and August months. This result is in agreement with some reports in the area. The coarse and fine modes are in the average terms in almost the same proportion in the atmosphere at the site.
The ions components show high concentrations of Cl‐, Na+, NO3‐and SO42‐ in the coarse mode and high concentration of the SO42‐ and NH4+ in the fine mode.
There is a relation between the local wind direction and PM levels in our site. The Southwest local wind direction is related with high levels of PM, and Northwest local wind direction is associated with low levels of PM. Also, Southwest local wind direction is related with high levels of some ionic components. The most frequent air masses origin was the East Atlantic region.
Two cases day were analyzed, the first one with the highest PM10 concentration. The AI from OMI shows a low amount of aerosol in the area. These aerosols are remnants of Saharan dust cloud. The combination of the air mass from
the East Atlantic and the SW wind direction are related with a high PM concentration. The remaining of the Saharan dust cloud mixed with regional aerosols from the Caribbean Sea reached the site accordingly to backward trajectory analysis. In the second day there was an obvious intrusion of Saharan dust aerosols over the site, confirmed by the AI values from OMI and backward trajectory analysis. This situation produced a high concentration of the PM and ion components.
Acknowledgements
Authors thanks the staff of the Air Quality Lab at the National Institute for Hygiene, Epidemiology and Microbiology in Havana City (INHEM), for their fundamental contribution weighting the filters. Authors from GOAC‐INSMET want to thank to GOA‐UVA team by the support and logistic. To AERONET NASA our gratitude for including Camagüey site on the AERONET web site. We would like also to thank the NOAA Air Resources Laboratory for providing the HYSPLIT model use online. This work has been supported by the Cuban National Climate Change Research Program and by the Collaboration Agreement between the Grupo de Óptica Atmosférica (GOA‐ UVA) and the Grupo de Óptica Atmosférica de Camagüey (GOAC‐INSMET), formerly the Camagüey Lidar Station, and by Financial supports from the Spanish MICIIN (ref. CGL2008‐05939‐CO3‐00/CLI and CGL 2009‐ 09740).