(Annals of the Brazilian Academy of Sciences) ISSN 0001-3765
www.scielo.br/aabc
Characterisation of solvent extractable organic constituents in
atmospheric particulate matter: an overview
CÉLIA A. ALVES
Centre for Environmental and Marine Studies, Department of Environment, University of Aveiro, 3810-193 Aveiro, Portugal
Manuscript received on May 3, 2007; accepted for publication on July 12, 2007; presented byFERNANDOGALEMBECK
ABSTRACT
In spite of accounting for 10-70% of the atmospheric aerosol mass, particulate-phase organic compounds are not well characterised, and many aspects of aerosol formation and evolution are still unknown. The growing awareness of the impact of particulate aerosols on climate, and the incompletely recognised but serious effects of anthropogenic constituents on air quality and human health, have conducted to several scientific studies. These investigations have provided information about the behaviour of atmospheric particulate matter and the description of the character of its carbonaceous content. The compilation of such results is important as they append to the emergent global-wide dataset of the organic composition of atmospheric aerosols. The contribution of the major emission sources to regional particulate pollution can be diagnosed by using specific molecular markers. This overview is mainly focused on results obtained with gas chromatography coupled with mass spectrometry, since it is the analytical method of choice in elucidating the solvent-extractable organic compounds in atmospheric particulate matter. A synopsis of the selection of organic tracers and the application of geochemical parameters to the analysis of organic constituents as a tool for source apportionment is shown here. Besides the assessment of current knowledge, this paper also presents the identification of further areas of concern.
Key words:atmospheric aerosol, gas chromatography-mass spectrometry, organic compounds, source apportionment, tracers.
INTRODUCTION
Aerosols are mixtures of solid and liquid droplets of ma-terial that vary in size and origin. Airborne suspended particulate matter can be either primary or secondary in nature. Primary particles are emitted directly into the atmosphere both by natural or anthropogenic sources, while secondary particles are produced in the atmosphere from the oxidation and subsequent reactions of sulphur dioxide, nitrogen oxides and volatile organic compounds. Primary biogenic aerosols are particles that are produced by the crumbling and dispersion of plant and animal ma-terial, and the spreading of microbes from a variety of surfaces into the atmosphere. Industrialisation, human
E-mail: [email protected]
earth crust materials and fugitive dust from roads and industries. The fine fraction encompasses most of the acidity (hydrogen ion) and mutagenic activity of partic-ulate matter, although in fog some coarse acid droplets are also present. The major aerosol components include inorganic substances such as sulphates and carbonaceous species. The carbonaceous aerosol is formed by a com-plex mixture of organic compounds, normally referred as organic carbon (OC), and a mass of carbon atoms with a graphitic-like structure that is black in colour and is nor-mally named as soot, black carbon or elemental carbon (BC or EC). Organic matter is an important fraction of the atmospheric aerosols, contributing with 10-70% of their mass (Turpin et al. 2000).
Atmospheric PM is an environmental concern, above all because it can dramatically reduce visual range (Hobbs 2002), and have a profound effect on climate (Penner et al. 1998). The direct and indirect radiative forcing of climate by anthropogenic aerosols is believed to be similar in magnitude but opposite in sign to the global warming caused by the emissions of greenhouse gases (Farquhar 1997, Mahlman 1997). Fine particles and the associated organic compounds are also of cur-rent concern because of their putative health effects (Abelson 1998, Pope et al. 2004, Poschl 2005). There is a general consensus that the organic composition of atmospheric aerosol should be understood to correctly describe the chemical mechanisms and models concern-ing the multiphase atmospheric system and to evaluate its environmental and health effects. Despite the progress made in elucidating the source types, their relative impor-tance and contribution to certain particulate components, the organic composition of aerosols and particle forma-tion processes are still scarcely known. This is probably due to analytical difficulties, complexity of phenomena and huge number of compounds that are present (Alves et al. 2006).
The objective of this paper is to contribute to cla-rifying the role and importance of the carbonaceous aerosol in the environment by answering to questions such as: Which are the sources of the carbonaceous aerosol? Which are the best tracers to track the con-tributions of the main sources? Is the organic aerosol of primary or secondary origin? How much of the or-ganic carbon is extractable and identifiable by common
laboratory equipments used for organic speciation (e.g. gas chromatograph/mass spectrometer)? Is it possible to close the material balance of the organic aerosol? Which are the organic constituents that we haven’t been able to quantify? What problems are ripe for further investiga-tion? The discussion of these points constitutes the main goal of the present review study. A comparison of recent results obtained in different researches throughout the world and the limitations that still persist are presented.
METHODOLOGIES FOR THE DETERMINATION OF ORGANIC AEROSOL COMPOSITION
Dece-sari et al. 2000, Feng et al. 2007). This is because uni-versal solvents for both polar and non-polar OC do not exist, high-molecular organics (>C40) and highly po-lar compounds (particupo-larly multifunctional) do not elute through a GC column and identified compounds are em-bedded in an unresolved complex mixture. Polar organic compounds need derivatisation prior to analysis, to con-vert them into less polar and more volatile derivatives that will elute chromatographically. However, the deriv-atisation techniques are compound-class specific and thus several different methods may be required for a wide-ranging analysis. On the other hand, since derivati-sation procedures are compound-class specific, require a priori knowledge about the particulate matter com-position. The derivatisation reagent by-products, the complexity of derivatisation procedures, lack of stan-dards, and limited mass spectral libraries makes these analyses difficult and time consuming. The combined GC/FTIR/MS technique offers the advantage of addi-tional information from the FTIR spectrum, complemen-tary to mass spectrum information, and is helpful in iden-tification of individual components, especially isomers; often these compounds have very similar mass spectra, but unique IR spectra (Zielinska 2002).
HPLC coupled with a mass spectrometer or a pho-todiode array detector seems to be especially suitable for the analysis of polar organic compounds. Aqueous so-lutions can be injected into reverse-phase columns, and polar compounds do not need a derivatisation step in order to elute from most of the LC columns (Zielin-ska 2002). However, compared with GC and GC/MS, HPLC has infrequently been used for the study of or-ganic aerosol (Jacobson et al. 2000). This is perhaps be-cause LC columns present less resolving power than GC columns and are habitually intended for restrict organic classes. Moreover, even though that numerous commer-cial LC/MS systems are available, they are not properly developed for atmospheric investigation. From the two types of interfaces available between LC and MS, elec-trospray and particle beam, the last one seems to be more promising (Kiss et al. 2003). Additional progress of separation methods and mass spectral libraries is also essential.
Sierau et al. (2003) developed a method for rapid measurement of particle size and chemical composition.
The method uses a saturator/condenser system and an impactor; the saturator/condenser system grows submi-crometer particles to a size where they can be easily col-lected by the impactor. This system was called con-densation-growth and impaction system, or C-GIS. To do size-segregated analysis, an optional differential mo-bility analyser (DMA) can be added upstream of the C-GIS to select the particle size that is introduced into the condenser. The C-GIS converts the sampled aerosol into a hydrosol, and provides liquid samples sufficiently concentrated for the liquid-phase analytical instruments used for chemical analysis without on-line pre-concen-tration of the sample. The results indicate that the C-GIS can be used for size-segregated particle sampling with subsequent off-line chemical particle analysis with a sampling time of at least 20 min under typical atmo-spheric conditions. For atmoatmo-spheric applications, how-ever, its capability to rapidly measure size-segregated chemical composition is limited by the particle concen-tration present downstream of the DMA, and therefore, such measurements typically can only be made in heav-ily polluted areas or within the scope of source-charac-terisation studies.
higher than in LC and the required sample amount is very low (Zielinska 2002). Thermal desorption parti-cle beam mass spectrometry has been lately developed and employed for identification of secondary organic aerosol constituents produced in environmental cham-bers (Tobias and Ziemann 2000). In this method, a num-ber of particles are trapped on a cold step and gradu-ally heated, to separate compounds depending on their volatility. This analytical equipment presents a large ca-pability for identification of organic compounds formed in controlled laboratory experiments. However, its re-solving power to identify and quantify single compounds within a complex organic mixture, as observed in at-mospheric aerosols, is very limited. Recently, several researchers have developed instruments for real-timein situanalysis of single particles, including carbon anal-ysers and single particle instruments to fragment each particle into ions using either a high-power laser or a heated surface and to then use a time-of-flight mass spec-trometer for measuring the ion fragments in a vacuum (Guyon et al. 2004, Johnston and Wexler 1995, Silva and Prather 1997, Thompson and Murphy 1994, Turpin and Huntzicker 1995). Direct thermal desorption – gas chro-matography – time-of-flight mass spectrometry (DTD-GC-TOFMS) and comprehensive two-dimensional (2D) gas chromatography – time-of-flight mass spectrome-try (GC×GC-TOFMS) was applied by Welthagen et al. (2003) for characterisation of semi-volatile organic com-pounds in PM2.5. These investigators concluded that GC×GC-TOFMS is a suited technique to study the na-ture of the yet unidentified compounds forming the unre-solved complex mixtures (UCM). The considerably in-creased chromatographic resolution in GC×GC allows separation of many UCM compounds while the TOFMS supplies mass spectral data of all separated compounds. However, the data sets were considered enormously com-plex. In the near futurein situsingle-particle TOFMS analysis methods are unlikely to quantify, compound by compound, the concentration of a large (50-100%) frac-tion of organic material in atmospheric PM (Turpin et al. 2000). Generally these instruments are more appro-priate for inorganic than organic species, but the future technical development could surmount this panorama.
One important objective of detailed chemical analy-sis of the organic aerosol is the mass closure of the aerosol
GC/MS CHARACTERISATION STUDIES
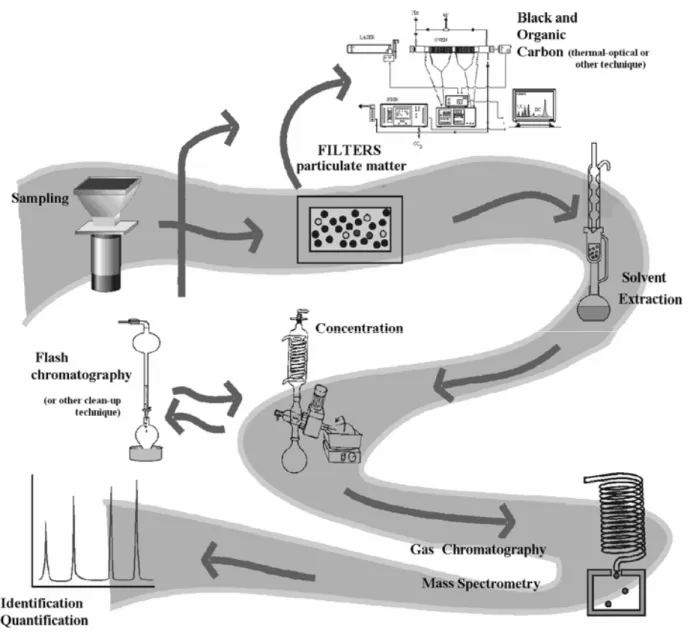
GC/MS has by far been the most common means of identifying organic compounds in atmospheric aerosol. The motive is that GC can be used to separate a very ample range of compounds on a single column, and the simple on-line coupling to mass spectrometry (usually electron-impact quadrupole) makes compound identifi-cation rather easy. The preliminary GC/MS results on at-mospheric organic particulate matter were obtained at the end of the seventies and beginning of the eighties. How-ever, the content of these works were focused mainly on practical details, such as the evaluation of the analyti-cal methodologies of solvent extraction, and did not at-tempt to present an exhaustive description of the aerosol composition (Barkenbus et al. 1983a, b, Cautreels and Cauwenberghe 1977, Hill et al. 1977, Karasek et al. 1978, Ketseridis et al. 1976, Wauters et al. 1979). If chemical analysis is performed using a chromatographic method, aerosols collected on filters or impactor plates are subjected to an extraction procedure (ultrasonication, Soxhlet, supercritical fluid CO2 extraction, etc.). An example illustrating the entire procedure is provided in Figure 1. Thermal/optical carbon analysis (TOC) is a technique for separating and measuring the total amount of organic and elemental carbon, commonly from quartz filter samples. This determination is essential in any study that involves extraction of material from filters be-cause it permits measurement of the extraction efficiency. The filter sample is placed into a chamber and heated in the presence of one or more purge gases through a suc-cession of temperature steps. A catalyst converts the evolved gases to either CO2or CH4, which are quanti-fied using infrared or flame ionisation detection, respec-tively. In most of the thermal evolution techniques, the division between organic and elemental carbon is based on the temperature and/or the type of purge gas used for analysis (Birch 1998, Birch and Cary 1996, Cadle and Mulawa 1990, Carvalho et al. 2006, Chow et al. 1993, 2001, 2004, 2005, Conny et al. 2003, Venkatachari et al. 2006, Watson and Chow 2002). OC is generally defined as the non-carbonate carbon that evolves under a heating cycle in the presence of either He or N2, and EC is de-fined as that which evolves in a succeeding heating step in the presence of a gas mixture including oxygen, such
as 98%He + 2%O2 (Birch and Cary 1996, Chow et al. 1993, 2001, Schauer et al. 2003a). It should be noted that some organic compounds pyrolyse or “char” before they are evolved under the He/O2 part of the analysis. The char that is produced in the analysis, if not accu-rately accounted for, would be erroneously reported as EC present in the original sample (Schauer et al. 2003a). Usually, a laser absorbance procedure is used to correct for charring in thermo-optical methods.
Fig. 1 – Scheme representing a common sampling, extraction and GC/MS procedure for organic speciation of atmospheric aerosols.
2003, Schauer et al. 1996, Sheesley et al. 2003, Simo-neit 1989, 1999, 2002, SimoSimo-neit and Elias 2001, Si-moneit and Mazurek 1989, SiSi-moneit et al. 1990, 1993, 1996, 1999, 2003a, b, 2004a, b, Standley and Simoneit 1994, Zheng et al. 2002). Source-receptor reconcilia-tion by chemical mass balance (CMB) has been used to characterise the composite sources of organic com-pounds that includes gasoline vehicle exhaust, meat cooking, cigarette smoke, wood burning, etc. (Calhoun et al. 2003, Chow and Watson 2002, Feng et al. 2006, Khalil and Rasmussen 2003, Li and Kamens 1993, Mazurek 2002, Robinson et al. 2006a, b, Schauer et
Chinese urban areas (Bi et al. 2002, 2003, Cao et al. 2003, 2004, Duan et al. 2004, Guo et al. 2003, 2004, Hou et al. 2006, Simoneit et al. 1991a, Yang et al. 2005a, Wang et al. 2002, 2006a, b, 2007, Wang and Kawamura 2005, Zheng et al. 2005), Barcelone (Aceves and Gri-malt 1992, 1993), London (Kendall et al. 2001), Hous-ton, Texas (Fraser et al. 2002, Laurent and Allen 2004, Yue and Fraser 2004), Miami, Florida (Lang et al. 2002), Kuala Lumpur, Malaysia (Abas et al. 2004b, Abas and Simoneit 1996), Toronto (Blanchard et al. 2002), Prato, Italy (Cincinelli et al. 2003), Launceston, Australia (Keywood et al. 2000), Santiago, Chile (Didyk et al. 2000, Kavouras et al. 1999a, 2001a, Romero et al. 2002, Tsapakis et al. 2002), Temuco, Chile (Tsapakis et al. 2002), Oporto, Portugal (Oliveira et al. 2007a), Gent, Belgium (Kubátová et al. 2002), Birminghan, UK (Har-rad et al. 2003), Helsinki, Finland (Kallio et al. 2003), Copenhagen (Oliveira et al. 2007a), the Brazilian cities of Rio de Janeiro (Azevedo et al. 1999), Campo Grande (Ré-Poppi and Santiago-Silva 2002), São Paulo (Vas-concellos et al. 2003) and Campos dos Goytacazes (Aze-vedo et al. 2002), Philadelphia (Li et al. 2006), Seat-tle (Kim et al. 2004) and Tel Aviv, Israel (Graham et al. 2004). However, the Los Angeles metropolitan area represents, incontestably, the one that is favoured by a higher number of studies on organic composition of at-mospheric aerosols (Fine et al. 2004b, Fraser et al. 1997, 1999, Hildemann et al. 1994, 1996, Lough et al. 2006, Manchester-Neesvig et al. 2003, Rinehart et al. 2006, Rogge et al. 1993e, 1996, Schauer et al. 2002a, Si-moneit 1984, SiSi-moneit and Mazurek 1989, Zhu et al. 2004). Comparatively, few studies have investigated re-mote, rural and semi-rural environments (Alves et al. 2000, 2001, 2007, Cheng et al. 2006, Feng et al. 2007, Oliveira et al. 2007b, Pio et al. 2001a, b, Rissanen et al. 2006, Shimmo et al. 2004a, Simoneit et al. 1990) or have been performed above ocean areas. These investi-gations include the Mediterranean (Gogou et al. 1996, 1998, Grimalt et al. 1988, Sicre et al. 1987, Simó et al. 1991), the North Pacific (Gagosian et al. 1981, 1982, Kawamura 1995, Kawamura et al. 2003), the South Pa-cific (Gagosian et al. 1987, Sicre and Peltzer 2004), the Caribbean (Mayol-Bracero et al. 2001) and the Atlantic (Conte and Weber 2002, Simoneit and Elias 2000, Si-moneit et al. 1977, 1991b).
SPECIATION OF ORGANIC AEROSOLS
POLYCYCLIC AROMATIC HYDROCARBONS
The polycyclic aromatic hydrocarbons (PAH) represent an organic class more investigated than any other, be-cause they are believed to be carcinogenic and/or mu-tagenic (Baek et al. 1991, Brown et al. 1996, Crim-mins and Baker 2006, Dyremark et al. 1995, Li et al. 2003). The carcinogenicity of PAH is about 1/103–1/104 of that of 2,3,7,8-TCDD. The PAH concentration in the atmosphere is about 104–106times higher than that of TCDD. Therefore, the carcinogenic risk of PAH in the atmosphere is so high that it must be monitored as we would monitor dioxins (Okuda et al. 2006). Fossil fuel combustion is the main anthropogenic activity respon-sible for the introduction of PAH into the urban atmo-spheres. Stationary sources such as domestic heating, various industrial processes, incineration and energetic production systems are also responsible for the imprint of polyaromatics (Baek et al. 1991, Cincinelli et al. 2007, Lee et al. 2002, Liu et al. 2006, Sklorz et al. 2007). The natural sources responsible for the release of PAH com-prise forest fires, microbiological processing of detritus (e.g. fossil fuel) and mechanisms of biosynthesis carried out by algae, plants and bacteria (Cincinelli et al. 2007, Smith and Harrison 1998).
TABLE I
Properties and structures of select PAH (Sources: http://chemfinder.cambridgesoft.com/;
http://www.europa.eu.int/comm/environment/air/pdf/annex_pah.pdf).
PAH Formula Molecular
weight (g mol-1)
Boiling point
(ºC)
Melting point
(ºC)
Vapour pressure (at 25ºC)
(Pa)
Water solubility (at 25ºC) ( g L-1)
Structure
Naphtalene C10H8 128 217.9 81 10.4 3.17E4
Acenaphtilene C12H8 152 295 92-93 8.9E-1 3.93E3
Acenaphthene C12H10 154 279 95 2.9E-1 3.93E3
Fluorene C13H10 166 295 115-116 8.0E-2 1.98E3
Phenanthrene C14H10 178 340 100.5 1.6E-2 1.29E3
Anthracene C14H10 178 342 216.4 8.9E-4 73
Fluoranthene C16H10 202 375 108.8 1.2E-3 260
Pyrene C16H10 202 393 150.4 6.0E-4 135
Benzo[a]anthracene C18H12 228 400 160.7 2.8E-5 14
Chrysene C18H12 228 448 253.8 8.4E-5
(20ºC) 2.0
Retene C18H18 234
390-394 99
< 1g L-1 (18ºC)
Benzo[b]fluoranthene C20H12 252 481 168.3
6.7E-5
(20ºC) 1.2
Benzo[k]fluoranthene C20H12 252 480 215.7
1.3E-8
(20ºC) 0.76
Benzo[a]pyrene C20H12 252 496 178.1
7.3E-7
(20ºC) 3.8
Indeno[1,2,3-cd]pyrene C22H12 276 536 163.6
1.3E-8
(20ºC) 62
Benzo[ghi]perylene C22H12 276 545 278.3 1.4E-8 0.26
Dibenzo[a,h]anthracene C24H14 278 266.6 524
1.3E-8 (20ºC)
0.5 (27ºC)
Coronene C24H12 300 525 >350 2E-10 0.122
particulate compounds on glass- or quartz-fibre filters by using air conventional high-volume samplers. However, as pointed out in several articles, 3- to 5-ring PAH, which have relatively high vapour pressures, are also found in the gas phase at ambient temperatures and their reten-tion on the filter media is not complete. Thus, it has
It is known that PAH undergo chemical and photochemi-cal degradation in the atmosphere, especially in the pres-ence of atmospheric oxidants such as ozone, hydroxyl radical and nitrate radical. These reactions continue dur-ing sampldur-ing. As a result, the PAH concentration pro-files will be changed during sampling and their potential adverse health effects will be over- or underestimated (Liu et al. 2006). A possible way to reduce ozonisation reaction during sampling is the use of a denuder to re-move ozone from the air stream prior to the collection of aerosol particles on the filter. Recently, some researchers have applied ozone denuders to high- and low-volume sampling to inspect their influence on the sampling of ambient PAH. Schauer et al. (2003b) made use of an activated carbon denuder in a low-volume sampler. It was found that the degradation of 5- and 6-ring PAH on filter had a near-linear dependence on ozone volume mix-ing ratio. Accordmix-ing to this investigation, filter reaction artefact can lead up to a 2-fold underestimation of real at-mospheric PAH levels. Tsapakis and Stephanou (2003) employed a high-volume oxidant denuder, consisting of tubes coated with water/glycerol KNO2solution. Most of the gas and particulate phase PAH were vulnerable to ozone degradation under long sampling times with high O3levels. Creutznacher et al. (2003) studied the ozone cross-sensitivity of particle accumulated PAH, using a manganese oxide ozone denuder. In disagreement with the previous studies, the authors concluded that, for an average ozone level of 60µg m−3, only benzo[a]pyrene had a perceptible degradation of approximately 15% in the non-denuded samples by comparing their average yearly concentrations. Liu et al. (2006) used a MnO2 ozone denuder and found that levels of 5- to 7-ring PAH were underestimated in non-denuded samples, while the 4- to 5-ring oxygenated PAH were overestimated. The highest losses due to reaction with atmospheric oxidants were observed for benzo[a]pyrene and perylene.
Extraction of PAH from their sampling me-dia has been traditionally performed using Soxhlet or ultrasonic agitation. A more recent alternative to these two methods is the use of supercritical fluid extraction (SFE) [Friedrich and Kleiböhmer 1997, Hawthorne and Miller 1987, Lewis et al. 1995, Shimmo et al. 2002, 2004b]. Quantitative analysis is generally performed by GC or high HPLC coupled with fluorescence, UV, FID
and MS detectors (Becker et al. 1999, Brown et al. 1996, Dimashi et al. 2000, Lewis et al. 1995). Some authors reported also direct analysis of PAH by thermal desorption GC/MS applied mostly to urban dust refer-ence materials (Crimmins and Baker 2006, Falkovich and Rudich 2001, Waterman et al. 2000). Ochsenkühn-Petropoulou et al. (2003) presented the development of an on-line technique, the pyrolysis/GC-MS for the identi-fication and the quantiidenti-fication of PAH in airborne partic-ulate matter collected on cellulose filters. By this tech-nique a pre-treatment of the samples is not necessary, avoiding the time consuming and expensive extraction step (Fabbri et al. 2002).
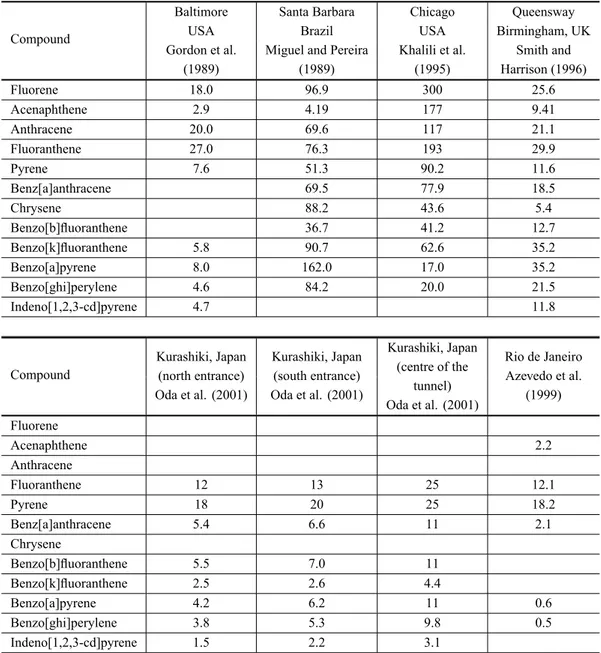
Since traffic, a prominent source of polynuclear hy-drocarbons, present large emissions and have dramatic effects on air quality, attention has been focused on ur-ban areas, especially in busy roads, tunnels and city cen-tres (Tables II and III). Background concentrations of PAH reported at remote sites are 1-2 of magnitude lower (Halsall et al. 1997). Some other studies have been de-voted to the identification of PAH in particular com-bustion sources or in the proximity of specific emis-sions sources: wildfires (Masclet et al. 1995, Okuda et al. 2002), charcoal grilling (Dyremark et al. 1995), biomass burning (Fine et al. 2001, 2002a, b, 2004a, Freeman and Cattell 1990, Hays et al. 2005, Keshtkar and Ashbaugh 2007, Lee et al. 2005, Oros and Simoneit 2001a, b, Rogge et al. 1998, Santos et al. 2002, Schauer et al. 2001, Sheesley et al. 2003), ferries (Cooper et al. 1996), diesel exhausts (Cho et al. 2004, Jiao and Lafleur 1997, McDonald et al. 2004, Reilly et al. 1998. Schauer et al. 1999b, Zielinska et al 2004), burning of sugar plantations (Godoi et al. 2004, Santos et al. 2002), near power plants (Kalaitzoglou et al. 2004), vegetable oil processing plant (Kavouras et al. 2001b), cooking with seed oils (Schauer et al. 2002b), incinerators (Besombes et al. 2001, Lee et al. 2002, Mao et al. 2007), burning of foliar fuels (Hays et al. 2002), roadside (Harrison et al. 2003) and vehicle exhausts for different fuels, lubri-cants and engine operating conditions (Brandenberger et al. 2005, Lim et al. 2005, 2007, Pedersen et al. 1980, Schauer et al. 2002c, Westerholm et al. 1988, 1992, Yang et al. 2005b, 2007, Zielinska et al. 2004).
particu-TABLE II
Comparison of PAH concentrations obtained at road tunnels throughout the world (ng m-3).
Compound
Baltimore Santa Barbara Chicago Queensway
USA Brazil USA Birmingham, UK
Gordon et al. Miguel and Pereira Khalili et al. Smith and
(1989) (1989) (1995) Harrison (1996)
Fluorene 18.0 96.9 300 25.6
Acenaphthene 2.9 4.19 177 9.41
Anthracene 20.0 69.6 117 21.1
Fluoranthene 27.0 76.3 193 29.9
Pyrene 7.6 51.3 90.2 11.6
Benz[a]anthracene 69.5 77.9 18.5
Chrysene 88.2 43.6 5.4
Benzo[b]fluoranthene 36.7 41.2 12.7
Benzo[k]fluoranthene 5.8 90.7 62.6 35.2
Benzo[a]pyrene 8.0 162.0 17.0 35.2
Benzo[ghi]perylene 4.6 84.2 20.0 21.5
Indeno[1,2,3-cd]pyrene 4.7 11.8
Compound
Kurashiki, Japan Kurashiki, Japan Kurashiki, Japan Rio de Janeiro (north entrance) (south entrance) (centre of the Azevedo et al.
Oda et al. (2001) Oda et al. (2001) tunnel) (1999)
Oda et al. (2001) Fluorene
Acenaphthene 2.2
Anthracene
Fluoranthene 12 13 25 12.1
Pyrene 18 20 25 18.2
Benz[a]anthracene 5.4 6.6 11 2.1
Chrysene
Benzo[b]fluoranthene 5.5 7.0 11
Benzo[k]fluoranthene 2.5 2.6 4.4
Benzo[a]pyrene 4.2 6.2 11 0.6
Benzo[ghi]perylene 3.8 5.3 9.8 0.5
Indeno[1,2,3-cd]pyrene 1.5 2.2 3.1
late matter and later in the extracts of diesel exhausts has led to a sharp increase in interest in the environmental occurrence of these compounds and in the improvement of analytical procedures for their quantification (Bam-ford and Baker 2003, Bam(Bam-ford et al. 2003, Dimashki et al. 2000). Nitro-PAH can be 100,000 times more muta-genic and 10 times more carcinomuta-genic compared to the unsubstituted-PAH (Bamford and Baker 2003). Concen-trations of the different compounds vary with the extent of urbanisation (Table IV). For example, 1-nitropyrene
TABLE III
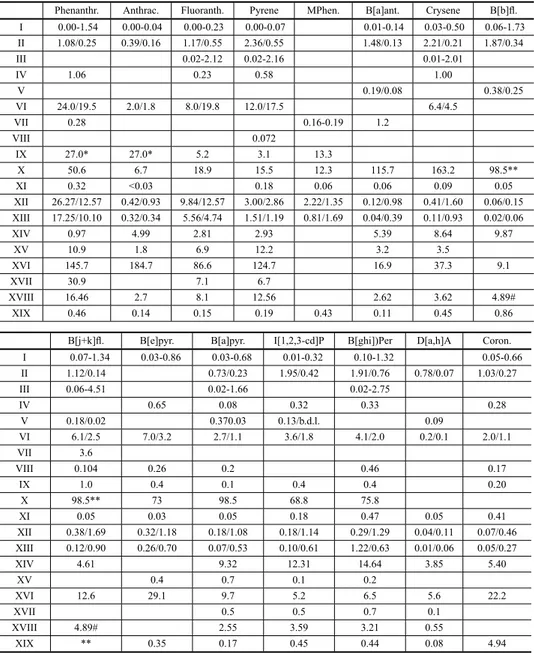
Comparison of PAH concentrations obtained at urban areas throughout the world (ng m-3). I – Santiago of Chile (Kavouras et al. 1999a); II – Birmingham, UK (Smith and Harrison 1996); III – Munich, Germany (Schnelle–Kreis et al. 2001); IV – Hong Kong, China (Zheng et al. 1997); V – Pavia, Italy (Minoia et al. 1997); VI – London, UK (Brown et al. 1996); VII – Portland, USA (Ligocki and Pankow 1989); VIII – Moe, Australia (Lyall et al. 1988); IX – Tokyo, Japan (Okuda et al. 2000); X – Temuco, Chile (Tsapakis et al. 2002); XI – Kuala Lumpur, Malaysia (Omar et al. 2002); XII – Fuji, Japan (Ohura et al. 2004); XIII – Shimizu, Japan (Ohura et al. 2004); XIV – Lahore, Pakistan (Smith et al. 1996); XV – São Paulo, Brazil (Martinis et al. 2002); XVI – Bravo Murillo, Las Palmas de Gran Canaria, Spain (Cancio et al. 2004); XVI –industrial park in Taichung, Taiwan (Fang et al. 2004); XVII – roadside, Hong Kong (Ho et al. 2002); XVIII – Seoul, Korea (Park et al. 2002); XIX – Athens, Greece (Mandalakis et al. 2002).
Phenanthr. Anthrac. Fluoranth. Pyrene MPhen. B[a]ant. Crysene B[b]fl. I 0.00-1.54 0.00-0.04 0.00-0.23 0.00-0.07 0.01-0.14 0.03-0.50 0.06-1.73 II 1.08/0.25 0.39/0.16 1.17/0.55 2.36/0.55 1.48/0.13 2.21/0.21 1.87/0.34
III 0.02-2.12 0.02-2.16 0.01-2.01
IV 1.06 0.23 0.58 1.00
V 0.19/0.08 0.38/0.25
VI 24.0/19.5 2.0/1.8 8.0/19.8 12.0/17.5 6.4/4.5
VII 0.28 0.16-0.19 1.2
VIII 0.072
IX 27.0* 27.0* 5.2 3.1 13.3
X 50.6 6.7 18.9 15.5 12.3 115.7 163.2 98.5**
XI 0.32 <0.03 0.18 0.06 0.06 0.09 0.05
XII 26.27/12.57 0.42/0.93 9.84/12.57 3.00/2.86 2.22/1.35 0.12/0.98 0.41/1.60 0.06/0.15 XIII 17.25/10.10 0.32/0.34 5.56/4.74 1.51/1.19 0.81/1.69 0.04/0.39 0.11/0.93 0.02/0.06
XIV 0.97 4.99 2.81 2.93 5.39 8.64 9.87
XV 10.9 1.8 6.9 12.2 3.2 3.5
XVI 145.7 184.7 86.6 124.7 16.9 37.3 9.1
XVII 30.9 7.1 6.7
XVIII 16.46 2.7 8.1 12.56 2.62 3.62 4.89#
XIX 0.46 0.14 0.15 0.19 0.43 0.11 0.45 0.86
B[j+k]fl. B[e]pyr. B[a]pyr. I[1,2,3-cd]P B[ghi])Per D[a,h]A Coron.
I 0.07-1.34 0.03-0.86 0.03-0.68 0.01-0.32 0.10-1.32 0.05-0.66
II 1.12/0.14 0.73/0.23 1.95/0.42 1.91/0.76 0.78/0.07 1.03/0.27
III 0.06-4.51 0.02-1.66 0.02-2.75
IV 0.65 0.08 0.32 0.33 0.28
V 0.18/0.02 0.370.03 0.13/b.d.l. 0.09
VI 6.1/2.5 7.0/3.2 2.7/1.1 3.6/1.8 4.1/2.0 0.2/0.1 2.0/1.1
VII 3.6
VIII 0.104 0.26 0.2 0.46 0.17
IX 1.0 0.4 0.1 0.4 0.4 0.20
X 98.5** 73 98.5 68.8 75.8
XI 0.05 0.03 0.05 0.18 0.47 0.05 0.41
XII 0.38/1.69 0.32/1.18 0.18/1.08 0.18/1.14 0.29/1.29 0.04/0.11 0.07/0.46 XIII 0.12/0.90 0.26/0.70 0.07/0.53 0.10/0.61 1.22/0.63 0.01/0.06 0.05/0.27
XIV 4.61 9.32 12.31 14.64 3.85 5.40
XV 0.4 0.7 0.1 0.2
XVI 12.6 29.1 9.7 5.2 6.5 5.6 22.2
XVII 0.5 0.5 0.7 0.1
XVIII 4.89# 2.55 3.59 3.21 0.55
XIX ** 0.35 0.17 0.45 0.44 0.08 4.94
al. 2000, Korfmacker et al. 1987, Perrini et al. 2005). The specific isomers of the nitro-PAH observed in am-bient air suggest that they are formed in the atmosphere through the gas-phase reactions of the 2- to 4-ring PAH (Schneider et al. 1990). Thus, ambient air contains nitro-PAH isomers distinct from the nitro-PAH electrophilic nitra-tion products reported in direct emissions. The nitro-PAH isomers not formed from electrophilic nitrations were observed, however, in laboratory simulations of the atmospheric reactions of the PAH, providing strong evi-dence for atmospheric formation of nitro-PAH (Atkinson and Arey 1994). The apprehension committed to mono-and dinitro-derivates of PAH is due to their ability to pro-voke direct mutagenic activity and to contribute for 10% to the total mutagenicity of inhalable suspended particles in polluted areas (Atkinson and Arey 1994, Marino et al. 2000). Though numerous nitro-PAH have been detected in atmospheric as well as emission particulates, nitrated pyrenes and fluoranthenes seem to be responsible of the main effect on health of humans (Marino et al. 2000).
The occurrence of 2-nitrofluoranthene and 2-nitro-pyrene in particulate matter collected in urban, subur-ban, forest and remote areas located in Europe, Amer-ica, Asia and Antarctica was investigated by Ciccioli et al. (1996). The results that were obtained confirm the photochemical origin of these components by gas-phase reactions with OH radicals and their ubiquitous occurrence in the troposphere. In addition, it was ver-ified that to disperse photochemically produced nitro-PAH in areas where their occurrence is somehow pre-vented, carbon particles can contribute to their forma-tion by providing a suitable surface for converting NO2 into nitrous and nitric acid by reaction with water. Bam-ford and Baker (2003) measured 26 nitro-PAH in an ur-ban and suburur-ban area of Baltimore. Concentrations of nitrated compounds produced from gas-phase reactions were significantly correlated with levels of NOx. The only nitro-PAH negatively correlated with NOxand cor-related with O3were 3-nitro- and 4-nitrophenanthrenes, suggesting a different formation mechanism. The rel-ative contribution of gas-phase reactions and primary emission sources of nitrated aromatics were evaluated using source specific concentration ratios of nitrofluo-ranthene and nitropyrene: 2-NF/1-NP and 2-NF/2-NP. It was concluded that the daytime OH-initiated reaction
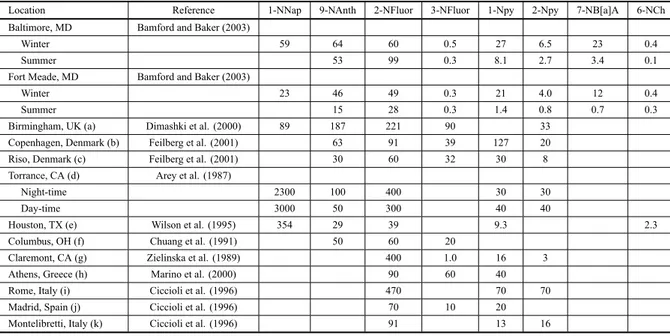
depo-TABLE IV
Comparison of atmospheric concentrations of selected nitro-PAH (pg m-3) measured in several locations around the world. 1-NNap (1-nitronaphthalene); 9-NAnth (9-nitroanthracene); 2-NFluor (2-nitrofluoranthene); 3-NFluor (3-nitrofluoranthene);
1-Npy (1-nitropyrene); 2-Npy (2-nitropyrene); 7-NB[a]A (7-nitrobenzo[a]anthracene); 6-NCh (6-nitrochrysene).
Location Reference 1-NNap 9-NAnth 2-NFluor 3-NFluor 1-Npy 2-Npy 7-NB[a]A 6-NCh
Baltimore, MD Bamford and Baker (2003)
Winter 59 64 60 0.5 27 6.5 23 0.4
Summer 53 99 0.3 8.1 2.7 3.4 0.1
Fort Meade, MD Bamford and Baker (2003)
Winter 23 46 49 0.3 21 4.0 12 0.4
Summer 15 28 0.3 1.4 0.8 0.7 0.3
Birmingham, UK (a) Dimashki et al. (2000) 89 187 221 90 33
Copenhagen, Denmark (b) Feilberg et al. (2001) 63 91 39 127 20
Riso, Denmark (c) Feilberg et al. (2001) 30 60 32 30 8
Torrance, CA (d) Arey et al. (1987)
Night-time 2300 100 400 30 30
Day-time 3000 50 300 40 40
Houston, TX (e) Wilson et al. (1995) 354 29 39 9.3 2.3
Columbus, OH (f) Chuang et al. (1991) 50 60 20
Claremont, CA (g) Zielinska et al. (1989) 400 1.0 16 3
Athens, Greece (h) Marino et al. (2000) 90 60 40
Rome, Italy (i) Ciccioli et al. (1996) 470 70 70
Madrid, Spain (j) Ciccioli et al. (1996) 70 10 20
Montelibretti, Italy (k) Ciccioli et al. (1996) 91 13 16
(a) Mean of 25 samples, Nov. 1995-Feb. 1996; (b) Mean of 20 winter-spring samples, 1996; (c) Mean of 14 samples, Feb. 1998-1999; (d) Mean of 6 samples collected 20 km south of Los Angeles, Jan.-Feb. 1985; (e) Mean of 19 samples measured between Aug. 1990-1991; (f) winter 1986/97; (g) Mean of 6 samples collected 30 km northeast of central Los Angeles; Sept. 1995; (h) Mean of 32 samples, Jan.-Dec. 1996; (i) Mean of 10 samples, Sept. 1991; (j) Mean of 14 samples, Oct. 1990; (k) Mean of 22 samples, Feb. 1988-Dec. 1994.
sition, and air–water exchange. The concentration and deposition levels of a PAH compound are influenced by the composition and strength of the emissions, the tur-bulence and the removal process type. There are two main removal mechanisms, including dry and wet de-position, in the atmosphere. Dry deposition refers to the transfer of both gaseous and particulate to a surface including soil, water, and vegetation when there is no precipitation (Tasdemir and Esen 2007). Wet deposition of airborne PAH occurs with the scavenging of particles by, and partitioning of organic vapour into, rain and snow (Sahu et al. 2004). A comparison of different methods for measuring deposition fluxes of particulate matter and PAH in the ambient air can be found in Shannigrahi et al. (2005). Besides the atmospheric loss/removal pro-cesses, the PAH air concentrations are controlled by a complex array of variables, some of which may also in-fluence the seasonality in ambient levels. These vari-ables include secondary sources of PAH into the
(Hou et al. 2006, Hung et al. 2005, Tamamura et al. 2007).
HOMOLOGOUSCOMPOUNDSERIES
Aliphatic hydrocarbons, particularly normal alkanes, represent ubiquitous organics which are released into the atmosphere by many sources, rendering difficult the association between the levels of different compounds and their origin. Selected mass fragmentograms forn -alkanes can be obtained by searching m/z 85 or 99. Usually, the homologous compound distributions ofn -alkanes in atmospheric aerosols range from C12to C40. The higher molecular weights with an odd carbon num-ber represent typical n-alkanes attributable to natural plant waxes (Abas and Simoneit 1996, 1997). It should be referred that the layer of the plant cuticles comprises long-chain, usually saturated aliphatic molecules with even-carbon called epicuticular waxes. The wax layer could be composed of up to 100 normal saturated hydro-carbons, grouped into at least 12 substituent classes hav-ing different functional groups (Günthardt-Goerg 1994). Epicuticular waxes form a bloom on the surface con-sisting of wax protrusions that are characteristic of each plant species (Rogge et al. 1993e). The epicuticular wax layer ranges from only a few nanometres to a few mi-crons in thickness. Due to its position at the leaf surface, composition can certainly be altered by environmental factors, such as rain, wind, high temperatures and air pollutants, such as ozone (Percy et al. 1994). Plant wax lipids could be released, for example, by both a dust blasting effect on plant surfaces and wind abrasion caus-ing sloughcaus-ing of wax directly (Percy et al. 1994). The dominance of then-C27,n-C29andn-C31homologs gen-erally observed during summer shifted towards lower carbon numbers in the range n-C21-n-C25 during the colder season. Changes in the modal chain-length ofn -alkane distributions have been attributed to differences in growing-season temperatures of the source regions (Si-moneit et al. 1991a). However, Schefuß et al. (2003) suggest a large influence of the regional precipitation regime on the chain-length distributions of leaf-wax lipids, in agreement with their biologic functionality as regulators of the plant moisture balance.
Linear alkanones and alkanals are a group of oxy-genated compounds identified in aerosols. The
distri-bution diagrams are given by them/z58 and 82 of the GC/MS analysis, respectively. Then-alkan-2-ones<C20 may in part be derived from anthropogenic activity (Se-infield and Pandis 1998, Simoneit et al. 1988) or from atmospheric oxidative processes (Simoneit et al. 1988). In some cases, the possible absence of alkanals of higher masses (>C20)may reflect their reactivity to oxidation yielding alkanoic acids. Long chainn-alkan-2-ones are typically found in the waxy portion of the plant materi-als. The homologous series may range from C8to C38. Then-alkanals with odd carbon number higher than 20 are of biogenic origin, whereas the lower compounds in-dicate oxidation of alkanes as possible precursors (Gogou et al. 1996). Aldehydes may occur in the epicuticular waxes as a result of the reaction of O3 on unsaturated hydrocarbons (Garrec 1994).
Typical distributions of n-alkanols range from C10 to C36. The selected mass fragmentograms for the corresponding trimethylsilyl ethers that result from the derivatisation process is plotted by searching the m/z 75. Even-to-odd carbon number predominance is found in aerosols with a major biogenic contribution. The ho-mologs<C20are not found in fresh vascular plant waxes and may have a microbial origin. The homologs>C20 may derive from epicuticular vegetation (Abas and Si-moneit 1996, 1997).
et al. 1988). Other biogenic contributors are fungi, bacteria, spores, pollen and algae (Rogge et al. 1993e). Lower molecular weights for n-alkanoic acids (<C18) were found in emissions from petroleum-based sources such as gasoline- and diesel-powered vehicle exhaust or from distillate fuel oil, tire wear debris and road dust (Rogge et al. 1993a). The synthesis of n-fatty acids in plant leaves is practically identical to the synthesis ofn-alkanes. These compounds proceed via elongation and descarboxylation reactions involving C16 and C18
n-fatty acids (Rogge et al. 1993e). Contrary to plant epicuticular wax, seeds (and seed oils, e.g. cooking oil), plant organelles, leaf cells, chloroplast and pollen contain predominantlyn-C16,n-C18, mono-unsaturated (Cn:1), di-unsaturated (Cn:2)and poly-unsaturated fatty acids (Rogge et al. 1993b). It should be noted that the unsaturated fatty acids are indicators of recent biogene-sis (Simoneit et al. 1988, Abas and Simoneit 1996).
Unsaturatedn-fatty acids (alkenoic acids) are emit-ted to the atmosphere from microbial sources and from the processing, degradation and combustion of plant and animal constituents (Rogge et al. 1993e). Meat cooking is an important source ofn-alkenoic acids, mainly oleic (C18:1)and palmitoleic acid (C16:1)(Rogge et al. 1991). Phytoplankton and bacteria also contain a number of unsaturated fatty acids (Rogge et al. 1993e, Simoneit et al. 2004a). Biomass burning presents, in general, as primary components palmitic (C16:0)and stearic (C18:0) acids (e.g. Oros and Simoneit 1999). Once emitted into the atmosphere, unsaturated fatty acids, which are indi-cators of recent biogenesis (Simoneit et al. 1991a), are likely to be attacked by free radicals, ozone and other oxidants, producing aldehydes, lower weight carboxylic acids and dicarboxylic acids (Rogge et al. 1993e). One method that has been used to gauge the age of aerosol is to take the ratio between the concentrations of the saturated C18 alkanoic acid (C18:0) and the mono-un-saturated C18acid (C18:1). This ratio is used as an aerosol age indicator since the mono-unsaturated acid breaks down much faster by atmospheric oxidation than the sat-urated analogue. The abundance of the satsat-urated acid compared to the mono-unsaturated homologue can, therefore, indicate a relative decomposition rate (Brown et al. 2002). Values between 5 and 11, with an average of 6.6, for the C18:0/C18:1 ratio were reported for rural
samples collected in remote Big Bend National Park, Texas. These high, rural-like ratios were ascribed to a combination of local rural biogenic emissions and aged aerosol advected from urban areas (Brown et al. 2002). While stearic and palmitic acids are, as individual com-pounds, not source specific, the C18:0/C16:0 fatty acid ratio is unique and can be used in source apportionment studies. The major contributors for particulate matter have C18:0/C16:0 ratios ranging from 0.17 to 0.71, de-pending on source type. In countries where dried cattle dung is used for cooking purposes, fine particulate smoke presents the characteristically elevated ratio around 2, whereas for foliar vegetation or wood smoke and car ex-haust, values below 0.5 are typical. The surface soil and dusts from feedlots and open lot dairy farms showed an average C18:0/C16:0ratio of 3.0. Values between 0.5 and 1 were also found in agricultural fields, dust from paved and unpaved roads and in PM2.5of rural and ur-ban sources, such as hamburger charbroiling (Rogge et al. 2006 and references therein).
combus-tion engines. Rogge et al. (1991) reported meat cook-ing as an emission source of C4-C8dicarboxylic acids, pointing out the importance of adipic acid (hexanedioic). Pereira et al. (1982) identified dicarboxylic acids ranging from C4 to C9in airborne ash resulting from pyrolysis of organic soil constituents, plants and trees. Acids in the range C10-C24 have been stressed by Simoneit and Mazurek (1982) as possible oxidation products of hy-droxy acids from vegetation.
Table V presents the levels of the homologous com-pound series in atmospheric aerosols from different en-vironments all over the world. Fatty acids andn-alkanes, followed byn-, are the dominant organic classes. The homologous compounds associated with fossil fuel and biomass burning may be up to 30 times more abundant in winter that in summer due to stronger emissions dur-ing the cold season (Wang et al. 2006b). The increase in concentrations during winter could also be related to the fact that lower winter temperatures promote the de-crease of mixing heights and the existence of inversion layers, leading to poorer dispersion and diminishing the dilution factors and, therefore, conducting to an increase of atmospheric pollutant concentrations. On the other hand, as some compounds have a highly temperature dependent gas/particle partitioning coefficient, the high summer temperature could promote their displacement from particulate to gas phase, decreasing their aerosol phase concentrations (Oliveira et al. 2007a). In China, concentrations of the homologous organic classes are generally 1-3 orders of magnitude higher than in devel-oped countries (Wang et al. 2006b). The levels mea-sured in the background marine atmosphere over the north Atlantic are lower than those measured in the Mediterranean and of the same order as those reported for the remote Chichi-Jima Island in the western Pa-cific. In contrast, the concentrations are higher than those registered in the aerosol of Enewetak Atoll, north Pacific. Hydrocarbon concentrations ranging from 30 to 2800 ng m−3were found by Simoneit et al. (1991b) over the south Atlantic. The highest values were observed when approaching part of Tierra del Fuego, where exten-sive petroleum production occurred. The highn-alkane concentrations (0.3–680 ng m−3)found by Simoneit and Elias (2000) in samples of particulate matter from the at-mosphere over the Atlantic along the South American
and African continents were associated to epicuticular wax components of continental vegetation, which are in-troduced into the aerosols mainly by direct emission due to abrasive and related processes. However, long-range transport of smoke from biomass burning off the conti-nents was also found an important factor influencing the composition of marine aerosols (Alves et al. 2007).
MOLECULARMARKERS
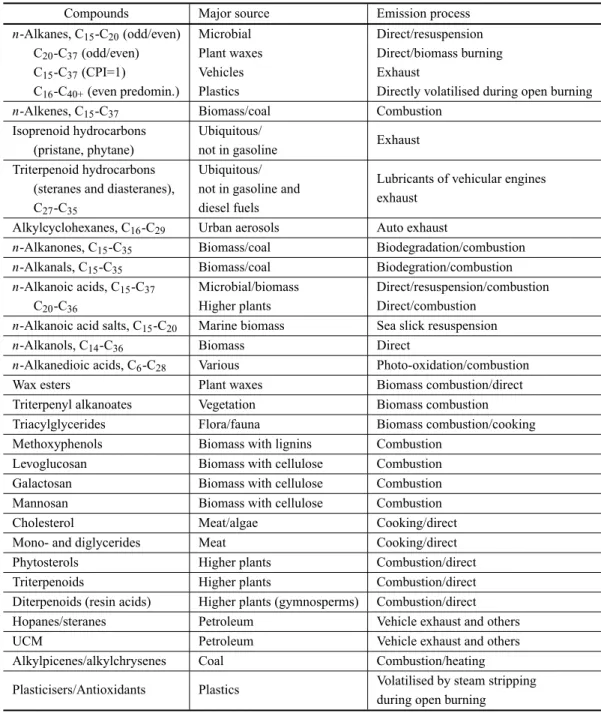
The assessment of naturalversusanthropogenic contri-butions to the carbonaceous aerosol is often done by searching molecular markers or tracers, which include organic compounds that are source specific, react slowly in the atmosphere and do not change to gas-phase dur-ing the transport. Numerous compounds were identi-fied and quantiidenti-fied in the atmospheric samples, includ-ing cigarette smoke components, vehicle exhaust mark-ers, meat smoke tracmark-ers, combustion products of plastics, coal burning emissions, phytosterols of higher photosyn-thetic plants and wood smoke constituents (Table VI).
Tobacco smoke
It has been pointed out that the major tracers for to-bacco smoke in the urban atmosphere are 2-methyl- (iso-) and 3-methylalkanes (anteiso-alkanes) ranging from C29 to C34(Kavouras et al. 1998a, Morrical and Zenobi 2002, Rogge et al. 1994). Their mass spectra contain the typ-ical fragmentation pattern (M•+– [C
.
±
.
.
±
.
≤
.
±
.
TABLE VI
Specific tracers for organic components in atmospheric aerosols.
Compounds Major source Emission process
n-Alkanes, C15-C20(odd/even) Microbial Direct/resuspension
C20-C37(odd/even) Plant waxes Direct/biomass burning
C15-C37(CPI=1) Vehicles Exhaust
C16-C40+(even predomin.) Plastics Directly volatilised during open burning
n-Alkenes, C15-C37 Biomass/coal Combustion
Isoprenoid hydrocarbons Ubiquitous/
Exhaust (pristane, phytane) not in gasoline
Triterpenoid hydrocarbons Ubiquitous/
Lubricants of vehicular engines (steranes and diasteranes), not in gasoline and
exhaust
C27-C35 diesel fuels
Alkylcyclohexanes, C16-C29 Urban aerosols Auto exhaust
n-Alkanones, C15-C35 Biomass/coal Biodegradation/combustion
n-Alkanals, C15-C35 Biomass/coal Biodegration/combustion
n-Alkanoic acids, C15-C37 Microbial/biomass Direct/resuspension/combustion
C20-C36 Higher plants Direct/combustion
n-Alkanoic acid salts, C15-C20 Marine biomass Sea slick resuspension
n-Alkanols, C14-C36 Biomass Direct
n-Alkanedioic acids, C6-C28 Various Photo-oxidation/combustion
Wax esters Plant waxes Biomass combustion/direct
Triterpenyl alkanoates Vegetation Biomass combustion
Triacylglycerides Flora/fauna Biomass combustion/cooking
Methoxyphenols Biomass with lignins Combustion
Levoglucosan Biomass with cellulose Combustion
Galactosan Biomass with cellulose Combustion
Mannosan Biomass with cellulose Combustion
Cholesterol Meat/algae Cooking/direct
Mono- and diglycerides Meat Cooking/direct
Phytosterols Higher plants Combustion/direct
Triterpenoids Higher plants Combustion/direct
Diterpenoids (resin acids) Higher plants (gymnosperms) Combustion/direct
Hopanes/steranes Petroleum Vehicle exhaust and others
UCM Petroleum Vehicle exhaust and others
Alkylpicenes/alkylchrysenes Coal Combustion/heating
Plasticisers/Antioxidants Plastics Volatilised by steam stripping
during open burning
to be present at a concentration of 0.28–0.36µg m−3in the Los Angeles outdoor air, accounting for 1.0-1.3% of the fine particle mass concentration (Rogge et al. 1994).
Vehicle emission markers
Petroleum molecular markers are specific indicator compounds mainly present in the hydrocarbon fractions.
These kind of tracers may include the 17α(H), 21β (H)-hopane series, the 5α(H), 14α(H), 17α(H) and 5α (H),-14β(H), 17β(H)-sterane series, alkylcycloalkanes, the isoprenoids pristane and phytane, as well as the chro-matographic unresolved complex mixture (Gogou et al. 1996, Simoneit 1984, 1999, Simoneit et al. 1991a).
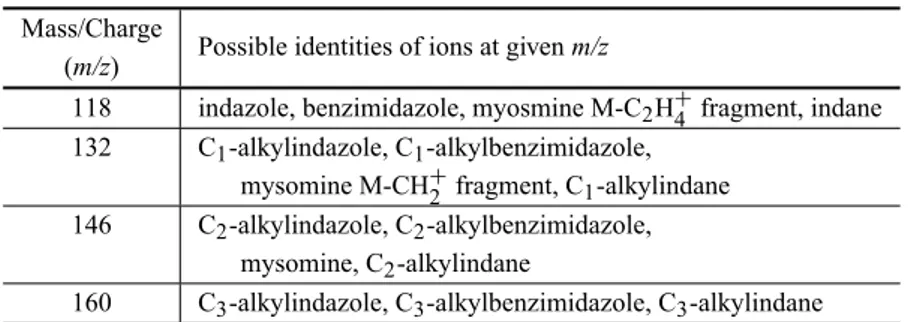
TABLE VII Cigarette specif tracers. Mass/Charge
Possible identities of ions at givenm/z (m/z)
118 indazole, benzimidazole, myosmine M-C2H+4 fragment, indane
132 C1-alkylindazole, C1-alkylbenzimidazole,
mysomine M-CH+
2 fragment, C1-alkylindane
146 C2-alkylindazole, C2-alkylbenzimidazole,
mysomine, C2-alkylindane
160 C3-alkylindazole, C3-alkylbenzimidazole, C3-alkylindane
petroleum residue contamination (Simoneit 1984, Si-moneit et al. 1991a). Generally, the distribution patterns of petroleum biomarkers show that the 17α(H),21β (H)-hopane series is the predominant group, ranging from C27to C35with the homologs>C29present as the typi-cally mature C-22 R/S pairs (Simoneit et al. 1990). Dis-tributions showing concentrations of the 22S hopanes higher than those for the corresponding 22R pairs are commonly found in aerosols emitted by gasoline and diesel engines. Biogenic precursors contain only the 22R configuration (Zheng et al. 1997). Steranes are intro-duced into the atmosphere from lubricants of vehicular engines, but they are not found in gasoline or diesel fuel (Abas and Simoneit 1996).
Paraffinic components of petroleum, alkylcyclo-alkanes, could be identified in the particulate matter, by searchingm/z82 andm/z68-69 typical masses, respec-tively, for alkylcyclohexanes and alkylcyclopentanes. Vehicular traffic with the associated fuels and lubricants emit these compounds into the ambient atmosphere. The presence of unsaturated hydrocarbons like pristane (2,6,10,14-tetramethylpentadecane) and phytane (2,6,-10,14-tetramethylhexadecane) is consistent with fossil fuel sources of carbon in the range of C16-C20, which is approximately the distillation range of diesel fuels (Abas and Simoneit 1996, Aceves and Grimalt 1992, Azevedo et al. 2002, Fraser et al. 1997, Rogge et al. 1997a, Zheng et al. 1997). Pristane and phytane result from the dia-genesis of phytol and are not primary components of the majority of terrestrial living organisms (Simoneit 1984). Biogenic inputs are often dominated by a predominance of the odd carbon alkanes and the C17isoprenoid (pris-tane). Since phytane is rarely found in biological ma-terial (except some bacteria), most biological
hydrocar-bons have a Pr/Ph ratio>>1.0. Low Pr/Ph ratios indi-cate a hydrocarbon signature derived from petrochemical use. It should be noted, however, that the identification of compounds such as pristane and phytane in atmospheric samples are dependent on the sampling period. Simoneit et al. (2004a) referred to the volatile compound blow-off from the filters over a 1–2-day acquisition time and the consequent depletion of aliphatics<C21, and therefore of the petroleum tracers.
and other major components (Azevedo et al. 1999). U:R values for rural, mixed and urban samples are 0.2–4, 1.4–3.4 and 0.9–25, respectively (Azevedo et al. 2002). An U:R value>>1 indicates considerable contributions from petroleum combustion sources; pure hydrocarbon mixtures from plant waxes have U:R<0.1, i.e. they have no UCM. Generally, urban aerosols contain the largest component of petroleum-derived compounds, while ru-ral and mixed ruru-ral/urban environments show variable contributions of anthropogenic pollutants. The average U:R ratio for conifer smoke (1.0) suggests that the UCM of rural aerosol particles from the western United States consists mainly of recent (immature) organic matter de-rived from conifer and perhaps other biomass combus-tion source emissions, such as grass smoke released from agricultural field burning, and less pronounced fossil fuel combustion emissions (Oros and Simoneit 2001a). Several U:R ratios have been determined from more mature fossil fuel derived combustion emission sources which include the following: lignite coal = 3.2 and bi-tuminous coal = 3.3 (Oros and Simoneit 2000); catalyst-equipped automobile engine exhaust = 5.5 and heavy-duty diesel truck engine exhaust = 9.3 (Rogge et al. 1993d). Thus, the lower U:R ratio of conifer smoke shows that this parameter is useful for distinguishing be-tween conifer biomass burning and fossil fuel derived combustion source emissions. Ultimately, the U:R ratio may be used as an indicator for identifying atmospheric transport trajectories from regional biomass burning and fossil fuel combustion emission containing air parcels. This is especially useful for determining the contribu-tions of organic matter derived from ruralversusurban emission sources (Oros and Simoneit 2001a).
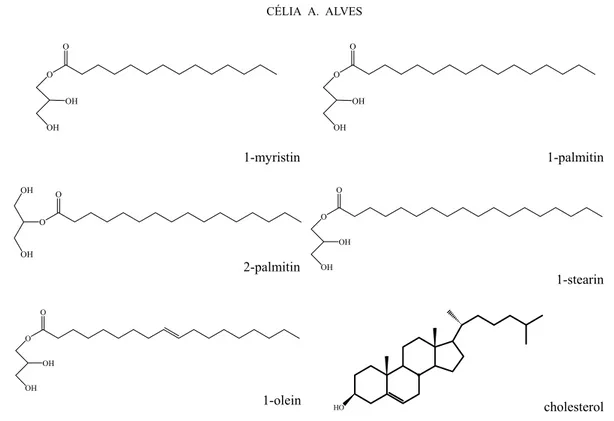
Meat smoke
During the cooking process, triglycerides from the fat can be hydrolysed or thermally oxidised, producing free glycerol, mono- and diglycerides and free fatty acids (Nolte et al. 1999). The emission rates of these com-pounds can be found in Schauer et al. (1999a) and Nolte et al. (1999). Meat cooking operations were con-sidered to be a major source of organic aerosol emis-sions to the urban atmosphere, comprising up to 21% of the primary fine organic carbon particle emissions in the Los Angeles area (Rogge et al. 1991).
Promi-nent among the compounds emitted aren-hexadecanoic acid (i.e., palmitic acid),n-octadecanoic acid (i.e., stearic acid),cis-9-octadecenoic acid (i.e., oleic acid), nonanal, 2-octadecanal, 2-octadecanol, saturated monoglycerides and cholesterol. However, the majority of these com-pounds, and especially fatty acids, are emitted from so many sources in addition to meat smoke that data on their concentration alone is insufficient to determine the quantity of meat smoke aerosol in ambient air (Nolte et al. 1999). The presence of cholesterol in oceanic aerosols more likely indicates an input from marine sources such as algae, which also can contribute to continental choles-terol sources in environments downwind from lacustrine areas (Simoneit and Elias 2001). The presence of choles-terol in particles has been associated with sea spray de-riving from secretions of aquatic organisms (Alves et al. 2007, Fine et al. 2004b). The sea spray explanation is supported by the occurrence of cholesterol predomi-nantly in the larger particles (Fine et al. 2004b).
The C16 monoglycerides, 1-palmitin and 2-palmi-tin, dominate in meat smoke aerosols, but there are also significant emissions of C18 (1-stearin) and C18:1 (1-olein) monoglycerides (Nolte et al. 1999). Although cholesterol can be emitted from other sources, concen-trations measured in the West Los Angeles atmospheric aerosol were consistent with the cholesterol mass emis-sion rates calculated from meat cooking source tests. Thus, a group of compounds (Fig. 2), instead a single tracer, was considered to be more useful as an indicator of the quantity of meat smoke in the atmosphere. Of this assemblage, cholesterol seems to be most suitable, com-plemented by monoglycerides and perhaps oleic acid in the exact proportionalities (Nolte et al. 1999, Robinson et al. 2006b).
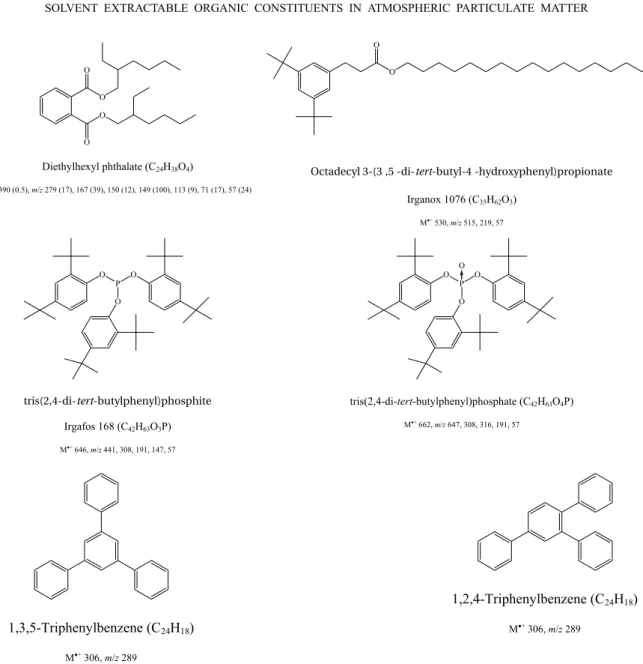
Tracers for the open burning of plastics
O O
OH
OH
1-myristin O
O
OH
OH
1-palmitin
O O OH
OH
2-palmitin O
O
OH OH
1-stearin
O O
OH OH
1-olein HO cholesterol
Fig. 2 – Chemical structures of constituents detected in meat smoke.
the open-fire combustion of plastics that can be used to detect episodes of plastic refuse burning were studied (Simoneit et al. 2005). Plastics consisting above all, but not entirely, of polyethylene plastic bags, were hand-picked from the roadside and landfills, and analysed in two ways. The amounts of extractable compounds in the hexane extracts and smoke particles were 29-43 and 5.4-17.5 mg g−1of plastic, respectively. The most im-portant compounds extracted from the plastics were plas-ticisers, antioxidants andn-alkanes with an even carbon number (C16-C40), derived from the polymerisation of ethylene. Dialkyl esters of benzene-dicarboxylic acids (phthalates) are representative of plasticisers, which are widespread in the environment. The principal plasti-ciser was bis(2-ethylhexyl) phthalate (DEHP), a probable human carcinogen, with minor amounts of other phtha-lates, which are also suspected health risks (Fig. 3). In the smoke particles, the main compounds found were terephthalic acid, 4-hydroxybenzoic acid, and the ph-thalates. n-Alkanes were found once more, but with no carbon number predominance, indicating incomplete combustion and thermal cracking of polyethylene. The researchers proposed the minor components
1,3,5-tri-phenylbenzene (TPB) and tris(2,4-di-tert-butylphenyl) phosphate (TDPP) as candidate marker compounds be-cause it was considered that they are not usually detected in the atmosphere. This hypothesis was confirmed by matching up to aerosol particulate matter from regions where plastic and refuse are burnt in open fires (Santi-ago, Chile; Saporo, Japan; Gosan Island, Korea) with that from areas supposed to be clean (Los Angeles, CA; Corvallis, OR). Both TPB and TDPP were found in the locations where open-fire burning of plastics is frequent, but were lacking from the areas apparently uncontam-inated. Santiago presented the highest plastic marker content (613-6920 ng m−3of DEHP; 7-132 ng m−3of Irganox 1076), which is in agreement with the greater occurrence of garbage, litter and plastic-related combus-tion compared with the other cities. The plastic tracers were undetectable or present at much lower levels than those of Chile in the particulate matter from the other places.
evap-O O
O
O
Diethylhexyl phthalate (C24H38O4)
M+ 390 (0.5), m/z279 (17), 167 (39), 150 (12), 149 (100), 113 (9), 71 (17), 57 (24)
O O
Octadecyl 3-(3,5-di-tert-butyl-4-hydroxyphenyl)propionate
Irganox 1076 (C35H62O3)
M+ 530, m/z 515, 219, 57
O P
O
O
tris(2,4-di-tert-butylphenyl)phosphite
Irgafos 168 (C42H63O3P)
M+ 646, m/z 441, 308, 191, 147, 57
O P
O
O O
tris(2,4-di-tert-butylphenyl)phosphate (C42H63O4P)
M+ 662, m/z 647, 308, 316, 191, 57
1,3,5-Triphenylbenzene (C24H18)
M+ 306, m/z 289
1,2,4-Triphenylbenzene (C24H18)
M+ 306, m/z 289
Fig. 3 – Chemical structures of organic tracers in smoke from burning plastics and characteristic mass spectra. For the dominant plasticiser, ions are listed asm/zwith relative intensities following in parentheses.
orative realise from plastics, followed by adsorptive de-position on pre-existing particles (Wang et al. 2006b). Phthalate levels in China are 1-3 orders of magnitude higher than those in the Swedish (Thuren and Larsson 1990), Belgian (Kubátová et al. 2002) and French (Teil et al. 2006) atmospheres. Taking into account their ubiqui-tous and abundant occurrences, as well their carcinogenic and endocrine-disrupting characteristics, the determina-tion of plasticiser markers in atmospheric environments will be helpful in measuring the degree of plastic burn-ing and will assist in establishburn-ing air pollution control programs.
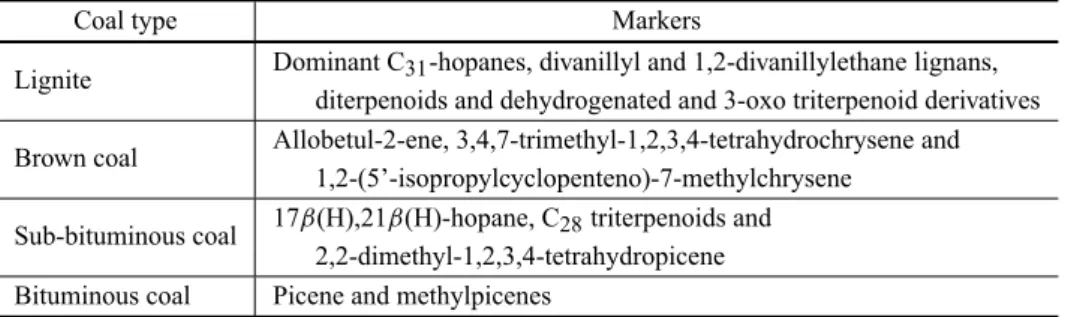
Tracers in coal smoke
and an increase in the homohopane index [S/(S+R)] with increasing rank. In general, the U/R and the 17α (H),-21β(H)-hopane to 22R-17α(H),21β(H)-homohopane ra-tios characteristic of coal smoke are in the range 2.9– 3.3 and 0.05–0.35, respectively. The generic markers for coal smoke emissions comprise a series of C27 to C31 hopanes (no C28), phenolics, C2-picenes and C2 -hydropicenes (Oros and Simoneit 2000). The source specific markers are listed in Table VIII.
Tracers for wood burning, vegetation and other natural inputs
Most of the tracer molecules from vegetation are phytos-terols and terpenoids, including sesquiterpenoids, diter-penoids and triterditer-penoids with 3, 4 and 5 isoprene units, respectively. Phytosterols are sterols of higher photo-synthetic plants originated by a biophoto-synthetic pathway of cyclisation, where squalene is the precursor (Kozlowski and Pallardy 1997, Simoneit et al. 1991a), which can be selected by searchingm/z129. Besides the precursor, the most common phytosterols that have been found in the solvent-extractable fraction of organic aerosols, de-rived from vegetation waxes and plant lipid membranes (Oros and Simoneit 2001a, b), consist of ergosterol (C27), campesterol (C28), sitosterol (C29)and stigmas-terol (C29). Whereas sitosterol and stigmasterol are in-dicators for vegetation in general, campesterol has been pointed out as a specific molecular tracer for gramineae (Simoneit 2002). Different carbon number distributions have been obtained in distinct experiments, suggesting that the phytosterol patterns may be related to geograph-ical characteristics, particularly, the specific plant com-munities and the climatic conditions. For example, aero-sol samples from both rural and urban western United States compare with C27 >C29 >C28 distribution of the wax from the Sierra Nevada vegetation or Oregon coastal forest (Simoneit 1989). For aerosol samples from Nigeria, an inverted ordering was encountered, where the pattern C29 >C27 >C28 was evident. This distri-bution correlated with the predominance of wax compo-nents from the Nigerian and desert vegetation and also from grass (Simoneit et al. 1988). The Nigerian phy-tosterol pattern coincides with that of aerosol samples and composites from the Amazon region (Simoneit et al. 1990). In aerosols from a Portuguese semi-rural area and
from a GreekAbiesforest, the C28 phytosterol was not present at detectable levels and a C27 >C29distribution was observed (Alves and Pio, in press).
Sesquiterpenoid compounds possess in their struc-tures the cadinane skeleton, an important constituent of resin plants (Simoneit and Mazurek 1982). Some sesqui-terpenoids of lower volatility have been detected in aero-sols from rural locations, including bicyclic (e.g. caryo-phyllene, cadalene and calamenene) and tricyclic (e.g. longifolene, copaene and patchoulol) constituents (Alves and Pio, in press, Pio et al. 2001b).
Diterpenoid components derive from the steroid skeletons of abietane and pimarane, which are the ma-jor constituents produced by higher plants, especially conifers (Standley and Simoneit 1994). Oxidation, poly-merisation, disproportionation and aromatisation reac-tions of these unstable diterpenoids produce secondary compounds, such as resin acids (Pio et al. 2001a, Simo-neit and Mazurek 1982). Retene (1-methyl-7-isopropyl-phenanthrene), a completely dehydrogenated resin diter-penoid, is a pyrolysis end product from diterpenoids that have the abietane or pimarane skeletons and has been proposed as molecular tracer for coniferous wood com-bustion (Ré-Poppi and Santiago-Silva 2002, Rogge et al. 1998, Simoneit and Mazurek 1982, Standley and Si-moneit 1994).
TABLE VIII
Dominant source-specific molecular markers for smoke from each coal type.
Coal type Markers
Lignite Dominant C31-hopanes, divanillyl and 1,2-divanillylethane lignans, diterpenoids and dehydrogenated and 3-oxo triterpenoid derivatives
Brown coal Allobetul-2-ene, 3,4,7-trimethyl-1,2,3,4-tetrahydrochrysene and 1,2-(5’-isopropylcyclopenteno)-7-methylchrysene
Sub-bituminous coal 17β(H),21β(H)-hopane, C28triterpenoids and 2,2-dimethyl-1,2,3,4-tetrahydropicene Bituminous coal Picene and methylpicenes
to the aerosol, or from combustion of wood (Graham et al. 2004, Standley and Simoneit 1994). This compound was not identified in aerosols from Nigeria and Amazo-nia, in accordance with the absence of conifer vegetation in those regions (Simoneit et al. 1988, 1999). In cities where wood is used for heating, ambient dehydroabi-etic acid concentrations ranged from 48 to 440 ng m−3 (Standley and Simoneit 1994). The compound was also detectable in oceanic samples at concentrations ranging from 0.0001 to 0.4 ng m−3, whereas in terrestrial aerosol particulate matter, it was present at much higher levels (0.23-440 ng m−3). The presence of this tracer in atmo-spheric matter over the ocean confirmed the long-range transport of smoke from biomass burning of the conti-nents (Simoneit and Elias 2001).
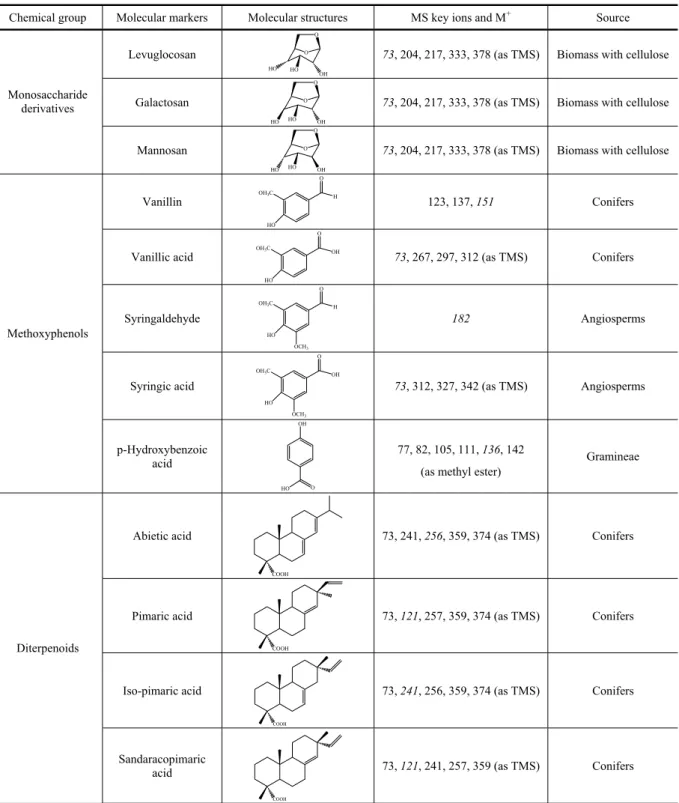
In smoke samples from biomass combustion (Table IX), triterpenoids are used as organic tracers for the con-tribution of directly volatilised natural constituents from vegetation (Elias et al. 1997). The most encountered triterpenoids in plants areα-amyrin,β-amyrin and their derivatives. These pentacyclic triterpenes have been con-sidered tracers for angiosperm waxes, especially in their gums and mucilages (Oros and Simoneit 2001a, b). Their biosynthesis proceeds from squalene-2,3-epoxide to the basic ursane and oleanane skeletons and further oxida-tive steps lead to triterpenic acids and other pentacyclic oxygenated compounds (Simoneit 1989). Simoneit et al. (1991c) found various triterpenoids in aerosols from mountainous regions and from the southeast coast of Australia. Global yields ranged from 0.4 to 6 ng m−3. The same investigators detected amyrinols, at trace lev-els, in aerosol samples taken from Amazonia (Simoneit et al. 1990). Alves and Pio (in press) detected triterpenic oxygenated compounds such as amyrinol and
deriva-tives in aerosols from Portuguese and Greek rural ar-eas. In smoke aerosol from Amazonia, high molecu-lar weight components consisting of a series of wax es-ters (long chain alcohols esterified with long chain fatty acids) with up to 58 carbon numbers, triglycerides and triterpenyl esters (e.g. α- and β-amyryl stearate) were detected (Elias et al. 1997, 1998). Some of the struc-tures are represented in Figure 4.
par-TABLE IX
Molecular tracers for biomass burning aerosols.
Chemical group Molecular markers Molecular structures MS key ions and M+ Source
Levuglocosan O
HO HO OH O
73, 204, 217, 333, 378 (as TMS) Biomass with cellulose
Galactosan O
HO HO OH O
73, 204, 217, 333, 378 (as TMS) Biomass with cellulose
Monosaccharide derivatives
Mannosan O
HO HO OH O
73, 204, 217, 333, 378 (as TMS) Biomass with cellulose
Vanillin
HO OH3C
O
H
123, 137, 151 Conifers
Vanillic acid
HO OH3C
O
OH
73, 267, 297, 312 (as TMS) Conifers
Syringaldehyde
HO OH3C
O
H
OCH3
182 Angiosperms
Syringic acid
HO OH3C
O
OH
OCH3
73, 312, 327, 342 (as TMS) Angiosperms
Methoxyphenols
p-Hydroxybenzoic acid
OH
HO O
77, 82, 105, 111, 136, 142
(as methyl ester)
Gramineae
Abietic acid
COOH
73, 241, 256, 359, 374 (as TMS) Conifers
Pimaric acid
COOH
73, 121, 257, 359, 374 (as TMS) Conifers
Iso-pimaric acid
COOH
73, 241, 256, 359, 374 (as TMS) Conifers
Diterpenoids
Sandaracopimaric acid
COOH
73, 121, 241, 257, 359 (as TMS) Conifers
ticulate matter (Alves and Pio, in press). Furan deriva-tives (e.g. 2-acetylfuran, 2-furanmethanol) have been de-scribed as minor constituents of smoke and attributed to
TABLE IX (Continuation)
Chemical group Molecular markers Molecular structures MS key ions and M+ Source
Dehydroabietic acid
COOH
73, 239, 357, 372, (as TMS) Conifers
Pimanthrene 191, 206 Conifers
Diterpenoids
Retene 219, 239 Conifers
–Amyrin
HO
73, 189, 203, 218, 393, 483, 488
(as TMS)
Angiosperms
–Amyrin
HO
73, 189, 203, 218, 393, 483, 498
(as TMS)
Angiosperms Triterpenoids
Lupeol CH3 CH3
HO H3C CH3
H H
CH3
CH3 H C CH3 H2C
189, 203, 218, 231, 279, 369,
408, 483, 498 (as TMS)
Angiosperms
–Sitosterol
HO
CH2CH3
137, 151, 167, 181, 402 All biomass
sources
Stigmasterol
HO
83, 129, 255, 394, 469, 484
All biomass sources Phytosterols
Campesterol
HO
73, 129, 343, 367, 382, 457, 472
(as TMS)
TRITERPENYL ALKANOATES
o o
amyryl palmitate
o o
Taraxasteryl palmitate
TRIGLYCERIDES
C15H31
O O
O
O
O O
C15H31 C17H33
Dipalmitoylolein
C15H31
O O
O
O
O O
C17H33 C17H35
1-Palmitoyl-2-oleoyl-3-stearin
C17H33
O O
O
O
O O
C17H33 C17H33
Triolein
Fig. 4 – Structures of some compounds representative of the homologous series of triterpenols esterified to long chain fatty acids and of triglycerides in smoke extract from Amazonia.
(e.g. pine), are less significant in the hardwood smoke (e.g. oak) and are not measurable in grass smoke (Si-moneit et al. 1993). The leading lignans of softwood smoke are matairesinol and shonanin (tetrahydro-3,4-divanillyfuran). Minor quantities of methylated deriva-tive are detectable. The hardwood smoke encompasses a variety of highly oxygenated isomers of dihydrovanil-lylsyringyl-2(3H)-furanone, dihydro-3(2’, 3’, 4’-trime-thoxybenzyl) - 4 - veratryl - 2(3H) - furanone and tetra-hydro-3-vanillyl-4-veratrylfuran, which are released un-altered from the combustion sources and may be consid-ered tracers of biomass burning. In addition, softwood smoke includes derivatives from coniferyl-type precur-sors, such as divanillyl, divanillylmethane, bis(3,4-dimethoxyphenyl)methane and diveratryl. Hardwood smoke comprises components originated from sinapyl-type precursors, including bisguaiacylsyringyl, disy-ringyl and bis(3,4,5-trimethoxyphenyl)ethane. Dianisyl, a derivative from a p-coumaryl-type precursor, is the only tracer in the grass smoke (Simoneit 2002).
The pyrolysis derivatives from the thermal