www.ccarevista.ufc.br ISSN 1806-6690
Sample size and sampling method for evaluation of characteristics of
the sunflower
1Tamanho amostral e método de amostragem de características do girassol
Paulo Sérgio Lima e Silva2*, Luiz Eduardo Barreto dos Santos2, Vianney Reinado de Oliveira2, Roberto Pequeno
de Sousa2 e Patrícia Lianny de Oliveira Fernandes2
ABSTRACT - In the sunflower, in addition to seed yield, it is of interest to evaluate number of leaves plant-1, head
diameter, stem diameter and plant height, since these characteristics may be associated with seed yield or lodging. The objective of the work was to determine the optimal sample size (from which the experimental coefficient of variation, CV, can be established) for evaluation of these four characteristics. Fifteen cultivars were evaluated in an experimental design of randomized blocks with ten replications. The characteristics were evaluated using two sampling methods (in a single row of plants or in the two rows from the useable area of each plot) and sample sizes of from two to 18 sampling units, with an interval of two plants. In the two sampling methods, the experimental accuracy, as measured by the CV, increased with increasing sample size. A sample made up of ten sampling units is suitable for assessing the number of leaves, the diameters of the head and stem, and the plant height in cultivars of the sunflower. From this sample size upwards, additional gains in experimental precision are not obtained. This sample size can be used to evaluate plants in a single row or in two rows taken from the useable area of each plot, since there was virtually no difference between sampling methods with regard to experimental accuracy. However, it is most practical and quick to sample in one row of plants.
Key words:Helianthus annuus L.. Plant height. Leaf number. Stem diameter. Head diameter.
RESUMO - No girassol, além do rendimento de sementes, existe interesse na avaliação do número de folhas, dos diâmetros do capítulo e do caule e da altura da planta, e porque estas características podem estar associadas com o rendimento de sementes ou com o acamamento. O objetivo do trabalho foi determinar o tamanho ideal da amostra (a partir do qual o coeficiente de variação experimental, CV, se estabiliza) para avaliação das quatro características referidas. Quinze cultivares foram avaliadas no delineamento experimental de blocos ao acaso com dez repetições. As características foram avaliadas com dois métodos de amostragem (em uma só fileira de plantas ou nas duas fileiras da área útil da parcela) e tamanhos amostrais de duas a 18 unidades amostrais, com intervalos de duas plantas. Nos dois métodos de amostragem, a precisão experimental, medida pelo CV, aumentou com o aumento do tamanho da amostra. Uma amostra formada por dez unidades amostrais é adequada para avaliação do número de folhas, dos diâmetros do capítulo e do caule e da altura da planta de cultivares de girassol. A partir deste tamanho amostral não se obtém ganhos adicionais na precisão experimental. Este tamanho amostral pode ser usado com a avaliação de plantas em uma só fileira ou em duas fileiras da área útil da parcela, desde que, com ele praticamente não existiram diferenças entre métodos de amostragem, no que se refere à precisão experimental. Contudo, é mais prático e rápido fazer a amostragem em uma só fileira de plantas.
Palavras-chave:Helianthus annuus L.. Altura da planta. Número de folhas. Diâmetro do caule. Diâmetro do capítulo.
*Autor para correspondência
1Recebido para publicação em 02/09/2013; aprovado em 24/10/2014
Parte da Monografia de Graduação do segundo autor apresentada na Universidade Federal Rural do Semi-Árido/UFERSA
2Departmento de Fitotecnia/UFERSA/CNPq, Caixa Postal 137137, Mossoró-RN, Brasil, 59.600-970, paulosergio@ufersa.edu.br, engduh@
INTRODUCTION
Interest in the sunflower has increased in Brazil with the possibility of its being exploited as a source of biofuel. In many regions of Brazil, the crop is being studied, with a consequent demand for experimental techniques. Except for information on the size and shape of the plot, where the literature is vast, information is lacking on other experimental techniques for the majority of crops including the sunflower. The situation is more serious when it comes to aspects of sampling, although some crops have been addressed as to sample size
(CARGNELUTTI FILHO et al., 2010; NUNES, 1998;
SILVA; SILVA; CARGNELUTTI FILHO et al., 2008)
and sampling methods (GOMESet al., 1963; SILVAet al.,
1993, SILVA; SILVA; NUNES, 1998).
In determining plot size, the characteristic evaluated is yield. But there is interest from researchers in other characteristics. As these characteristics are not as important as yield, there is no interest in evaluating them for all those plants used when evaluating yield. This would even be desirable, as the larger the sample size, the higher the experimental precision (LeCLERG; LEONARD; CLARK, 1966). But the larger the sample size, the greater the time and expense spent on sampling. On the other hand, smaller samples may result in less accuracy, and this would be undesirable. Thus, determining ideal sample sizes becomes interesting, especially when the evaluation of characteristics is time-consuming and laborious. Furthermore, certain sampling methods, besides increasing
accuracy are more practical than others (GOMESet al., 1963;
SILVAet al., 1993, SILVA; SILVA; NUNES, 1998).
Sample size has been determined by various
methods (CARGNELUTTI FILHO et al., 2010;
CARGNELUTTI FILHOet al., 2011; LEITEet al., 2009;
PARANAIBA; MORAIS; FERREIRA, 2009; SILVA; RÊGO; CECON, 2011;). In the method where the CV is established, a CV is obtained for each sample size. Sample sizes and CV values are arranged as a table, and the optimal sample size is considered to be that after which there are no significant additional increases in precision. Although sometimes receiving criticism for being subjective, this method has been used because it is simple, easy to apply and provides sample sizes consistent with reality (SILVA; SILVA; NUNES, 1998; WOLKOWSKI; REISDORF; BUNDY, 1988;). On the other hand, most other methods, besides being harder to apply, often indicate sample sizes which are overly small or large (CARGNELUTTI
FILHOet al., 2010; CARGNELUTTI FILHOet al., 2011;
PARANAIBA; MORAIS; FERREIRA, 2009).
In the sunflower, in addition to seed yield, the plant height, stem diameter, number of leaves and head diameter are evaluated, among other characteristics. The first two characteristics are associated with lodging, the number of
leaves is associated with the photosynthetic capacity of the plant, and the head diameter is related to seed yield (AMJADIAN; FARSHADFAR; GHOLIPOOR, 2013;
JAGADEESAN et al., 2008; YASIN; SINGH, 2010).
Several authors (AHMAD; AHMED; TAHIR, 2012;
MARTINet al., 2012) have evaluated these characteristics,
reflecting their importance.
The objective of this work was to determine the appropriate sample size (from which the CV is established) for evaluation of the four above mentioned biometric traits in the sunflower.
MATERIAL AND METHODS
The work was carried out at the Rafael Fernandes Experimental Farm of the Federal Rural University of the Semi-Arid - UFERSA, from February to May, 2012. This farm is located in the district of Alagoinha, 20 km away from the town of Mossoró (latitude 5°11’ S, longitude 37°20’ W, at an altitude of 18 m). According to the Gaussen bioclimatic classification, the climate in the Mossoró region is of the 4ath type, severe
thermo-xerochimenic, being tropical, hot and markedly dry, with a
long dry season of seven to eight months and a xerothermic index between 150 and 200. The region has a maximum average air temperature of between 32.1 and 34.5 °C, and an average minimum of between 21.3 and 23.7 °C, with June and July being the coldest months. The average annual rainfall is around 825 mm. Sunlight increases from March to October, with an average of 241.7 h, and the relative air humidity reaches a maximum of 78% in April and a minimum of 60% in September (CARMO FILHO; OLIVEIRA, 1989).
The soil of the experimental area is classified as a Red-Yellow Argisol, according to the Brazilian System of Soil Classification (EMPRESA BRASILEIRA DE PESQUISA AGROPECUÁRIA, 2006). After the soil was prepared by harrowing twice, five single soil samples were taken from the experimental area at a depth of 0-20 cm and combined to form a composite sample. The results of the chemical analysis of the
composite sample showed: pH (H2O) = 6.5; organic
matter = 21 g dm-3; P (Mehlic-1) = 7.1 mg dm-3; K+
= 69.2 mg dm-3; Na+ = 59.2 mg dm-3, Ca2+ = 1.4 cmol c dm-3;
Mg2+ = 0.8 cmol
c dm-3; H+ + Al3+ = 0.8 cmolc dm-3; CEC
= 3.5 cmolc.
The soil received as sowing fertilizer 60 kg N
(ammonium sulphate), 100 kg of P2O5 (superphosphate)
and 20 kg of K2O (potassium chloride) per hectare. The
days after sowing, and 40 days after sowing. Between the rows a spacing of 0.70 m was used, with the holes in any one row spaced 0.30 m apart. Sowing was carried out manually with four seeds per hole. The plants were thinned 20 days after sowing, leaving the largest plant in each hole, and the experiment with a programmed
seeding density of 47,619 plants ha-1.
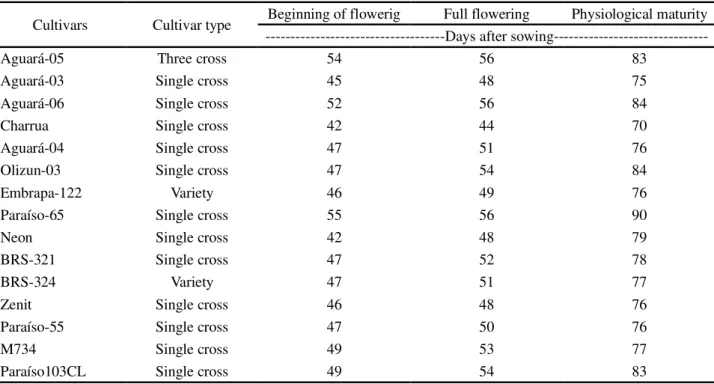
A randomized, complete block design was used, with ten replications. The cultivars listed in Table 1, with respective phenologic traits, were evaluated in plots made up of four rows each of 6.0 m in length. The useable area was considered to be that occupied by the 36 central plants (18 in each row) of the two central rows of each plot. These plants were evaluated when the
crop was in full flowering, for number of leaves plant-1,
head diameter, stem diameter and plant height. Head diameter was measured using a rule. Stem diameter was measured with digital callipers 10 cm from the ground. Plant height was measured from soil surface to the insertion of the last leaf using a rule. Sample sizes were considered to be 2 to 18 sampling units (plant, for plant height, stem diameter and number of leaves
plant-1, and head, for head diameter) in intervals of two.
Sampling methods considered plants from any one row (“single row”) or plants from the two rows (“double row”) of the useable area. In the case of the double row, half of the sampling units were evaluated from
Table 1 - Cultivar type and phenology of the evaluated cultivars
Cultivars Cultivar type Beginning of flowerig Full flowering Physiological maturity
---Days after
sowing---Aguará-05 Three cross 54 56 83
Aguará-03 Single cross 45 48 75
Aguará-06 Single cross 52 56 84
Charrua Single cross 42 44 70
Aguará-04 Single cross 47 51 76
Olizun-03 Single cross 47 54 84
Embrapa-122 Variety 46 49 76
Paraíso-65 Single cross 55 56 90
Neon Single cross 42 48 79
BRS-321 Single cross 47 52 78
BRS-324 Variety 47 51 77
Zenit Single cross 46 48 76
Paraíso-55 Single cross 47 50 76
M734 Single cross 49 53 77
Paraíso103CL Single cross 49 54 83
one row and the remainder from the other. The rows and plants for evaluation were selected with the aid of a random digit table.
The experiment was carried out under rainfed conditions, receiving sprinkler irrigation when necessary, with the experimental plots arranged parallel to the rows of sprinklers. The amount of water required by the sunflower (5.3 mm) was calculated based on an effective depth of 0.40 m for the root system. When to irrigate was based on the water retained in the soil at a tension of 0.40 Mpa. Irrigation was started after sowing, carried out three times a week, and suspended five days before the heads were harvested. Weeding was carried out by hoe, always assigning the same worker to each block. There were no pest attacks or outbreaks of disease.
RESULTS AND DISCUSSION
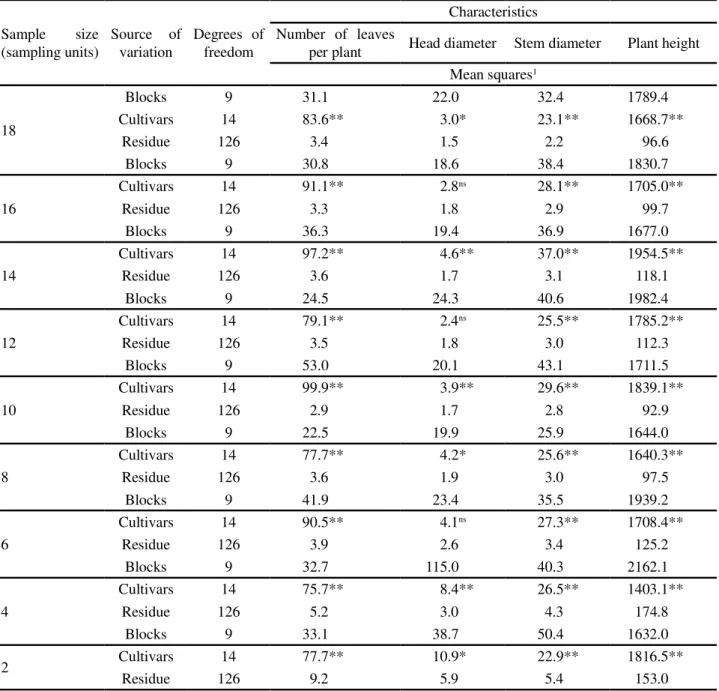
For the number of leaves per plant, stem diameter and plant height, the F-test showed effects from the cultivars, at 1% probability for all sample sizes, with evaluation being carried out on a single row (Table 2) or on both the rows of the useable area of each plot (Table 3). An exception to this finding was seen for stem diameter, evaluated in four plants from both rows,
Table 2 - Summary of variance analysis for characteristics of sunflower cultivars evaluated by sample size in one row of plants
from plots of two rows
1ns, *, ** Corresponding non-significant or significant effect at 5% or at 1% probability respectively, by the F-test.
Sample size (sampling units)
Source of variation
Degrees of freedom
Characteristics Number of leaves
per plant Head diameter Stem diameter Plant height
Mean squares1
18
Blocks 9 31.1 22.0 32.4 1789.4
Cultivars 14 83.6** 3.0* 23.1** 1668.7**
Residue 126 3.4 1.5 2.2 96.6
Blocks 9 30.8 18.6 38.4 1830.7
16
Cultivars 14 91.1** 2.8ns 28.1** 1705.0**
Residue 126 3.3 1.8 2.9 99.7
Blocks 9 36.3 19.4 36.9 1677.0
14
Cultivars 14 97.2** 4.6** 37.0** 1954.5**
Residue 126 3.6 1.7 3.1 118.1
Blocks 9 24.5 24.3 40.6 1982.4
12
Cultivars 14 79.1** 2.4ns 25.5** 1785.2**
Residue 126 3.5 1.8 3.0 112.3
Blocks 9 53.0 20.1 43.1 1711.5
10
Cultivars 14 99.9** 3.9** 29.6** 1839.1**
Residue 126 2.9 1.7 2.8 92.9
Blocks 9 22.5 19.9 25.9 1644.0
8
Cultivars 14 77.7** 4.2* 25.6** 1640.3**
Residue 126 3.6 1.9 3.0 97.5
Blocks 9 41.9 23.4 35.5 1939.2
6
Cultivars 14 90.5** 4.1ns 27.3** 1708.4**
Residue 126 3.9 2.6 3.4 125.2
Blocks 9 32.7 115.0 40.3 2162.1
4
Cultivars 14 75.7** 8.4** 26.5** 1403.1**
Residue 126 5.2 3.0 4.3 174.8
Blocks 9 33.1 38.7 50.4 1632.0
2 Cultivars 14 77.7** 10.9* 22.9** 1816.5**
Residue 126 9.2 5.9 5.4 153.0
Sample size (sampling units)
Source of variation
Degrees of freedom
Characteristics Number of leaves
per plant Head diameter Stem diameter Plant height
Mean squares1
18
Blocks 9 26.1 24.1 37.7 1968.1
Cultivars 14 77.3** 3.3* 27.3** 1762.1**
Residue 126 3.2 1.6 2.9 107.2
Blocks 9 26.1 21.2 33.5 1850.4
16
Cultivars 14 85.6** 4.2** 24.5** 1829.4**
Residue 126 2.9 1.6 2.5 106.9
Blocks 9 31.4 22.7 32.8 1901.9
14
Cultivars 14 87.7** 4.0** 27.1** 1774.2**
Residue 126 2.5 1.4 2.9 101.8
Blocks 9 34.2 24.0 42.0 2043.4
12
Cultivars 14 90.9** 3.8** 28.7** 1813.8**
Residue 126 2.7 1.5 3.0 108.0
Blocks 9 35.3 20.9 39.4 2278.0
10
Cultivars 14 92.6** 3.4* 32.9** 1672.8**
Residue 126 3.0 1.9 3.4 96.1
Blocks 9 37.8 19.2 31.0 2077.5
8
Cultivars 14 85.3** 5.7** 25.0** 1743.6**
Residue 126 4.2 2.2 3.8 109.5
Blocks 9 33.3 21.3 41.3 2189.6
6
Cultivars 14 88.9** 5.1* 32.2** 1756.3**
Residue 126 3.1 2.5 4.8 134.2
Blocks 9 40.5 31.8 31.6 2446.4
4
Cultivars 14 98.6** 7.8** 19.9* 2109.6**
Residue 126 4.4 3.1 10.8 159.3
Blocks 9 35.4 22.2 39.7 1712.6
2 Cultivars 14 94.0** 6.6ns 37.4** 2027.4**
Residue 126 8.3 4.4 9.0 203.1
significant results were observed for samples of between 2 and 18 sampling units. Silva, Silva and Nunes (1998) noted that the F-test indicated no effects from maize cultivars on the number of grains per ear when the sample size varied from 1 to 15 ears and when sampling was carried out randomly or haphazardly. For the length and weight of the cob, the F-test, depending on the sampling method and sample size, showed both non-significant and significant effects from cultivars (at 5% or 1% probability) (SILVA; SILVA; NUNES, 1998).
Table 3 - Summary of variance analysis for characteristics of sunflower cultivars evaluated by sample size in two rows of plants from plots of two rows
1ns, *, ** Corresponding non-significant or significant effect at 5% or at 1% probability respectively, by the F-test.
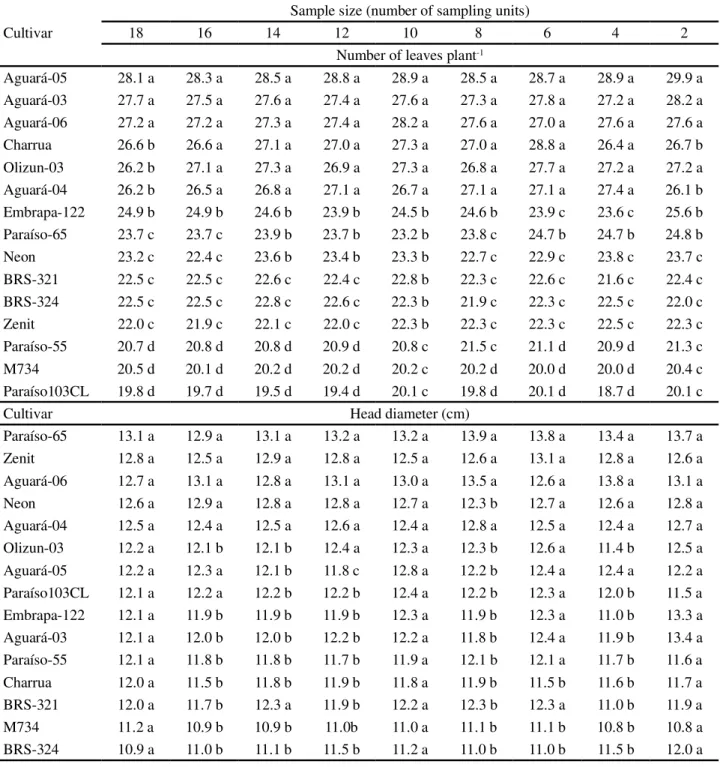
evaluated from one row (Table 4), and with sample sizes of 18, 10 and 02 (disagreeing with the F-test results, which indicated no effect from the cultivars for sample size 2), when the plants were evaluated from the two rows of the useable area (Table 6). Discrepancies may occur
Table 4 - Averages of the number of leaves and of head diameter in sunflower cultivars evaluated by sample size in one row of plants from plots with two rows1
1For each sample size, averages followed by the same letter do not differ between themselves at 5% probability by the Scott-Knott test(1974)
Cultivar
Sample size (number of sampling units)
18 16 14 12 10 8 6 4 2
Number of leaves plant-1
Aguará-05 28.9 a 28.5 a 29.0 a 28.7 a 29.0 a 28.4 a 28.5 a 28.6 a 27.8 a
Aguará-03 27.4 a 28.0 a 27.4 a 27.0 a 28.0 a 27.2 a 28.0 a 27.6 a 27.7 a
Aguará-06 27.4 a 27.7 a 27.6 a 26.8 a 27.9 a 27.6 a 27.4 a 26.7 a 27.1 a
Charrua 27.3 a 26.6 a 26.7 a 27.3 a 26.3 a 26.6 a 27.0 a 27.5 a 26.3 a
Aguará-04 26.8 a 26.9 a 26.9 a 26.6 a 27.5 a 26.8 a 26.8 a 26.8 a 27.6 a
Olizun-03 26.7 a 27.4 a 27.8 a 27.0 a 27.6 a 26.3 a 26.9 a 26.8 a 26.7 a
Embrapa-122 24.3 b 23.8 b 25.0 b 25.1 b 23.5 b 23.6 b 22.9 b 24.2 b 24.4 b
Paraíso-65 23.4 b 24.3 b 23.8 c 23.1 c 23.9 b 23.5 b 24.3 b 22.3 c 24.5 b
Neon 23.4 b 23.5 b 22.9 c 23.1 c 22.9 b 23.4 b 24.1 b 23.3 b 24.8 b
BRS-321 22.8 b 23.3 b 22.2 c 22.7 c 22.3 b 23.2 b 22.0 c 23.2 b 22.6 c
BRS-324 22.7 b 22.4 c 21.9 c 22.6 c 22.2 b 22.7 b 22.4 b 22.2 c 23.0 c
Zenit 22.0 b 22.0 c 21.9 c 22.2 c 22.2 b 22.3 b 21.5 c 21.7 c 21.7 c
Paraíso-55 21.4 c 20.8 d 20.6 d 21.2 d 21.1 c 20.9 c 20.6 c 21.8 c 21.8 c
M734 20.2 c 19.9 d 20.3 d 20.2 d 19.5 c 19.9 c 20.8 c 21.0 c 19.6 c
Paraíso103CL 19.9 c 19.7 d 19.8 d 20.3 d 20.1 c 20.2 c 19.7 c 20.5 c 20.2 c
Cultivar Head diameter (cm)
Aguará-06 13.1 a 12.7 a 13.2 a 13.0 a 13.4 a 12.9 a 12.5 a 13.2 a 13.5 a
Zenit 12.7 a 12.7 a 12.6 a 12.6 a 12.6 a 13.2 a 12.6 a 12.2 a 13.2 a
Neon 12.6 a 12.6 a 12.6 a 12.7 a 12.5 a 12.7 a 13.2 a 12.8 a 13.1 a
Paraíso-65 12.6 a 13.3 a 13.2 a 12.3 a 13.1 a 13.1 a 13.3 a 12.9 a 14.2 a
Paraíso103CL 12.4 a 12.5 a 12.4 a 12.3 a 12.3 a 12.6 a 12.6 a 13.2 a 11.6 b
BRS-321 12.4 a 12.3 a 11.9 b 12.0 a 12.5 a 12.3 a 11.8 a 13.0 a 12.6 a
Aguará-05 12.3 a 12.5 a 12.2 b 12.8 a 12.1 b 11.9 b 12.4 a 12.2 a 12.0 b
Aguará-03 12.1 a 12.0 a 12.2 b 11.9 a 12.0 b 11.7 b 11.8 a 11.2 b 12.8 a
Aguará-04 12.1 a 12.5 a 12.7 a 12.3 a 12.5 a 12.5 a 12.2 a 12.2 a 12.6 a
Embrapa-122 12.0 a 12.4 a 12.0 b 12.1 a 12.6 a 12.0 b 12.0 a 11.9 b 11.1 b
Olizun-03 12.0 a 12.3 a 13.0 a 12.3 a 12.4 a 11.9 b 11.6 a 13.7 a 12.4 a
Charrua 11.9 a 12.0 a 11.9 b 11.9 a 11.9 b 11.5 b 12.0 a 11.4 b 11.1 b
Paraíso-55 11.8 a 12.2 a 11.9 b 11.9 a 12.5 b 11.9 b 11.5 a 12.6 a 11.7 b
BRS-324 11.3 a 11.3 a 11.2 b 11.6 a 11.3 b 11.4 b 11.4 a 10.2 b 10.4 b
M734 11.0 a 11.2 a 10.8 b 11.1 a 11.0 b 11.0 b 11.0 a 11.8 b 11.3 b
between the F-test and the various multiple-comparison tests, occurring more often with some tests than with others (SOUSA; LIRA JÚNIOR; FERREIRA, 2012).
this assumption is untrue, the test shows control of error rates for types I and II. This type of characteristic is known as the robustness of the procedure (BORGES; FERREIRA, 2003). The F-test is considered a robust test with low sensitivity to problems of non-compliance
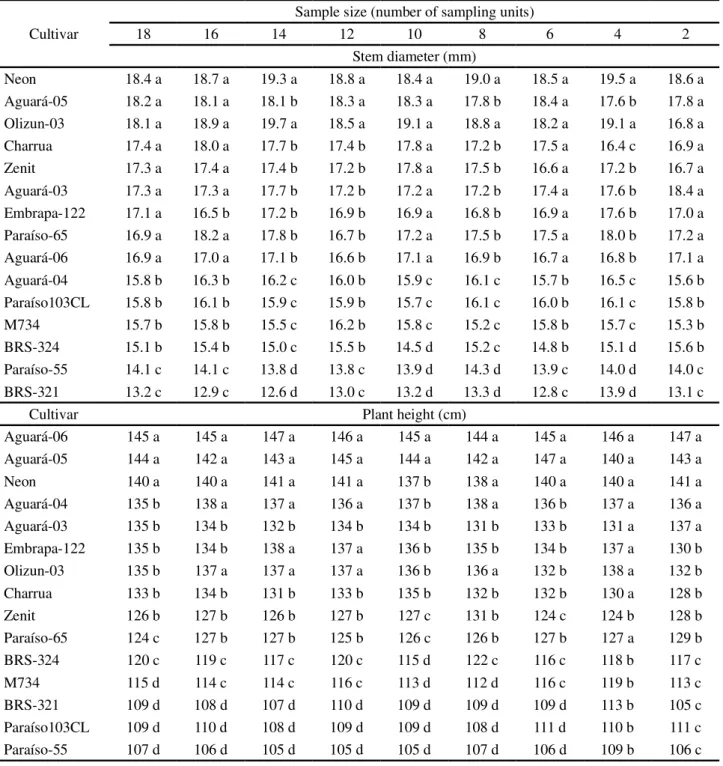
Table 5 - Averages of stem diameter and plant height in sunflower cultivars evaluated by sample size in one row of plants from plots with two rows
1For each sample size, averages followed by the same letter do not differ between themselves at 5% probability by the Scott-Knott test(1974)
Cultivar
Sample size (number of sampling units)
18 16 14 12 10 8 6 4 2
Stem diameter (mm)
Neon 18.4 a 18.7 a 19.3 a 18.8 a 18.4 a 19.0 a 18.5 a 19.5 a 18.6 a
Aguará-05 18.2 a 18.1 a 18.1 b 18.3 a 18.3 a 17.8 b 18.4 a 17.6 b 17.8 a
Olizun-03 18.1 a 18.9 a 19.7 a 18.5 a 19.1 a 18.8 a 18.2 a 19.1 a 16.8 a
Charrua 17.4 a 18.0 a 17.7 b 17.4 b 17.8 a 17.2 b 17.5 a 16.4 c 16.9 a
Zenit 17.3 a 17.4 a 17.4 b 17.2 b 17.8 a 17.5 b 16.6 a 17.2 b 16.7 a
Aguará-03 17.3 a 17.3 a 17.7 b 17.2 b 17.2 a 17.2 b 17.4 a 17.6 b 18.4 a
Embrapa-122 17.1 a 16.5 b 17.2 b 16.9 b 16.9 a 16.8 b 16.9 a 17.6 b 17.0 a
Paraíso-65 16.9 a 18.2 a 17.8 b 16.7 b 17.2 a 17.5 b 17.5 a 18.0 b 17.2 a
Aguará-06 16.9 a 17.0 a 17.1 b 16.6 b 17.1 a 16.9 b 16.7 a 16.8 b 17.1 a
Aguará-04 15.8 b 16.3 b 16.2 c 16.0 b 15.9 c 16.1 c 15.7 b 16.5 c 15.6 b
Paraíso103CL 15.8 b 16.1 b 15.9 c 15.9 b 15.7 c 16.1 c 16.0 b 16.1 c 15.8 b
M734 15.7 b 15.8 b 15.5 c 16.2 b 15.8 c 15.2 c 15.8 b 15.7 c 15.3 b
BRS-324 15.1 b 15.4 b 15.0 c 15.5 b 14.5 d 15.2 c 14.8 b 15.1 d 15.6 b
Paraíso-55 14.1 c 14.1 c 13.8 d 13.8 c 13.9 d 14.3 d 13.9 c 14.0 d 14.0 c
BRS-321 13.2 c 12.9 c 12.6 d 13.0 c 13.2 d 13.3 d 12.8 c 13.9 d 13.1 c
Cultivar Plant height (cm)
Aguará-06 145 a 145 a 147 a 146 a 145 a 144 a 145 a 146 a 147 a
Aguará-05 144 a 142 a 143 a 145 a 144 a 142 a 147 a 140 a 143 a
Neon 140 a 140 a 141 a 141 a 137 b 138 a 140 a 140 a 141 a
Aguará-04 135 b 138 a 137 a 136 a 137 b 138 a 136 b 137 a 136 a
Aguará-03 135 b 134 b 132 b 134 b 134 b 131 b 133 b 131 a 137 a
Embrapa-122 135 b 134 b 138 a 137 a 136 b 135 b 134 b 137 a 130 b
Olizun-03 135 b 137 a 137 a 137 a 136 b 136 a 132 b 138 a 132 b
Charrua 133 b 134 b 131 b 133 b 135 b 132 b 132 b 130 a 128 b
Zenit 126 b 127 b 126 b 127 b 127 c 131 b 124 c 124 b 128 b
Paraíso-65 124 c 127 b 127 b 125 b 126 c 126 b 127 b 127 a 129 b
BRS-324 120 c 119 c 117 c 120 c 115 d 122 c 116 c 118 b 117 c
M734 115 d 114 c 114 c 116 c 113 d 112 d 116 c 119 b 113 c
BRS-321 109 d 108 d 107 d 110 d 109 d 109 d 109 d 113 b 105 c
Paraíso103CL 109 d 110 d 108 d 109 d 109 d 108 d 111 d 110 b 111 c
Paraíso-55 107 d 106 d 105 d 105 d 105 d 107 d 106 d 109 b 106 c
JÚNIOR; FERREIRA, 2012). Borges and Ferreira (2003) showed that the Scott-Knott test (1974) is robust and was more powerful than other multiple comparison tests. The discrepancies seen between the F-test and the Scott-Knott test (1974) in the evaluation of head diameter may therefore
Table 6 - Averages of number of leaves and head diameter in sunflower cultivars evaluated by sample size in two rows of plants from plots with two rows
Cultivar
Sample size (number of sampling units)
18 16 14 12 10 8 6 4 2
Number of leaves plant-1
Aguará-05 28.1 a 28.3 a 28.5 a 28.8 a 28.9 a 28.5 a 28.7 a 28.9 a 29.9 a
Aguará-03 27.7 a 27.5 a 27.6 a 27.4 a 27.6 a 27.3 a 27.8 a 27.2 a 28.2 a
Aguará-06 27.2 a 27.2 a 27.3 a 27.4 a 28.2 a 27.6 a 27.0 a 27.6 a 27.6 a
Charrua 26.6 b 26.6 a 27.1 a 27.0 a 27.3 a 27.0 a 28.8 a 26.4 a 26.7 b
Olizun-03 26.2 b 27.1 a 27.3 a 26.9 a 27.3 a 26.8 a 27.7 a 27.2 a 27.2 a
Aguará-04 26.2 b 26.5 a 26.8 a 27.1 a 26.7 a 27.1 a 27.1 a 27.4 a 26.1 b
Embrapa-122 24.9 b 24.9 b 24.6 b 23.9 b 24.5 b 24.6 b 23.9 c 23.6 c 25.6 b
Paraíso-65 23.7 c 23.7 c 23.9 b 23.7 b 23.2 b 23.8 c 24.7 b 24.7 b 24.8 b
Neon 23.2 c 22.4 c 23.6 b 23.4 b 23.3 b 22.7 c 22.9 c 23.8 c 23.7 c
BRS-321 22.5 c 22.5 c 22.6 c 22.4 c 22.8 b 22.3 c 22.6 c 21.6 c 22.4 c
BRS-324 22.5 c 22.5 c 22.8 c 22.6 c 22.3 b 21.9 c 22.3 c 22.5 c 22.0 c
Zenit 22.0 c 21.9 c 22.1 c 22.0 c 22.3 b 22.3 c 22.3 c 22.5 c 22.3 c
Paraíso-55 20.7 d 20.8 d 20.8 d 20.9 d 20.8 c 21.5 c 21.1 d 20.9 d 21.3 c
M734 20.5 d 20.1 d 20.2 d 20.2 d 20.2 c 20.2 d 20.0 d 20.0 d 20.4 c
Paraíso103CL 19.8 d 19.7 d 19.5 d 19.4 d 20.1 c 19.8 d 20.1 d 18.7 d 20.1 c
Cultivar Head diameter (cm)
Paraíso-65 13.1 a 12.9 a 13.1 a 13.2 a 13.2 a 13.9 a 13.8 a 13.4 a 13.7 a
Zenit 12.8 a 12.5 a 12.9 a 12.8 a 12.5 a 12.6 a 13.1 a 12.8 a 12.6 a
Aguará-06 12.7 a 13.1 a 12.8 a 13.1 a 13.0 a 13.5 a 12.6 a 13.8 a 13.1 a
Neon 12.6 a 12.9 a 12.8 a 12.8 a 12.7 a 12.3 b 12.7 a 12.6 a 12.8 a
Aguará-04 12.5 a 12.4 a 12.5 a 12.6 a 12.4 a 12.8 a 12.5 a 12.4 a 12.7 a
Olizun-03 12.2 a 12.1 b 12.1 b 12.4 a 12.3 a 12.3 b 12.6 a 11.4 b 12.5 a
Aguará-05 12.2 a 12.3 a 12.1 b 11.8 c 12.8 a 12.2 b 12.4 a 12.4 a 12.2 a
Paraíso103CL 12.1 a 12.2 a 12.2 b 12.2 b 12.4 a 12.2 b 12.3 a 12.0 b 11.5 a
Embrapa-122 12.1 a 11.9 b 11.9 b 11.9 b 12.3 a 11.9 b 12.3 a 11.0 b 13.3 a
Aguará-03 12.1 a 12.0 b 12.0 b 12.2 b 12.2 a 11.8 b 12.4 a 11.9 b 13.4 a
Paraíso-55 12.1 a 11.8 b 11.8 b 11.7 b 11.9 a 12.1 b 12.1 a 11.7 b 11.6 a
Charrua 12.0 a 11.5 b 11.8 b 11.9 b 11.8 a 11.9 b 11.5 b 11.6 b 11.7 a
BRS-321 12.0 a 11.7 b 12.3 a 11.9 b 12.2 a 12.3 b 12.3 a 11.0 b 11.9 a
M734 11.2 a 10.9 b 10.9 b 11.0b 11.0 a 11.1 b 11.1 b 10.8 b 10.8 a
BRS-324 10.9 a 11.0 b 11.1 b 11.5 b 11.2 a 11.0 b 11.0 b 11.5 b 12.0 a
1For each sample size, averages followed by the same letter do not differ between themselves at 5% probability by the Scott-Knott test(1974)
indicate problems in the evaluation of this characteristic, including imprecise measurements.
1For each sample size, averages followed by the same letter do not differ between themselves at 5% probability by the Scott-Knott test(1974)
Table 7 - Averages of stem diameter and plant height in sunflower cultivars evaluated by sample size in two rows of plants from plots with two rows
Cultivar
Sample size (number of sampling units)
18 16 14 12 10 8 6 4 2
Stem diameter (mm)
Olizun-03 18.8 a 18.7 a 18.8 a 18.7 a 19.5 a 18.7 a 19.0 a 19.2 a 19.3 a
Neon 18.7 a 18.7 a 19.1 a 19.1 a 18.9 a 18.6 a 19.7 a 19.3 a 18.9 a
Aguará-05 17.9 a 18.0 a 18.4 a 18.2 a 18.3 a 18.1 a 18.4 a 17.6 a 19.8 a
Embrapa-122 17.7 a 16.7 b 17.0 b 16.8 a 17.3 b 17.2 a 16.7 b 16.5 a 16.9 b
Paraíso-65 17.7 a 17.4 b 17.8 b 17.7 a 18.0 b 18.0 a 17.9 b 17.9 a 17.7 b
Aguará-03 17.5 a 17.1 b 17.3 b 17.8 a 17.7 b 17.8 a 17.6 b 16.9 a 19.2 a
Zenit 17.4 a 17.4 b 17.3 b 17.3 a 17.3 b 17.1 a 17.9 b 17.8 a 17.0 b
Charrua 17.3 a 17.1 b 17.6 b 17.8 a 17.4 b 17.7 a 17.3 b 16.8 a 17.4 b
Aguará-06 16.6 a 17.2 b 16.9 b 17.1 a 16.9 b 17.0 a 16.9 b 17.3 a 16.8 b
Aguará-04 16.3 a 15.9 c 16.3 c 16.1 b 16.2 c 16.1 b 16.4 b 16.4 a 15.5 c
M734 15.7 b 15.7 c 15.4 c 15.6 b 15.7 c 16.2 b 15.0 c 16.0 a 15.8 c
Paraíso103CL 15.6 b 15.9 c 16.0 c 15.9 b 15.9 c 16.0 b 15.4 c 15.3 a 15.7 c
BRS-324 15.1 b 14.9 c 15.2 c 15.3 b 15.1 c 14.9 b 15.1 c 14.7 a 15.9 c
Paraíso-55 14.5 b 14.4 d 14.7 d 14.5 b 14.4 c 15.1 b 14.8 c 14.7 a 14.6 c
BRS-321 12.8 c 13.1 d 13.1 d 12.8 c 12.5 d 13.0 c 13.1 c 15.9 a 12.8 c
Cultivar Plant height (cm)
Aguará-06 144 a 146 a 145 a 146 a 145 a 145 a 145 a 144 a 148 a
Aguará-05 142 a 141 a 144 a 140 a 145 a 143 a 142 a 140 a 143 a
Neon 140 a 141 a 142 a 142 a 140 a 138 a 141 a 140 a 144 a
Aguará-04 137 a 136 a 136 b 137 a 138 a 136 a 138 a 139 a 133 b
Olizun-03 136 a 134 b 136 b 133 b 139 a 133 b 137 a 135 a 141 a
Embrapa-122 134 b 132 b 135 b 134 b 137 a 136 a 135 a 132 b 133 b
Aguará-03 134 b 134 b 133 b 136 b 134 b 133 b 136 a 132 b 136 b
Charrua 132 b 137 a 132 b 133 b 133 b 134 b 134 a 129 b 131 b
Paraíso-65 127 b 127 b 125 c 126 b 128 b 126 b 128 b 124 b 129 b
Zenit 126 b 126 b 127 c 125 b 125 c 127 b 127 b 125 b 130 b
BRS-324 118 c 119 c 118 d 122 c 122 c 118 c 119 c 117 c 119 c
M734 115 c 114 c 114 d 115 c 116 d 114 c 114 c 115 c 115 c
BRS-321 107 d 107 d 109 e 107 d 110 d 106 d 110 c 106 d 101 c
Paraíso103CL 107 d 108 d 109 e 106 d 111 d 108 d 107 c 104 d 112 c
Paraíso-55 105 d 105 d 106 e 105 d 107 d 106 d 107 c 92 d 108 c
methods used in the present work, as regards the magnitude of the experimental coefficient of variation (differences of more than two percentage points) (Table 8).
Gomes et al. (1963) concluded that for five
characteristics of sugar cane, it was more appropriate to
use samples made up of a fixed number of stems per plot, one from each clump, and spread throughout the area of the plot, than to collect nearby stalks or those from the
same clump. Silva et al. (1993) when estimating three
Sample size (sampling units)
Number of leaves plant-1 Head diameter (cm) Stem diameter (mm) Plant height (cm)
Sampling method1
Single row Two rows Single row Two rows Single row Two rows Single row Two rows
Experimental coeficiente of variation (%)
2 11.7 12.5 17.0 19.9 17.8 14.2 11.1 9.8
4 8.6 9.4 14.7 14.1 19.5 12.4 10.1 10.3
6 7.2 8.2 12.9 13.3 13.1 11.2 9.1 8.8
8 8.4 7.8 12.3 11.4 11.7 10.4 8.3 7.8
10 7.2 7.0 11.3 10.6 11.0 10.0 7.6 7.6
12 6.9 7.7 10.2 10.9 10.4 10.6 8.2 8.3
14 6.5 7.8 9.9 10.7 10.3 10.6 7.9 8.5
16 7.1 7.5 10.4 10.9 9.5 10.1 8.1 7.8
18 7.4 7.6 10.4 10.1 10.2 9.1 8.2 7.7
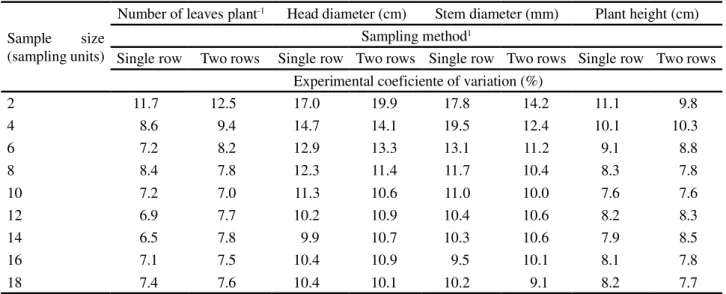
Table 8 - Values for the experimental coefficient of variation in sunflower cultivars evaluated by sample size and sampling method
1Single row: characteristics evaluated in plants from one row in plots with two rows; two rows: half of the sampling units evaluated from one row and
the remainder from the other. Rows and plants were selected randomly
to evaluate plants from different holes than plants from the same hole. In the present work, the evaluation of plants from the same row may have been quite similar to the evaluation of plants from two rows because the sunflowers were grown with one plant per hole. Competition should produce a different reduction in the growth and yield of plants from the same hole (for corn) or plants from the same clump (in the case of sugar cane). These reductions are likely to be different for different holes of the same plot due to the genetic factors of the plants from each hole or clump, and to the environmental factors (mainly the soil). Sampling plants from different holes should therefore encourage greater representation of the holes from each plot than would a sample of plants from the same hole.
For the two sampling methods, the experimental accuracy, as measured by the experimental coefficient of variation (CV), increased with an increase in sample size (Table 8). When, in a random block experiment with “r” replicates, “a” sampling units are extracted per plot, then the variance estimate for a treatment mean (s2x) is s2/ra, where s2/r estimates the true variance of
an individual plot, plus the true variance of the mean
for an individual plot or 2a/r (LeCLERG; LEONARD;
CLARK, 1966). In these expressions, s2 is the mean
square of the residue and 2 is the true variance for an
individual sampling unit taken from a plot. I.e., s2/ra
estimates 2/r + 2a/ra or 1/r ( 2 + 2a/a). In this formula,
it becomes evident that the variance of a treatment mean is influenced by the number of replicates (r) and by the number of sampling units taken at each plot (a) (LeCLERG; LEONARD; CLARK, 1966).
Based on the data in Table 8, a sample can be recommended made up of ten sampling units for the evaluation of the number of leaves, the head diameter, the stem diameter and the plant height of sunflower cultivars. From this sample size upward, no additional gains in experimental precision are obtained. This sample size can be used to evaluate plants in a single row or in two rows taken from the useable area of each plot, since there was virtually no difference between sampling methods with regard to experimental accuracy. However, it would appear to be more practical and quicker to take samples from a single row of plants.
It is important to mention that from three
(MARTIN et al., 2012) to ten (AHMAD; AHMED;
TAHIR, 2012; REHMAN et al., 2012) plants were
used to evaluate the height of the sunflower, from five
(AMORIN et al., 2007 ; PIVETTA et al., 2012) to
20 (SMIRDELE; MOURÃO JÚNIOR; GIANLUPPI, 2005) stems were used to estimate the stem diameter
from the same crop, from three (MARTIN et al.,
2012) to 30 (SMIRDELE; MOURÃO JÚNIOR; GIANLUPPI, 2005) heads were used to determine the head diameter in the sunflower, and from three
(MARTIN et al., 2012) to ten (AHMAD; AHMED;
TAHIR, 2012; VOGT; BALBINOT JÚNIOR; SOUZA, 2010) sunflower plants were used to evaluate the number of leaves per plant in the crop. However
several authors (AHMAD; AHMED; TAHIR et al.,
2012, REHMAN et al., 2012; VOGT; BALBINOT
CONCLUSIONS
1. A sample made up of ten sampling units is suitable for evaluating the number of leaves, the diameters of the head and the stem, and the plant height of sunflower cultivars. From this sample size upwards no additional gains in experimental precision are obtained;
2. The sample size estimated can be used to evaluate plants in a single row or in two rows taken from the useable area of each plot, since there was virtually no difference between sampling methods with regard to experimental accuracy. However, it is most practical and quick to sample in one row of plants.
REFERENCES
AHMAD, M. W.; AHMED, M. S.; TAHIR, H. N. Combining ability analysis for achene yield and related traits in sunflower (Helianthus annuus L.). Chilean Journal of Agricultural Research, v. 72, n. 1, p. 21-26, 2012.
AMORIM, E. P. et al. Divergência genética em genótipos de girassol.
Ciência e Agrotecnologia, v. 31, n. 6, p. 1637-1644, 2007. AMJADIAN, M.; FARSHADFAR, M.; GHOLIPOOR, M. The effects of leaf removal on grain yield and yield components of sunflower, var. Alestar.Annals of Biological Research, v. 4, n. 4, p. 42-45, 2013.
BORGES, L. C.; FERREIRA, D. F. Poder e taxas de erro tipo I dos testes Scott-Knott, Tukey e Student-Newman-Keuls sob distribuições normal e não normais dos resíduos. Revista de Matemática e Estatística, v. 21, n. 1, p. 67-83, 2003.
CARGNELUTTI FILHO, A. et al. Tamanho de amostra de
caracteres em híbridos de mamoneira.Ciência Rural, v. 40, n. 2, p. 280-287, 2010.
CARGNELUTTI FILHO, A. et al. Tamanho de amostra de
caracteres de cultivares de feijão.Ciência Rural, v. 38, n. 3, p. 635-642, 2008.
CARGNELUTTI FILHO, A.et al. Métodos de estimativa do tamanho
ótimo de parcelas experimentais de híbridos de milho simples, triplo e duplo.Ciência Rural, v. 41, n. 9, p. 1509-1516, 2011.
CARMO FILHO, F.; OLIVEIRA, O. F.Mossoró:um município
do semi-árido nordestino. Mossoró: Fundação Guimarães Duque/ ESAM, 1989. 62 p. (Col. Mossoroense, B., 672).
EMPRESA BRASILEIRA DE PESQUISA AGROPECUÁRIA. Centro Nacional de Pesquisa do Solo. Sistema Brasileiro de classificação de solos. Brasília: Serviço de Produção de Informação, 2006. 306 p.
GOMES, F. P. et al. Amostragem de cana-de-açúcar para determinações tecnológicas. Anais da E.S.A. “Luiz de Queiroz”, v. 20, p. 89-114, 1963.
LeCLERG, E. L.; LEONARD, W. H. E.; CLARK, A. G.Field plot technique. Minneapolis: Burgess, 1966. 373 p.
JAGADEESAN, S. et al. valuable sunflower dwarf mutant.
Helia, v. 31, n. 49, p. 79-82, 2008.
LEITE, M. S. O. et al. Sample size for full-sib Family
evaluation in sugarcane.Pesquisa Agropecuária Brasileira, v. 44, n. 12, p. 1562-1574, 2009.
MARTIN, T. N.et al. Spatial distribution of sunflower cultivars
and the relationship between growth features.Revista Ciência Agronômica, v. 43, n. 2, p. 338-345, 2012.
MOORE, D. S.A estatística básica e sua prática. Rio de Janeiro:
LTC - Livros Técnicos e Científicos Editora, 2000. 482 p. PARANAIBA, P. F.; MORAIS, A. R.; FERREIRA, D. F. Tamanho ótimo de parcelas experimentais: comparação de métodos em experimentos de trigo e mandioca. Revista Brasileira de Biometria, v. 27, n. 1, p. 81-90, 2009.
PIVETTA, L. G.et al. Avaliação de híbridos de girassol e relação entre parâmetros produtivos e qualitativos. Revista Ciência Agronômica, v. 43, n. 3, p. 561-568, 2012.
REHMAN, R.et al. Using multivariate analysis for selecting desirable hybrids in sunflower (Helianthus annuus L.).Pakistan Journal of Botany, v. 44, n. 5, p. 1715-1720, 2012.
RIBEIRO JÚNIOR, J. I.Análises estatísticas no SAEG. Viçosa: Universidade Federal de Viçosa, 2001. 301 p.
SCOTT, A. J.; KNOTT, M. A. Cluster analysis method for grouping means in the analysis of variance.Biometrics, v. 30,
n. 3, p. 507-512, 1974.
SILVA, A. R.; RÊGO, E. R.; CECON, P. R. Tamanho de amostra para caracterização morfológica de frutos de pimenteira.
Horticultura Brasileira, v. 29, n. 1, p. 125-129, 2011.
SILVA, J.; SILVA, P. S. L.; NUNES, R. P. Amostragem e tamanho da amostra da estimação de caracteres da espiga do milho.Pesquisa Agropecuária Brasileira, v. 33, n. 12, p.
1983-1988, 1998.
SILVA, P. S. L. et al. Métodos de amostragem e tamanho da amostra para alguns caracteres do milho.Ciência Agronômica,
v. 24, n. 1/2, p. 5-10, 1993.
SMIRDELE, O. J.; MOURÃO JÚNIOR, M.; GIANLUPPI, D. Avaliação de cultivares de girassol em savana de Roraima.Acta Amazonica, v. 35, n. 3, p. 331-336, 2005.
SOUSA, C. A.; LIRA JÚNIOR, M. A.; FERREIRA, R. L. C. Avaliação de testes estatísticos de comparações múltiplas de médias.Revista Ceres, v. 59, n. 3, p. 350-354, 2012.
VOGT, G. A.; BALBINOT JÚNIOR, A. A.; SOUZA, A. M. Divergência genética entre cultivares de girassol no Planalto Norte Catarinense.Scientia Agraria, v. 11, n. 4, p. 307-315, 2010. WOLKOWSKI, R. P.; REISDORF, T. A.; BUNDY, L. G. Field plot technique comparison for estimating corn grain and dry matter yield.Agronomy Journal, v. 80, n. 2, p. 278-280, 1988.