Rev. Caatinga
COTTON RESPONSE TO WATER DEFICITS AT DIFFERENT GROWTH
STAGES
1JOÃO HENRIQUE ZONTA2*, ZIANY NEIVA BRANDÃO2, JOSIANE ISABELA DA SILVA RODRIGUES3,
VALDINEI SOFIATTI2
ABSTRACT – Water deficit at certain cotton growth stages can cause severe damage to crop development, affecting physiological processes and reducing reproductive structures, with consequent yield losses. The objective of this study was to evaluate the response of cotton cultivars under water deficit applied at different stages of the crop cycle. We compared the number of bolls per meter, cotton yield, and water use efficiency for eight different cotton cultivars under a water deficit of 15 days. We selected the following growth stages: Emergence (EM), First Square (FS), First Flower (FL), Peak Bloom (PB), and First Open Boll (FOB). The control treatment was irrigated with 100% ETc. The experiment was conducted in Apodi, RN State of Brazil, semiarid region, using a sprinkler irrigation system. The number of bolls per meter, cotton yield, and water use efficiency were influenced by the interaction of cultivars x deficit periods. Lowest values were observed for water suppression in the FL and PB stages. When the water deficit was imposed in the initial stages of growth (EM to FS) or after the FOB stage, the cotton yield reduction was not significant. At the same stage and water deficit, the behavior of the different cultivars was similar. Producers are urged to take this information into account when developing irrigation schemes for cotton crops, thereby avoiding water deficits during the most critical periods of the crop cycle.
Key words: Irrigation Management. Shedding. Semiarid.
RESPOSTA DO ALGODOEIRO AO DÉFICIT HÍDRICO EM DIFERENTES FASES DE CRESCIMENTO
RESUMO - O déficit hídrico em determinadas fases do ciclo de cultivo do algodoeiro pode causar severos danos, afetando as estruturas reprodutivas, acarretando perda na produtividade. O objetivo deste trabalho foi avaliar a resposta de cultivares de algodoeiro submetidas ao déficit hídrico em diferentes fases do ciclo de cultivo. Comparou-se o número de capulhos por metro, a produtividade e a eficiência no uso da água em oito cultivares de algodoeiro herbáceo, submetidas a déficit hídrico por 15 dias nos estádios: emergência, emissão do primeiro botão floral, emissão da primeira flor, emissão da primeira maçã, abertura do primeiro capulho e a testemunha irrigada com 100% da ETc. O experimento foi instalado no município de Apodi-RN, região Semiárida do Nordeste, em área irrigada por aspersão. O número de capulhos por metro, a produtividade de algodão em caroço e a eficiência de uso da água foram influenciadas pela interação cultivares x déficit hídrico. Os piores resultados foram observados para o déficit hídrico de 15 dias após a emissão da primeira maçã e da primeira flor. Quando o déficit hídrico foi imposto nas fases de crescimento inicial, após a emissão do primeiro botão floral e após a abertura do primeiro capulho, a perda de produtividade não foi significativa. Dentro de um mesmo período de déficit hídrico, as cultivares se comportaram de maneira similar. Os produtores devem levar essa informação em consideração para ouso da irrigação suplementar e para programação das irrigações, evitando que o déficit hídrico ocorra nos períodos mais críticos do ciclo de cultivo.
Palavras-chave: Manejo da Irrigação. Queda de botões florais. Semiárido.
____________________
*Corresponding author
1Received for publication in 06/17/2016; accepted in 02/03/2017.
Papper extracted from Embrapa Algodão research project, supported by Embrapa.
2Embrapa Algodão, Campina Grande, PB, Brazil; joao-[email protected], [email protected], [email protected].
INTRODUCTION
Cotton (Gossypium hirsutum L.) is the most important fiber crop in the world, with more than 23.70 million tons produced in 2014/2015 (ABRAPA, 2016). However, global climate change, characterized by rising temperatures and changing rainfall patterns, are also affecting the availability of irrigation water. Within a short time, these changes can negatively impact the sustainability of the cotton production in Brazil and worldwide.
Semiarid cotton production areas, characterized by the occurrence of inconsistent rainfall, experience periods of good water availability as well as long and frequent periods of drought throughout the growing season. Currently, dry, short periods are frequent due to climatic changes, causing considerable yield losses even in the Cerrado region, the most important cotton producing area in Brazil. Short periods of water deficit can occur not only due to periods of weather anomalies, but also because of failures in the water pumping system, unexpected maintenance, or even the need of direct supply for other crops which are at critical growth stages.
According to Cordão Sobrinho et al. (2015), although cotton is a species adapted to water deficit, at least 400 to 500 mm of water are required during the growing season to achieve good yields. Dabbert and Gore (2014) observed that cotton production is highly vulnerable to changes in precipitation patterns and decreases in water availability for irrigation.
The number of studies on plant responses to water deficit has increased markedly over the last years, but the majority of these studies examined potted plants in greenhouses and used disparate experimental conditions (LAWLOR; TEZARA, 2009; PINHEIRO; CHAVES, 2011). Because the response to water deficit depends on the frequency, intensity, and duration of the water deficit as well as on the genotype, developmental stage, and tolerance/ acclimation potential of the plant species, it is difficult to make generalizations and evaluate the relevance of the available data for field-grown plants.
Several studies have been conducted, showing that prolonged water deficit during the cotton cultivation cycle affects growth, productivity, and
quality of the fibers (SNOWDEN et al., 2013; ZONTA et al., 2015a, ZONTA et al., 2015b).
The perennial nature and undetermined pattern of cotton growth result in the simultaneous occurrence of various stages of flowering and fruiting. This ambiguity has contributed to conflicting results published in the literature, characterizing the development stage of the cotton cycle as more sensitive to water deficit (LOKA; OOSTERHUIS; RITCHIE, 2011).
Loka and Oosterhuis (2012) affirm that the reproductive phase of the cotton plant is the most sensitive one to water deficit. According to Reddell, Prochaska and Cudrak (1987), the onsetof the flowering period is most sensitive to water deficit in cotton, while for Orgaz, Mateos and Fereres (1992), the most sensitive period occurs during the peak of flowering. On the other hand, numerous studies, such as Cook and El-Zik (1993), showed that the period most sensitive period to water deficitis just after flowering, when the plants were plenty of fruits.
In this context, the present study evaluated the effect of water deficit, occurring in different phases of the cotton crop cycle, on components of production, cotton yield, and water use efficiency.
MATERIAL AND METHODS
The experiment was carried out during the dry season of 2015 (June to November) at the Experimental station of EMPARN - Agricultural Research Company of Rio Grande do Norte state, located in Apodi town, with the central coordinates 5º 37' 19"S and 37º 49' 06"W. The region is located at an altitude between 128 and 132 m.
The climate of the region is semiarid and hot tropical, with a predominance of type BSw´h´, according to the Köppen climate classification. Mean annual precipitation is 920 mm, concentrated in summer and autumn (late December until May). The soil of the experimental area has been classified as eutrophic Cambisol (SANTOS et al., 2013); the texture is sandy-clayey, with 49% sand, 45% clay, and 6% silt. Site fertilization was carried out according to the technical recommendations for the culture, based on the analysis of soil fertility (Table 1).
Table 1. Soil chemical characteristics of the experimental area of Apodi, RN, at a depth of 0.0 to 0.4 m.
pH OM P Na+ K+ Ca2+ Mg2+ H + Al CEC BS
water (g kg-1) (mg kg-1) ..……….(cmolc dm-3)………
6.20 16.4 10.7 0.4 1.6 34.8 10.0 23.1 69.9 46.8
OM – Organic matter; P – Phosphorus; Na – Sodium; K – Potassium; Ca – Calcium; Mg – Magnesium;
Rev. Caatinga
The experimental design was a completely randomized split-plot design with four replications, with periods of drought in the main plots and the upland cotton cultivars in the subplots. The treatments consisted of six periods of water deficit: Emergence (EM), First Square (FS), First Flower (FL), Peak Bloom (PB), First Open Boll (FOB), and the control treatment, which was irrigated under the full irrigation condition, i.e., with 100% ETc. We used eight upland cotton cultivars (BRS 286, BRS 335, BRS 336, BRS 372, BRS 368RF, BRS 369RF, BRS 370RF, and BRS 371RF).
Each experimental unit consisted of four rows with a spacing of 0.8 m, 5.0 m long, covering a total area of 16.0 m2. To avoid side effects, we only
performed measurements in the two central rows. The total irrigation water depth for each treatment is presented in Table 2. We used crop evapotranspiration (ETc), obtained according to the FAO-56 methodology (ALLEN et al., 1998), to determine irrigation depth. For treatments with drought, the period applied consisted of 15 days withholding irrigation in the predetermined phase, according to Table 2. After this period, the plants were irrigated normally, depending on crop evapotranspiration. After the period of water deficit, the first irrigation was carried out based on the water content in the soil in order to increase soil field capacity. Subsequently, irrigation management followed the ETc methodology.
Table 2. Water deficit period in each treatment.
Treatment Start of water suppression Water deficit
period (DAE)
Net irrigation depth (mm)
Emergence (EM) After stand establishment 15–29 650
First Square (FS) Beginning with the first flower bud at least in 10% of the plants
31–45 634
First Flower (FL) Opening of first flower at least in 10% of the plants 43–57 577
Peak Bloom (PB) Boll loading. At least 10% of plants heavily fruited; first bolls completely full.
59–73 584
First Open Boll (FOB) Opening of the first bolls in 10% of the plants After 91 621
Control Treatment Without deficit irrigation during the entire crop cycle 700
DAE – Days after emergence.
The experiment was carried out in a no-tillage system. A mechanized seeder with four lines was used for sowing, without cotton thinning practices. Agronomic and irrigation data are shown in Table 3. Irrigation was performed by a fixed sprinkler system with a spacing between nozzles of 12 x 15 m. Application rate was 9 mm h-1with Christiansen's
Uniformity Coefficient (CUC) and application efficiency (considering wind and evaporation losses) was 85 and 63%, respectively. Irrigation was performed every 3 days, with frequency determined as a function of the soil water storage capacity in order to maintain soil water content above 40% of the available water.
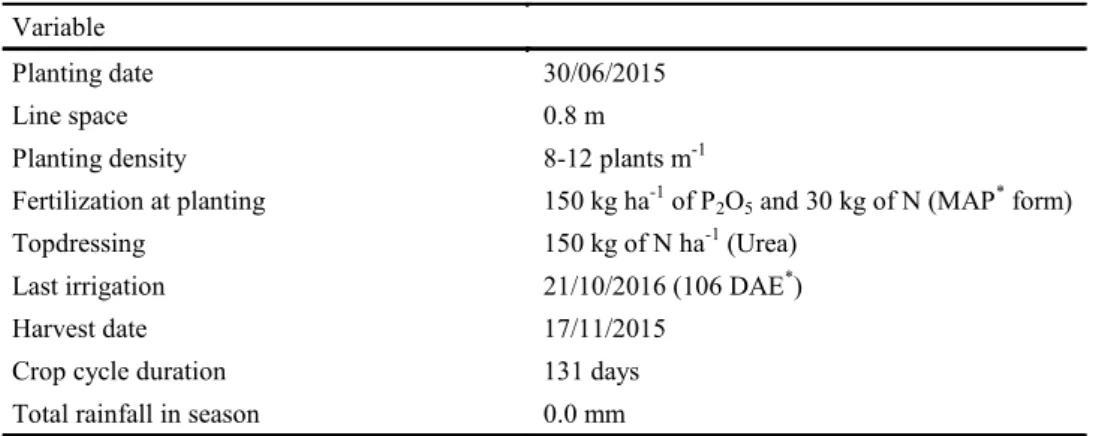
Table 3. Agronomic data and irrigation parameters during the cotton cycle.
Variable
Planting date 30/06/2015
Line space 0.8 m
Planting density 8-12 plants m-1
Fertilization at planting 150 kg ha-1 of P2O5 and 30 kg of N (MAP* form)
Topdressing 150 kg of N ha-1 (Urea)
Last irrigation 21/10/2016 (106 DAE*)
Harvest date 17/11/2015
Crop cycle duration 131 days
Total rainfall in season 0.0 mm
Water replacement was calculated using the following expression:
where:
ITotal– Total irrigation depth, mm;
ETc – Crop evapotranspiration, mm; Ef – Application efficiency, decimal.
Crop evapotranspiration (ETc) is given by Equation 2:
where:
ET0 - Reference evapotranspiration based on the
Penman-Monteith methodology (ALLEN et al., 1998);
Kc - Crop coefficient for cotton, estimated by the number of days after emergence, as given by Equation 3 (BEZERRA et al., 2010).
ITotal = ETc Ef,
ETc = ET0× Kc,
where:
DAE - Days After Emergence.
The daily meteorological data for ET0
determination were obtained from Inmet's (National Institute of Meteorology) automatic weather station, located 350 meters away from the area. Soil water content was determined indirectly in each treatment by a Diviner 200TM probe, which uses frequency
domain reflectometry (FDR). We used the universal equation of calibration, which is recommended by the manufacturer. Field Capacity (FC) and Wilting Point (WP) were evaluated in the laboratory, yielding values of 0.216 and 0.143 cm3 cm-3,
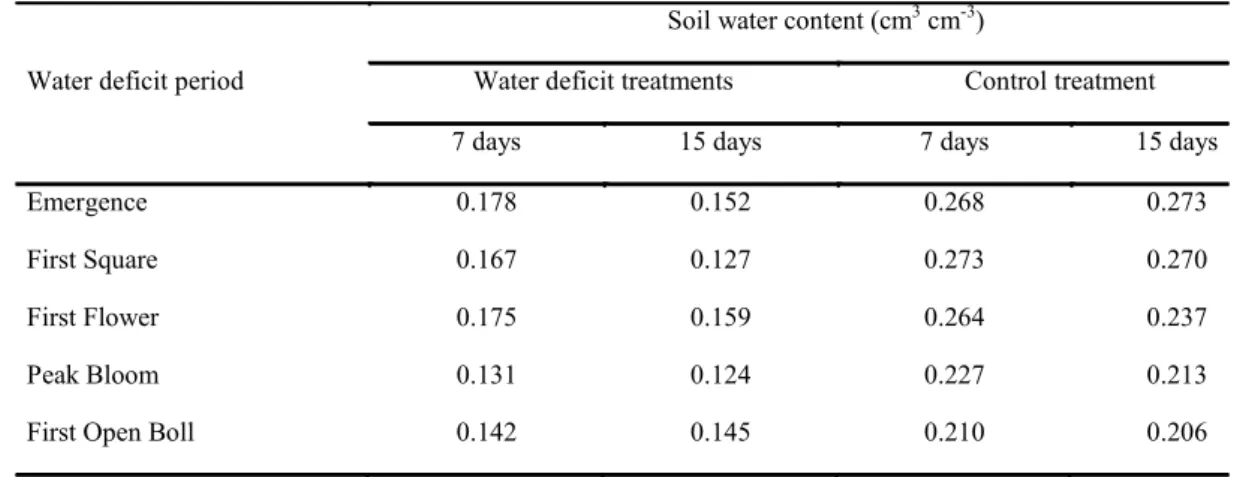
respectively.Table 4 shows the soil water content at the end of each water deficit period, regarding their different stages.
Kc = - 0.00006DAE2+ 0.011DAE + 0.5703,
Table 4. Soil water content at seven and fifteen days after the start of the water deficit period applied at different stages of the cotton cycle and values of the control treatment collected on the same day.
Water deficit period
Soil water content (cm3 cm-3)
Water deficit treatments Control treatment
7 days 15 days 7 days 15 days
Emergence 0.178 0.152 0.268 0.273
First Square 0.167 0.127 0.273 0.270
First Flower 0.175 0.159 0.264 0.237
Peak Bloom 0.131 0.124 0.227 0.213
First Open Boll 0.142 0.145 0.210 0.206
Weed and phytosanitary control were performed as soon as the first symptoms of weed, pests, and diseases appeared.
Cotton was harvesting manually, determining cotton yield and the number of open bolls per meter. To determine the relationship between cotton yield and water consumption by the crop, and to evaluate the cultivar response under water deficit in specific phenological phases, we determined water use efficiency (WUE) according to Equation 4:
where:
WUE - Water Use Efficiency, kg m-3;
Yield - Cotton Yield, kg ha-1;
ID - Irrigation depth, m3 ha-1.
WUE =Yield
ID ,
All data were subjected to variance analysis by F test, with 1 and 5% probability. When variance analysis showed a significant effect, data obtained in different treatments were compared by Tukey´s test at 1 and 5% probability. All statistical analyses were performed using the software package Sisvar 5.3 (FERREIRA, 2011).
RESULTS AND DISCUSSION
Rev. Caatinga
Table 5. Summary of the variance analysis for number of bolls per meter, cotton yield, and water use efficiency (WUE) of upland cotton cultivars subjected to water deficit at different stages of the crop cycle.
Source DF Bolls/m CottonYield (kg ha-1)
WUE
(kg m-3)
Water deficit period 5 12,335.92** 53,080,411.69** 0.871**
a Error 18 106.54 712,851.31 0.017
Cultivar 7 1,492.72** 1,571,568.18** 0.041**
Water deficit period x Cultivar 35 504.55** 813,231.82* 0.021*
b Error 126 229.51 508,848.75 0.013
Total 191
*and** - Significant at 5 and 1% probability, respectively.ns- not significant at 5% probability.
Taking into account all evaluated characteristics, we found significant differences for both periods of water deficit between the cultivars, with significant interactions between factors.
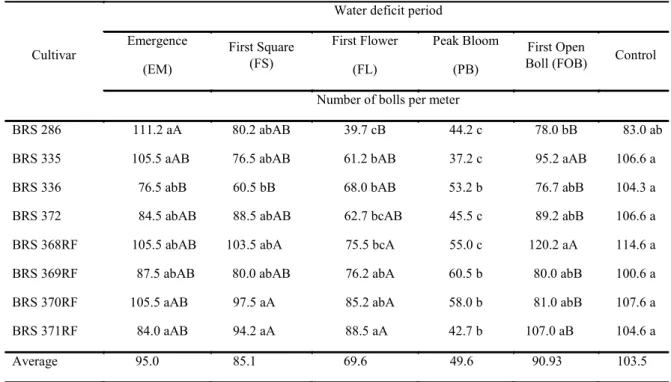
An important characteristic related to cotton yield is the number of bolls per meter (Table 6), since greater boll retention represents higher productivity.
Table 6. Number of bolls per meter as a function of the water deficit applied to specific periods of the crop cycle and different cultivars of upland cotton.
Cultivar
Water deficit period
Emergence
(EM)
First Square (FS)
First Flower
(FL)
Peak Bloom
(PB)
First Open
Boll (FOB) Control
Number of bolls per meter
BRS 286 111.2 aA 80.2 abAB 39.7 cB 44.2 c 78.0 bB 83.0 ab
BRS 335 105.5 aAB 76.5 abAB 61.2 bAB 37.2 c 95.2 aAB 106.6 a
BRS 336 76.5 abB 60.5 bB 68.0 bAB 53.2 b 76.7 abB 104.3 a
BRS 372 84.5 abAB 88.5 abAB 62.7 bcAB 45.5 c 89.2 abB 106.6 a
BRS 368RF 105.5 abAB 103.5 abA 75.5 bcA 55.0 c 120.2 aA 114.6 a
BRS 369RF 87.5 abAB 80.0 abAB 76.2 abA 60.5 b 80.0 abB 100.6 a
BRS 370RF 105.5 aAB 97.5 aA 85.2 abA 58.0 b 81.0 abB 107.6 a
BRS 371RF 84.0 aAB 94.2 aA 88.5 aA 42.7 b 107.0 aB 104.6 a
Average 95.0 85.1 69.6 49.6 90.93 103.5
Values followed by the same letter within one row, and capitalized within one column, do not differ significantly at 5% probability by Tukey´s test.
As expected, the number of bolls per meter was affected by water deficits. The best results were obtained by the Control treatment, followed by EM and FOB treatments. Lowest boll numbers were observed for the treatments FS, FL, and PB, with large reductions in the number of bolls per meter (18, 33, and 53%, respectively). Snowden et al. (2014) observed a reduction of 60% in the number of
reduces boll retention and flowering rate, which corroborates with the results obtained here.
Snowden et al. (2014) found that the highest shedding rate occurred when the water deficit was applied for three weeks from the beginning of the cotton flowering stage, which is also in agreement with the results obtained here. According to Bauer et al. (2012), the problem of the water deficit at flowering is that the culture is acclimatized for unrestricted vegetative growth, because the plant is in optimal water conditions. Consequently, the sudden onset of water suppression in plants not previously stressed can cause severe damage.
According to Brito et al. (2011), the reproductive phases coincide with stages where crop water requirements increased, with water consumption varying between 2.5 and 6 mm day-1
(BEZERRA et al., 2010). Therefore, water deficit in this specific phase has more severe consequences that in other development phases.
Sun et al. (2015) also found that the tolerance to water deficit depends on the plant growth stage; when water deficit occurred at critical stages, such as reproduction, growth and development of the plant may be affected. In our study, soil water content at the end of the complete water deficit period at these stages was 0.127, 0.159, and 0.124 cm3 cm-3, i.e.,
near the wilting point (Table 4). When soil water content reaches the wilting point, plants make significant efforts to preserve water, which can lead to increased leaf temperatures (CARMO-SILVA et al., 2012; SHAHENSHAH; ISODA, 2010) due to the reduction of evaporative capacity, which also has the function of canopy cooling. Under high
temperature conditions on the sheet, the metabolic activity of the plant is affected, with a negative effect on plant growth and development. The number of bolls per meter was less affected when the water deficit was applied to the Emergence (EM) and First Open Boll (FOB) cotton growth stages, since plants had no reproductive structures in the first stage, whereas in the last stage evaluated, all bolls were fully formed.
According to Yeates (2014), bolls are less affected by water deficit and continuously grow after decline of the leaves and internodes. This occurs because water supply is provided by the phloem and not by the xylem. In other words, the water intake by bolls is independent of the water potential gradient in the system soil-plant-atmosphere. Further, according to the same author, fruit structure abortion may occur up to 14 days after anthesis (<2 cm of diameter), when the thickness of the cell wall, between the fruit and stem, prevents the generation of the abscission layer. Guinn (1982) showed another interpretation, in which large floral buds and flowers are less sensitive to shedding under water deficit than young fruits, which corroborates with the results obtained here.
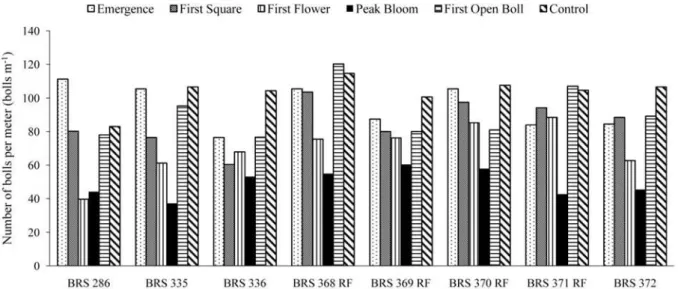
Regarding cultivars, there were no significant differences between the Control treatment and PB, while inthe EM and FS treatments, BRS 336 showed the most unfavorable results. For the FL treatment, most unfavorable results were observed for BRS 286 (Table 6 and Figure 1). According to Baloch et al. (2011), Iqbal et al. (2010), and Niu et al. (2013), abiotic stresses tolerance, including water deficit tolerance, varies with genotype.
Figure 1. Number of bolls per meter for upland cotton cultivars as a function of water deficit applied at different stages of the crop cycle.
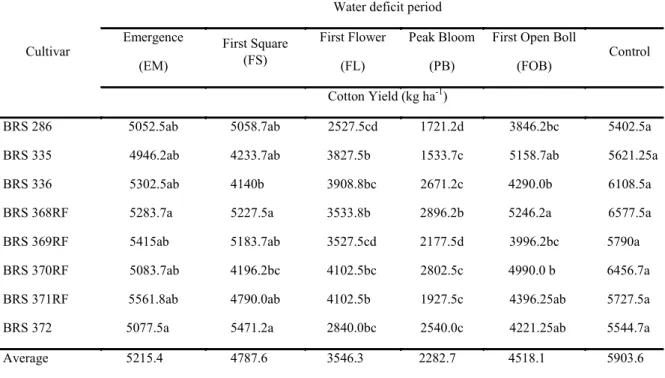
As a consequence of the accentuated shedding of flowers and young bolls, cotton yield was diminished, as presented in Table 7 and Figure 2. Analyzing cotton yield (Table 7),we observed that, for all cultivars, lowest values were obtained in
Rev. Caatinga
Thus, we assume that, when the water deficit was applied in these phases, the plants formed less reproductive structures and experienced high falling of reproductive structures (flowers and young bolls). This sheddingis characterized by severe productivity losses, seriously compromising cotton yield.
Alishah and Ahmadikhah (2009), evaluating
different upland cotton cultivars under water deficit, found that the cotton yield reduction under water deficit was mainly due to the lower number of bolls per plant, given that the number of bolls formed by plants under such condition was lower than under optimal water conditions.
Table 7. Cotton yield as a function of water deficit applied at specific periods of the crop cycle and different cultivars of upland cotton.
Cultivar
Water deficit period
Emergence
(EM)
First Square (FS)
First Flower
(FL)
Peak Bloom
(PB)
First Open Boll
(FOB)
Control
Cotton Yield (kg ha-1)
BRS 286 5052.5ab 5058.7ab 2527.5cd 1721.2d 3846.2bc 5402.5a
BRS 335 4946.2ab 4233.7ab 3827.5b 1533.7c 5158.7ab 5621.25a
BRS 336 5302.5ab 4140b 3908.8bc 2671.2c 4290.0b 6108.5a
BRS 368RF 5283.7a 5227.5a 3533.8b 2896.2b 5246.2a 6577.5a
BRS 369RF 5415ab 5183.7ab 3527.5cd 2177.5d 3996.2bc 5790a
BRS 370RF 5083.7ab 4196.2bc 4102.5bc 2802.5c 4990.0 b 6456.7a
BRS 371RF 5561.8ab 4790.0ab 4102.5b 1927.5c 4396.25ab 5727.5a
BRS 372 5077.5a 5471.2a 2840.0bc 2540.0c 4221.25ab 5544.7a
Average 5215.4 4787.6 3546.3 2282.7 4518.1 5903.6
Values followed by the same letter within one column do not differ at 5% probability by Tukey´stest.
Similarly, we observed no significant difference in cotton yield when the water deficit was applied at early growth stages, such as in the treatments EM and FS, compared to the control treatment (Table 7), suggesting that the plant had sufficient time to recover from water deficit. Water deficit applied at the boll opening stage (FOB) did not severely affect
the crop yield due to the fact that most fruits had already been formed in this stage. This result can provide a perspective to the use of regulated deficit irrigation in cotton, applying minor irrigation water depth in phases where cotton plants are more tolerant to water deficit, thereby increasing water use efficiency.
Guinn and Mauney (1984) stated that the severe water deficit applied to cotton limited the yield as a function of the decrease in the number of bolls per area, which occurs due to the reduction in flowering and young boll shedding. Other authors, such as Wen et al. (2013), also affirmed that water deficit in cotton causes boll shedding and thus lower productivity. Loka and Oosterhuis (2012) showed that the reproductive stage is the most sensitive stage to water deficit in cotton, while De Kock, De Bruyn and Human (1993) stated that the peak bloom phase is most sensitive to water deficit, confirming the results found here.
Comparing different cultivars within each water deficit period, similarly to the results found for
the number of bolls per meter, there was no significant difference between cultivars, demonstrating that the cultivars behaved in a similar way under water deficit. However, emphasis should be given to the cultivars BRS 368RF and BRS 370RF, which provided the highest yields in both conditions when compared to the control and PB treatments (Figure 2).
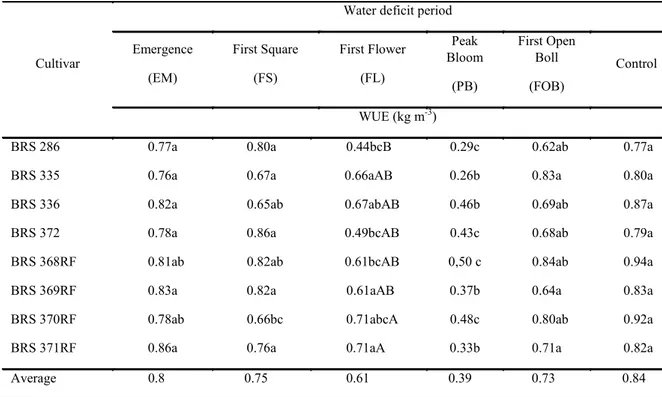
Concerning the regulated water deficit, an important factor to be evaluated, especially in arid and semiarid regions, in which water availability is an important limitation, is the water use efficiency (WUE) of crops. Table 8 presents the average values of the WUE of cotton cultivars under water deficit applied at different stages of the crop cycle.
Table 8. Water use efficiency (WUE) as a function of water deficit applied at specific periods of the crop cycle and to different cultivars of upland cotton.
Cultivar
Water deficit period
Emergence
(EM)
First Square
(FS)
First Flower
(FL)
Peak Bloom
(PB)
First Open Boll
(FOB)
Control
WUE (kg m-3)
BRS 286 0.77a 0.80a 0.44bcB 0.29c 0.62ab 0.77a
BRS 335 0.76a 0.67a 0.66aAB 0.26b 0.83a 0.80a
BRS 336 0.82a 0.65ab 0.67abAB 0.46b 0.69ab 0.87a
BRS 372 0.78a 0.86a 0.49bcAB 0.43c 0.68ab 0.79a
BRS 368RF 0.81ab 0.82ab 0.61bcAB 0,50 c 0.84ab 0.94a
BRS 369RF 0.83a 0.82a 0.61aAB 0.37b 0.64a 0.83a
BRS 370RF 0.78ab 0.66bc 0.71abcA 0.48c 0.80ab 0.92a
BRS 371RF 0.86a 0.76a 0.71aA 0.33b 0.71a 0.82a
Average 0.8 0.75 0.61 0.39 0.73 0.84
Values followed by the same letter within one row, and capitalized within one column, do not differ significantly at 5% probability by Tukey´s test.
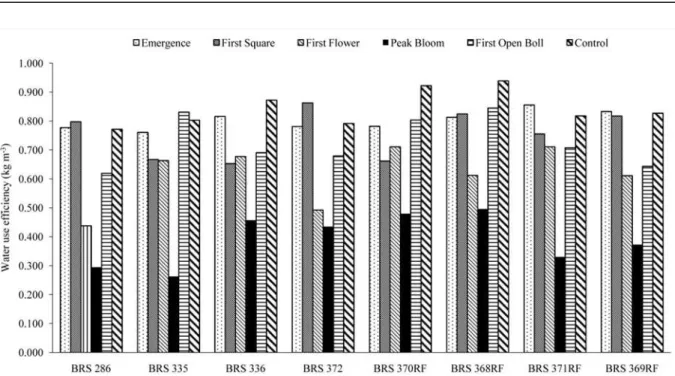
The behavior of different cultivars evaluated in relation to the WUE was similar, with average values from 0.39 to 0.84 kg m-3, as shownin Table 8
and Figure 3. Generally, lowest values were observed for the treatments FL and PB. No differences were observed for EM and FS when compared to the control treatment. This result can be explained by the fact that in these phases, crop water consumption is still relatively low, between 2 and 4 mm day-1 (BEZERRA et al., 2010), which resulted in
water savings of only 7 and 10% for EM and FS periods, leading toa yield decrease of 18 and 11%, respectively.
Among the cultivars evaluated within each
water deficit period, there was a difference only when the water deficit was applied during the flowering period (Table 8), highlighting BRS371RF and BRS370RF as good cultivars, with WUE levels of 0.71 kg m-3. On the other hand, the cultivar BRS
286 only reached a WUE level of 0.44 kg m-3.
Overall, however, the evaluated cultivars showed a similar behavior, irrespective of the growth cycle stage.
Rev. Caatinga
Figure 3. Water use efficiency of upland cotton cultivars as a function of the water deficit applied at different stages of the crop cycle.
For all cultivars, the best results were obtained in the control treatment. Our findings are in agreement with those by Oweis, Farahani and Hachum (2011), who obtained the highest WUE values in the fully irrigated treatment when compared to treatments with water deficit. According to these authors, from a biological point of view, the fact that no significant differences were found between the WUE values in the water deficit treatments at the EM, FS, and FOB stages, when compared to the control treatment, shows that irrigation at water deficit levels in cotton may not necessarily increase WUE values.
Regarding the range of values, the WUE levels achieved can be considered elevated, except for the peak bloom treatment, referring to the findings of Zonta et al. (2016), Singh, Rao and Regar (2010), and Dagdelen et al. (2009), who observed WUE values ranging from 0.4 to 0.8 kg m-3 in well
irrigated treatments, i.e., without water deficit. This demonstrates that irrigation with regulated water deficit can be a good option for water saving in cotton plantations, particularly if carried out in phases where the culture is more tolerant to water deficit, which are the stages emergence to flower bud emission and during boll opening.
Under water deficit in the initial growth phase, just after the emission of the first flower bud and after the first boll opening, the yield decrease is less severe, mainly because the plant still has sufficient time to recover from water deficit at the beginning of the crop cycle. When the deficit occurs after boll opening, the plants already have alower water demand, since most of the fruits are already formed and not susceptible to shedding.
Nevertheless, prolonged water deficit in cotton crops during the period from flowering to loading bolls negatively impacts crop productivity, resulting in substantial losses, mainly due to decrease of reproductive structures and excessive boll shedding, which results in lower numbers of bolls per plant. This illustrates the effects of water deficits in critical stages of the cotton growth crop cycle.
Farmers are urged to take this information into account when developing irrigation schemes for cotton crops, even in the case of supplemental irrigation of rainfed crops. The results of our study provide valuable reference points for the preservation of irrigation water in regions with limited availability, avoiding water deficits during the most critical periods of the crop cycle.
CONCLUSION
Water deficit causes greater losses in cotton yield during the First Flower and Peak Bloom phenological stages, because of the high water demand in these phases.
Cotton yield decrease under water deficit was less severe during the Emergence, First Square, and First Open Boll phases.
Water use efficiency of cotton plants was lowest when water deficit occurred in the First Flower and Peak Bloom phases.
REFERENCES
ALISHAH, O.; AHMADIKHAH, A. The effects of drought stress on improved cotton varieties in Golesatnprovince of Iran. International Journal of Plant Production, Gorgan, v. 3, n. 1, p. 17-26, 2009.
ALLEN, R. et al. Crop evapotranspiration: Guidelines for computing crop water requirements. Rome: FAO, 1998. 300 p. (Irrigation and Drainage Paper, 56).
ASSOCIAÇÃO BRASILEIRA DE PRODUTORES DE ALGODÃO - ABRAPA. Estatísticas: Números do Algodão. Disponível em: <https:// www.abrapa.com.br/estatisticas/Paginas/Algodao-no -Mundo.aspx>. Acesso em: 28 Abr. 2016.
BALOCH, M. J. et al. Drought tolerance studies through WSSI and stomata in upland cotton. Pakistan Journal of Botany, Karachi, v. 43, n. 5, p. 2479-2484, 2011.
BAUER, P. W. et al. Water-sensitivity of cotton growth stages. In: PERRY, C. D.; BARNES, E. (Eds.). Cotton irrigation management for humid regions. Cary: Cotton Incorporated, 2012. v. 1, cap. 4, p. 17-20.
BEZERRA, J. R. C. et al. Evapotranspiration and crop coefficient of irrigated cotton crop cultivar BRS200 Marrom. RevistaBrasileira de Engenharia Agrícola e Ambiental, Campina Grande, v. 14, n. 6, p. 625-632, 2010.
BRITO, G. G. et al. Physiological traits for drought phenotyping in cotton. Acta Scientiarum Agronomy, Maringá, v. 33, n. 1, p. 117-125, 2011.
CARMO-SILVA, A. E. et al. Decrease CO2
availability and inactivation of Rubisco limit photosynthesis in cotton plants under heat and drought stress in the field. Environmental and Experimental Botany, Amsterdam, v. 83, n. 1, p. 1-11, 2012.
COOK, C. G.; EL-ZIK, K. M. Fruiting of cotton and lint yield of cotton cultivars under irrigated and non-irrigated conditions. Field Crops Research, Amsterdam, v. 33, n. 4, p. 411-421, 1993.
CORDÃO SOBRINHO, F. P. et al. Fiber quality of upland cotton under different irrigation depths. RevistaBrasileira de EngenhariaAgrícola e Ambiental, Campina Grande, v. 19, n. 11, p. 1057-1063, 2015.
DABBERT, T. A.; GORE, M. A. Challenges and perspectives on improving heat and drought stress resilience in cotton. The Journal of Cotton Science,
Baton Rouge, v. 18, n. 3, p. 393-409, 2014.
DAGDELEN, N. et al. Different drip irrigation regimes affect cotton yield, water use efficiency and fiber quality in western Turkey. Agricultural Water Management, Amsterdam, v. 96, n. 1, p. 111-120, 2009.
DE KOCK, J.; DE BRUYN, L. P.; HUMAN J. J. The relative sensitivity to plant water stress during the reproductive phase of upland cotton. Irrigation Science, Berlin, v. 14, n. 1, p. 239-244,1993.
FERREIRA D. F. Sisvar: a computer statistical analysis system. Ciência e Agrotecnologia, Lavras, v. 35, n. 6, p. 1039-1042, 2011.
GUINN, G. Fruit age and changes in abscisic acid content, ethylene production, and abscission rate of cotton fruits. Plant Physiology, Rockville, v. 69, n. 2, p. 345-352, 1982.
GUINN, G.; MAUNEY, J. R. Moisture effects on cotton. I. Effects of moisture status on flowering. Agronomy Journal, Madison, v. 76, n. 1, p. 90-94, 1984.
GWATHMEY, C. O.; LEIB, B. G.; MAIN, C. L. Lint yield and crop maturity responses to irrigation in a short-season environment. The Journal of Cotton Science, Baton Rouge, v. 15, n. 1, p. 1–10, 2011.
IQBAL, K. et al. Assessment of cotton (Gossypium hirsutum) germplasm under water stress condition. International Journal of Agriculture & Biology, Faisalabad, v. 12, n. 2, p. 251-255, 2010.
LAWLOR, D. W., TEZARA, W. Causes of decreased photosynthetic rate and metabolic capacity in water deficient leaf cells: a critical evaluation of mechanisms and integration of processes. Annals of Botany, Oxford, v. 103,n. 4, p. 561-579, 2009.
LOKA, D. A.; OOSTERHUIS, D. M. Water stress and reproductive development in cotton. In OOSTERHUIS, D. M.; COTHREN, J. T. (Eds.). Flowering and Fruiting in Cotton. Cordova: The Cotton Foundation, 2012. Chapter 5, p. 51-58.
LOKA, D. A.; OOSTERHUIS, D. M.; RITCHIE, G. L. Water-deficit stress in cotton. In: OOSTERHUIS, D. M. (Ed.). Stress Physiology in Cotton. Cordova: The Cotton Foundation, 2011. Chapter 3, p. 37-72.
Rev. Caatinga
ORGAZ, F.; MATEOS, L.; FERERES, E. Season length and cultivar determine optimum evapotranspiration deficit in cotton. Agronomy Journal, Madison, v. 84, n. 4, p. 700-706, 1992.
OWEIS, T. Y.; FARAHANI, H. J.; HACHUM A. Y. Evapotranspiration and water use of full and deficit irrigated cotton in the Mediterranean environment in northern Syria. Agricultural Water Management, Amsterdam, v. 98, n. 8, p. 1239-1248, 2011.
PINHEIRO, C.; CHAVES, M. M. Photosynthesis and drought: can we make metabolic connections from available data. Journal of Experimental Botany, Oxford, v. 62, n. 3, p. 869-882, 2011.
REDDELL, D.;PROCHASKA, J.; CUDRAK, A. Sequential water stress in cotton: A stress day index model. St. Joseph: ASAE, 1987.24 p.
SANTOS, H. G. et al. Sistema Brasileiro de Classificação de Solos. 3. ed. Rio de Janeiro, RJ: Embrapa Solos, 2013. 353 p.
SHAHENSHAH; ISODA, A. Effects of water stress on leaf temperature and chlorophyll fluorescence parameters in cotton and peanut. Plant Production Science, Tokio, v. 13, n. 3, p. 269-278, 2010.
SINGH, Y.; RAO, S. S; REGAR, P. L. Deficit irrigation and nitrogen effects on seed cotton yield, water productivity and yield response factor in shallow soils of semi-arid environment. Agricultural Water Management, Amsterdam, v. 97, n. 7, p. 965-970, 2010.
SNOWDEN, C. et al. Multiple irrigation levels affect boll distribution, yield, and fiber micronaire in cotton. Agronomy Journal, Madison, v. 105, n. 6, p. 1536-1544, 2013.
SNOWDEN, C. et al. Timing of episodic drought can be critical in cotton. Agronomy Journal, Madison, v. 106, n. 2, p. 452-458, 2014.
SUN, Y.et al. Growth responses of an interspecific cotton breeding line and its parents to controlled drought using an automated irrigation system. The Journal of Cotton Science, Baton Rouge, v. 19, n. 2, p. 290-297, 2015.
WEN, Y.et al. Lint yield, lint quality, and economic returns of cotton production under traditional and regulated deficit irrigation schemes in southwest Texas. The Journal of Cotton Science, Baton Rouge, v. 17, n. 1, p. 10-22, 2013.
YEATES, S. Efeitos do estresse hídrico na fisiologia do algodoeiro. In: ECHER, F. R. (Ed.). O algodoeiro e os estresses abióticos:
temperatura, luz, água e nutrientes. Cuiabá: Instituto Mato-Grossense do Algodão – IMAmt, 2014, chapter 3, p. 63-79.
ZONTA, J. H. et al. Efeito da irrigação no rendimento e qualidade de fibras em cultivares de algodoeiro herbáceo. Revista Caatinga, Mossoró, v. 28, n. 4, p. 43–52, 2015a.
ZONTA J. H. et al. Yield of cotton cultivars under different irrigation depths in the Brazilian semi-arid region. Revista Brasileira de Engenharia Agrícola e Ambiental, Campina Grande, v. 19, n. 8, p. 748-754, 2015b.