SURFACE MAPPING, ORGANIC MATTER AND WATER
STOCKS IN PEATLANDS OF THE SERRA DO ESPINHAÇO
MERIDIONAL - BRAZIL
(1)Márcio Luiz da Silva(2), Alexandre Christófaro Silva(3), Bárbara Pereira Christófaro Silva(4), Uidemar Morais Barral(4), Pablo Gomes e Souza Soares (5) & Pablo
Vidal-Torrado(6)
SUMMARY
Peatlands are soil environments that store carbon and large amounts of water, due to their composition (90 % water), low hydraulic conductivity and a sponge-like behavior. It is estimated that peat bogs cover approximately 4.2 % of the Earth’s surface and stock 28.4 % of the soil carbon of the planet. Approximately 612 000 ha of peatlands have been mapped in Brazil, but the peat bogs in the Serra do Espinhaço Meridional (SdEM) were not included. The objective of this study was to map the peat bogs of the northern part of the SdEM and estimate the organic matter pools and water volume they stock. The peat bogs were pre-identified and mapped by GIS and remote sensing techniques, using ArcGIS 9.3, ENVI 4.5 and GPS Track Maker Pro software and the maps validated in the field. Six peat bogs were mapped in detail (1:20,000 and 1:5,000) by transects spaced 100 m and each transect were determined every 20 m, the UTM (Universal Transverse Mercator) coordinates, depth and samples collected for characterization and determination of organic matter, according to the Brazilian System of Soil Classification. In the northern part of SdEM, 14,287.55 ha of peatlands were mapped, distributed over 1,180,109 ha, representing 1.2 % of the total area. These peatlands have an average volume of 170,021,845.00 m3 and stock 6,120,167 t (428.36 t ha-1) of organic matter and 142,138,262 m3 (9,948 m3 ha-1) of water. In the peat bogs of the Serra do Espinhaço Meridional, advanced stages of decomposing (sapric) organic matter predominate, followed by the intermediate stage (hemic). The vertical growth rate of the
(1) Part of the Dissertation of the first author, for a postgraduate degree in Forest Science, Federal University of Jequitinhonha and
Mucuri Valleys - UFVJM, Brazil. Received for publication on September 12, 2012 and approved on June 24, 2013.
(2) Professor at IFSULDEMINAS - Campus Inconfidentes. Praça Tiradentes, 416, Centro. CEP 37576-000 Inconfidentes (MG),
Brazil. E-mail: [email protected]
(3) Associate Professor at the Department of Forest Engineering - UFVJM. MG 367, Km 583. CEP 39.100-000 Diamantina (MG),
Brazil. E-mail: [email protected]
(4) Scientific Initiation students in Agronomy - UFVJM. E-mail: [email protected]; [email protected] (5) Agronomist, Master in Crop Production - UFVJM. E-mail: [email protected]
(6) Full Professor at the Department of Soil Science, Agriculture School "Luiz de Queiroz" - ESALQ/USP. Av. Pádua Dias, 11. CEP
peatlands ranged between 0.04 and 0.43 mm year-1, while the carbon accumulation rate varied between 6.59 and 37.66 g m-2 year-1. The peat bogs of the SdEM contain the headwaters of important water bodies in the basins of the Jequitinhonha and San Francisco Rivers and store large amounts of organic carbon and water, which is the reason why the protection and preservation of these soil environments is such an urgent and increasing need.
Index terms: Histosols, GIS, vertical growth rate, rate of carbon accumulation, radiocarbon age.
RESUMO:MAPEAMENTO, ESTOQUE DE MATÉRIA ORGÂNICA E DE ÁGUA
DAS TURFEIRAS DA SERRA DO ESPINHAÇO MERIDIONAL, MG
Turfeiras são pedoambientes que estocam carbono e água. Em razão da sua composição (90 % de água) e da sua baixa condutividade hidráulica, as turfeiras constituem grandes reservatórios de água, apresentando comportamento do tipo “esponja”. Estima-se que as turfeiras cubram aproximadamente 4,2 % da superfície da Terra e estoquem 28,4 % do carbono dos solos do planeta. Foram mapeados aproximadamente 612 mil ha de turfeiras no Brasil; entretanto, as turfeiras na Serra do Espinhaço Meridional (SdEM) não foram incluídas. Os objetivos deste trabalho foram mapear as turfeiras da porção norte da Serra do Espinhaço Meridional e estimar seu estoque de matéria orgânica e o volume de água por elas armazenado. As turfeiras foram pré-identificadas e mapeadas por meio de técnicas de geoprocessamento e sensoriamento remoto, utilizando os softwares ArcGIS 9.3, ENVI 4.5 e GPS Trackmaker Pro e validadas em trabalhos de campo. Seis turfeiras foram mapeadas detalhadamente (escala entre 1:20.000 e 1:5.000), por meio de transectos espaçados por 100 m e em cada transecto foram determinadas, a cada 20 m, as coordenadas UTM (Universal Transversa de Mercator) e a profundidade e coletadas amostras para caracterização e determinação do teor de matéria orgânica, de acordo com o Sistema Brasileiro de Classificação de Solos. Foram mapeados 14.287,55 ha de turfeiras, distribuídas ao longo de 1.180.109 ha, o que representa 1,2 % da
área total. Essas turfeiras ocupam um volume médio de 170.021.845,00 m3, estocam 6.120.167
t de matéria orgânica (428,36 t ha-1) e armazenam 142.138.262 m3 de água (9.948 m3 ha-1).
Nas turfeiras da Serra do Espinhaço Meridional predominam os estádios de decomposição da matéria orgânica avançado (sáprico), seguido do intermediário (hêmico); sua taxa de
crescimento vertical variou entre 0,04 e 0,43 mm ano-1, enquanto a taxa de acúmulo de carbono
oscilou entre 6,59 e 37,66 g m-2 ano-1. As turfeiras da SdEM formam as cabeceiras de importantes
cursos d’água das bacias dos rios Jequitinhonha e São Francisco e armazenam grandes quantidades de carbono orgânico e água, o que fundamenta a necessidade urgente e emergente de proteger e preservar esses pedoambientes.
Termos de indexação: Organossolos, geoprocessamento, taxa de crescimento vertical, taxa de acúmulo de carbono, idades radiocarbônicas.
INTRODUCTION
The Serra do Espinhaço consists of a set of elevations aligned in the north-south direction, from the Piauí-Bahia-Pernambuco State boundaries in the North to the central region of Minas Gerais in the South (Almeida Abreu & Renger, 2002). The southern part (SdEM) has a length of about 300 km, reaching from the Quadrilátero Ferrífero (19.5° S) to the region
of Olhos d’Água (17o S), covering about 3.5 million
ha, where about 700 000 people live in 53 counties (Silva et al., 2005). Due to its impressive scenic beauty, endemic biodiversity in rare and peculiar natural systems, for example peatlands, the region was classified as an “Earth Biosphere Reserve” by UNESCO. As for the geodynamic evolution of the Espinhaço, a succession of denudational and depositional events
segmented the relief of the mountains and formed five levels of planes between 1,800 and 1,000 m asl (Saadi & Valadão, 1987), corresponding to the leveled surfaces Gondwana, Post-Gondwana, South American, Paraguaçu and Velhas (King, 1956).
It is estimated that there are about 420 million ha of peatlands on the planet, equivalent to 4.2 % of the Earth’s surface (Gorham, 1991). The majority, about 350 million ha, is found in the Northern Hemisphere, and between 30.5 and 45.9 million ha in the tropics (Rieley et al., 2008). However, the distribution map of Histosols on the planet (FAO, 1990) does not consider these soils in Brazil. In this country, peatlands occupy approximately 611,883 ha, corresponding to around 0.07 % of the national territory (Valladares, 2003). However, in the said study, the peat bogs in the SdEM were not mentioned.
Peatlands are important carbon reserves. Martinelli et al. (2009) estimated that the carbon stock in soils on the planet is in the order of 1.6 trillion tons, spread over about 10 billion ha. Analyzing the data of Gorham (1991) and Martinelli et al. (2009), the peatlands represent 4.2 % of all soil on the planet and store 28.4 % of its carbon.
Another strategic importance of peat bogs is the function of constituting large water reservoirs, since they consist to about 90 % of water (IPCC, 2001; Sire, 2010). They have a high water holding capacity and low hydraulic conductivity (Valladares, 2003; Takeshi et al., 2008), resulting in a sponge-like behavior (Ingram, 1983).
The hypothesis of this study is that the SdEM peatlands store significant amounts of organic matter and water. The objective of this study was to map the peat bogs of the northern part of SdEM, to estimate the pool of organic matter and the volume of water stored therein.
MATERIAL AND METHODS Characterization of the study area
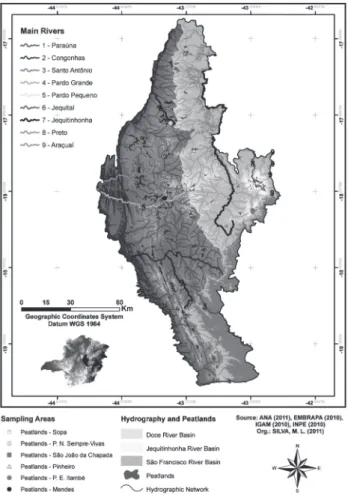
The study area comprises an area of 1,180,109 ha of the Serra do Espinhaço Meridional (SdEM), in
Minas Gerais (17o 40’- 19o 30’ S, 42o - 44o W) (Figure 1).
The Serra do Espinhaço borders the southeastern San Francisco craton in the south and has a length of about 300 km in the S-N direction, from the Iron Ore Quadrilateral, near Belo Horizonte, to the region of Olhos d’Água, north of Diamantina. The climate of the region is CwB (Köppen classification), i.e., a mesothermal climate with rainy and mild summers.
The average annual temperature is 18.7 oC, winters
are cold and dry and summers humid and mild, and the average annual rainfall is 1,500 mm (Silva et al., 2005).
In the Serra do Espinhaço, the plane surfaces are separated by areas with a high degree of dissection, with a hilly and steep relief and very frequent metasandstone outcrops of the Espinhaço Supergroup. The predominant soils are Lithic Ustorthents, Hydromorphic Quartzipsamments and Orthic
Quartzipsamments (Silva et al., 2005), which are substrate types of the Cerrado (Brazilian Savanna Biome). In several plane surface depressions, peatlands contain headwaters from which numerous dark watercourses originate.
Cartography
Database and radar and satellite image acquisition
All cartographic maps and characterization of the study area were compiled from field observations (using GPS and IBGE topographic map) and the database of the National Water Agency (ANA), the Brazilian Agricultural Research Corporation (Embrapa), the Brazilian Institute of Environment and Renewable Natural Resources (IBAMA), the Brazilian Institute of Geography and Statistics (IBGE), the Minas Gerais Institute of Water Management (IGAM), the National Institute for Space Research (INPE), GeoMINAS, Ministry of Environment (MMA) and Company of Mineral Resources Research (CPRM), obtained in 2009, 2010 and 2011.
To cover the entire study area, radar images corresponding to the maps SE23XC (Pirapora),
SE23ZA (Curvelo), SE23ZB (Guanhães), SE23ZC (Belo Horizonte), SE23ZD (Ipatinga) and SE23XD (Chapel) at the scale of 1:250,000, were provided by Embrapa (Shuttle Radar Topography Mission - SRTM obtained by NASA).
The Landsat-5 satellite images were acquired from the INPE database between 2010 and 2011. The temporal resolution of bands 3, 4, 5 and 7 of orbit 218 and points 72 and 73 (representing the entire SdEM) covered the period between 01.01.2009 and 11.26.2010.
Mapping of the peatlands
The peatlands were pre-identified and delineated based on aerial photographs, and on Google Earth, Landsat-5 satellite and radar images, using the programs ENVI 4.5 and ArcGIS 9.3. The identification was validated by field work.
In the field, the formation pattern of peatlands, which was repeated at all sampled points, was interpreted. Peat bogs develop at slightly depressed to plane sites, where drainage is blocked by rocky outcrops and small forest patches appear as typical feature. The pattern, shape, texture and size of objects in aerial photographs (Rocha, 2007), were also used in the identification of the peatlands.
The radar images provided by Embrapa contributed significantly to the determination of the pattern of peatlands and were useful in the characterization and verification of the spatial distribution of these soil environments on the surfaces of SdEM. They were essential for the identification of the typical morphological features of peat environments.
With the corrected and recorded mosaic satellite image (Moreira, 2011), the peat bogs were identified and all other elements in the landscape eliminated (water, bare soil, rock, native forest, planted forest), by the maximum likelihood supervised classification (MAXVER) of ENVI 4.5 Software (accuracy 93.3 %, estimation error 6.7 %). After these steps, the classification was refined with validation by new fieldwork. Finally, all peatland areas were vectored and the area and volume calculated, using program
ArcGIS 9.3, option calculate geometry, and GPS
TrackMaker Pro. The volume estimates may be inaccurate, since they are based on an average depth obtained from points measured on transects and the surfaces of the bottom of the peatlands are irregular. However, they offer a comparative order of magnitude based on mapping procedures used for other peatlands (Pontevedra-Pombal, 2002).
Sampling
The sampling procedure of peatlands consisted of pushing a PVC pipe (230 cm long and 50 mm diameter) at representative points into the peat substrate, until reaching the rock or sand base underneath. Then the tube was closed, removed from the sampling site and placed horizontally, to remove the sample. Ten
samples were collected from five transects in peatland 1 (Sopa), 10 in three transects in peatland 2 (District of São João da Chapada I), 10 in the three transects in peatland 3 (São João da Chapada II), 21 in four transects in peatland 4 (Pinheiro), six in one transect in peatland 5 (Sempre-Vivas II), and 10 in two transects in peatland 6 (Sempre-Vivas III), at a total of 77 sampling points.
In the field, the decomposition stage of the bog layers was determined on the von Post decomposition scale (Stanek & Silc, 1977), described by Embrapa (2006).
Analytical determinations
Histosols were analyzed and characterized as described by Embrapa (2006). The contents of unrubbed fiber (RF), rubbed fiber (RF), solubility in
sodium pyrophosphate, pH in CaCl2, soil bulk density
(SBD), organic matter density (OMD), mineral material content (MM), organic matter content (OM), minimum residue (MR) and gravimetric moisture (GM). The content of organic carbon (OC) was estimated by assuming that the mass of organic matter consists of 58 % carbon (Brunetto at al., 2006).
Carbon isotopes (δ13C and 14C) were determined
by liquid scintillation spectrometry of low background radiation and the results of radiocarbon dating were corrected for the natural isotopic fractionation
(-25 ‰) and presented at conventional 14C ages in
years before present (BP) at 1σ (68.3 % probability)
(Pessenda & Camargo, 1991).
Determination of the volume of water stored in peatlands
Six peatlands were mapped in detail in the field and sampled for the characterization of Histosols (Santos et al., 2005; Embrapa, 2006). They were divided into transects spaced 100 m apart. At intervals of 20 m along the transects, the depth was measured with a probe and the point georeferenced by GPS. Based on the average depth of the six peatlands and the total bog area mapped in SdEM, the total volume was calculated. With these data and the method proposed by Campos et al. (2012), the water volume stored in the SdEM peatlands was estimated.
Determination of rates of vertical growth (VGR) and of carbon (CAR) and organic matter accumulation in the peatlands
Vertical growth rates (VGR) and carbon accumulation (CAR) of peatlands were determined from the following formulas:
VGR = (ADD - ADU)/(RAD - RAU),
where: VGR: vertical growth rate (mm year-1), ADD:
present (BP), RAU: radiocarbon age of the uppermost sample (BP).
CAR = (ADD - ADU) x SBD x OC x 10/(RAD - RAU),
where: CAR: carbon accumulation rate (g m-2 year-1),
SBD: soil bulk density, OC: organic carbon (dag kg-1).
The total pool of organic matter (TPOM) and the average pool of organic matter (APOM) of peatlands were estimated according to the following formulas:
TPOM = V x MSBD x OM x 0.164/100, where: TPOM: total pool of organic matter (t), V: volume
of peatland (m3);MSBD: mean soil bulk density (t m-3);
OM: average content of organic matter (dag kg-1);
0.164: constant [average content of solids found in peatlands in SdEM, Campos et al. (2012)].
APOM = TPOM/A,
where: APOM: average pool of organic matter (t ha-1);
TPOM: total pool of organic matter (t), A: peatland area (ha).
RESULTS AND DISCUSSION
Morphological, physical and chemical properties of peatlands
Peatlands have a dark color (brightness value between 3 and 4 and chroma between 2 and 4, on the Munsell Soil Color Chart) and extremely acidic pH in
CaCl2, with averages ranging from 2.99 to 3.76 (Table 1).
According to Ebeling et al. (2011) and Andriesse (1984), the characteristically low pH values of peat environments are directly related to the organic acids formed during the process of OM mineralization. The
dark color and pH values (in CaCl2) in the peat bogs
of SdEM confirm the values found by Campos et al. (2010) and Horák et al. (2011), ranging between 2.6 and 4.4 and also coincide with the results of Silva et al. (2009).
Peatlands are classified by the Brazilian System of Soil Classification (2006) as Haplic Histosols, and can be fibric (initial stage), hemic (intermediate stage) or sapric (advanced stage of OM decomposition), according to the OM - decomposition scale of von Post (Table 2). Out of the 77 samples, 51 % were classified as sapric (Embrapa, 2006). An intermediate stage of decomposition (hemic) was observed in 42 % of the samples. The presence of fibric OM (in early stages of decomposition) was observed in only 7 % of the samples. The highest OM and OC contents are related to lower MM contents and OMD is higher in predominantly hemic materials compared to the sapric soils (Table 1). These results corroborate studies conducted by Silva et al. (2009), Campos et al. (2010) and Horák et al. (2011).
The gravimetric moisture (GM) of most samples was greater than 100 % and in many of them, values
exceed 200 %, as also reported by Campos et al. (2011) and cited by Kiehl (2002), IPCC (2001) and Sire (2010). The soil bulk density (SBD) and minimum residue (MR) decreased with the organic matter (OM) content and decomposition stage, corroborating observations of Conceição et al. (1999).
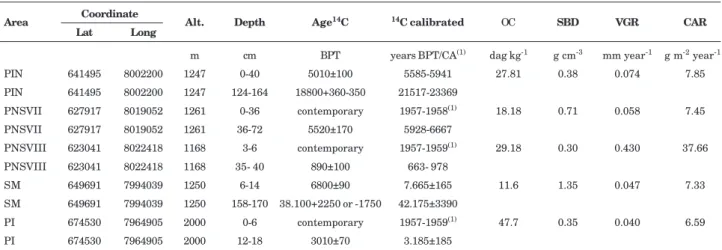
Radiocarbon age, VGR and OM accumulation
The VGR in the different studied peatlands
(Table 2) was 0.074 mm year-1 in Pinheiro, (depth
30-144 cm), 0.43 mm year-1 in Sempre-Vivas II
(depth 4.5-37.5 cm) and 0.058 mm year-1 in
Sempre-Vivas III (depth 18-54 cm). In the peatland of São Miguel, the VGR was 0.047 (depth 10-164 cm) and
0.040 mm year-1 in Pico do Itambé (depth 3-15 cm).
The annual growth rates (Table 2) are similar to those found in SdEM peatlands covered by field vegetation (Campos et al., 2010; Silva et al., 2013a,b), and lower than rates found in peatlands in Finland, Canada and Spain (Tolonen, 1979; Gorham, 1991; Pontevedra-Pombal, 2002), and in SdEM peatlands covered by semi-deciduous seasonal forest (Silva et al., 2013a,b). These differences are related to the vegetation types that cover the bogs and, possibly, to climate causes. The carbon accumulation rate (CAR) in the
peatland of Pinheiro was 7.85 g m-2 year-1 (depth
30-144 cm); of Sempre-Vivas III, 37.66 g m-2 year-1 (depth
4.5-37.5 cm); Sempre-Vivas II 7.45 g m-2 year-1 (depth
18-54 cm); São Miguel 7.33 g m-2 year-1 (depth 10-164
cm ) and of Pico do Itambé 6.59 g m-2 year-1 (depth
3-15 cm) (Table 2).
The CARs (Table 2) of the SdEM peatlands in semi-deciduous seasonal forest (greater OM input to the soil) and in peatlands of temperate and boreal regions (Pontevedra-Pombal, 2002; Armentano & Menges, 1986) were similar to rates found in the SdEM peatlands covered by field vegetation (Campos et al., 2010; Silva et al., 2013a,b) and lower than those observed by Silva et al. (2013a,b).
Both VGR and CAR were significantly higher in Sempre-Vivas III (Table 2) than in the other peatlands of SdEM, possibly due to the proximity of the samples to the surface (3-6 and 35-40 cm), where OM is less decomposed, to the radiocarbon age and to the floristic composition of the site.
Area, volume and OM stocks of mapped peatlands
From the field and delimitation data of peatlands with satellite imagery and aerial photographs and the
option calculate geometry of ArcGIS 9.3 software, the
area and volume of six mapped peatlands were calculated (Silva, 2012). From the organic matter amount and soil bulk density, the total pool of OM and the average pool of OM were estimated for each mapped peatland (Table 3).
OM between 85 and 853 t ha-1 in 12 homogeneous sections of peatlands of the same region. This difference was attributed to variations in SBD and OM content in the sections. The OM in all mapped peatlands in this study is within the range found by the authors and the differences were attributed to SBD and OM contents (Table 3).
Pyrophosphate color
UF RF
von pH
SBD OMD OM MM GM MR OC
Hue Value Chrome Post (CaCl2)
% gm-3 g kg-1 % m m-1 %
Sopa
Average 10YR 3 3 36.60 17.80 sapric 3.36 0.48 0.13 45.68 61.82 252.34 0.24 26.50
SD 1.57 1.87 21.52 11.99 0.47 0.35 0.05 17.02 22.01 140.81 0.24 9.87
São João da Chapada I
Average 10YR 3 2 55.40 15.75 sapric 3.76 0.39 0.18 57.00 50.29 241.18 0.14 33.06
SD 1.01 0.91 16.40 10.66 0.29 0.15 0.05 15.51 16.92 113.00 0.10 9.00
São João da Chapada II
Average 10YR 4 3 49.80 26.70 hemic 3.62 0.81 0.10 29.89 86.24 93.22 0.48 17.34
SD 1.37 0.70 5.01 12.41 0.26 0.22 0.05 14.10 8.96 35.42 0.17 8.18
Pinheiro
Average 10YR 3 2 63.29 18.24 sapric 3.17 0.38 0.15 47.95 46.77 385.74 0.15 27.81
SD 1.17 1.47 17.47 15.72 0.73 0.32 0.12 15.85 23.72 277.48 0.20 9.19
Sempre-Vivas II
Average 10YR 4 4 68.00 22.83 hemic 2.99 0.71 0.10 31.34 83.82 97.40 0.40 18.18
SD 1.72 0.84 8.85 10.67 0.25 0.23 0.08 15.85 13.81 34.08 0.18 9.19
Sempre-Vivas III
Average 10YR 3 3 74.50 13.60 sapric 3.35 0.30 0.14 50.31 43.50 315.44 0.10 29.18
SD 0.88 1.52 7.31 5.52 0.35 0.14 0.03 8.72 19.11 145.98 0.09 5.06
Table 1. Average morphological, physical and chemical properties of six peatlands in the SdEM
SD: Standard Deviation; UF: Unrubbed Fiber; RF: Rubbed Fiber; von Post: von Post decomposition scale; SBD: Soil Bulk Density; OMD: Organic Matter Density; OM: Organic Matter; MM: Mineral Material; GM: Gravimetric Moisture; MR: Minimal Residue; OC: Organic Carbon.
Area Coordinate Alt. Depth Age14C 14C calibrated OC SBD VGR CAR Lat Long
m cm BPT years BPT/CA(1) dag kg-1 g cm-3 mm year-1 g m-2 year-1
PIN 641495 8002200 1247 0-40 5010±100 5585-5941 27.81 0.38 0.074 7.85
PIN 641495 8002200 1247 124-164 18800+360-350 21517-23369
PNSVII 627917 8019052 1261 0-36 contemporary 1957-1958(1) 18.18 0.71 0.058 7.45
PNSVII 627917 8019052 1261 36-72 5520±170 5928-6667
PNSVIII 623041 8022418 1168 3-6 contemporary 1957-1959(1) 29.18 0.30 0.430 37.66
PNSVIII 623041 8022418 1168 35- 40 890±100 663- 978
SM 649691 7994039 1250 6-14 6800±90 7.665±165 11.6 1.35 0.047 7.33
SM 649691 7994039 1250 158-170 38.100+2250 or -1750 42.175±3390
PI 674530 7964905 2000 0-6 contemporary 1957-1959(1) 47.7 0.35 0.040 6.59
PI 674530 7964905 2000 12-18 3010±70 3.185±185
Table 2. Rates of vertical growth and carbon accumulation of peatland profiles of the SdEM
(1)CA: Calendar Age; Coordinates: UTM (Zone 23 K), PIN: Pinheiro District Peatland; PNSVIII: Peatland III of the National Park
of Sempre-Vivas; PNSVII: Peatland II of the National Park of Sempre-Vivas, SM: Fazenda São Miguel Peatland (Biribiri State Park), PI: Pico do Itambé Peatland; BPT: Before Present Time; C: Organic Carbon; SBD: Soil Bulk Density; VGR: Vertical Growth Rate; CAR: Carbon Accumulation Rate.
Area, volume of water and organic matter stocks in the SdEM peatlands
The northern part of SdEM covers an area of 1,180,109.00 ha, of which 14,287.55 ha are peatlands, representing 1.2 % of the total area (Figure 1). These
6,120,167 t of OM, corresponding to 428.36 t ha-1 (Table 4). In this study, the smallest peatland area identified was 0.09 ha due to the limitations of the spatial resolution of the Landsat imaging (30 m) (Silva,
2012). Thus, each “pixel” (picture element - measured
in points per inch or dpi) of the image corresponds to
an area of 900 m2 (0.09 ha). Peatlands smaller than
0.09 ha were not taken into consideration in this SdEM mapping.
The average organic matter (APOM) stock
(428.36 t ha-1) estimated for the entire SdEM was
similar to that found by Campos et al. (2012). The
authors quantified an AOM of 552 t ha-1 in a peatland
in the same region.
The resolution of the Landsat imaging does not allow the mapping of peatlands smaller than 0.09 ha; therefore, the results of this study may be underestimated and the total OM in the mapped peatland area in the SdEM (14287.55 ha) could exceed 6.12 million tons (Table 4). Gorham (1991) estimated
that, in global terms, peatlands have 1,863 t ha-1 OM.
However, the author considered an average depth of 2 m, while in this work, the average depth was 1.19 m. Moreover, SdEM peatlands have a high mineral material content (Table 1), while in peatlands of temperate and boreal climate, where Gorham (1991) based his work, the mineral material contents are much lower.
SdEM peatlands store 142,138,262 m3 of water,
corresponding to 9,948 m3 ha-1 (Table 4). This amount
would be enough to supply São Paulo City
(consumption of 5.65 m3 capita-1 month-1) in 2009
(11,037,693 inhabitants) for two months and 10 days (OSP, 2012). Campos et al. (2012) found similar values
in the SdEM peatlands that store between 1,039 and
10,833 m3 ha-1. The OM values may also be
underestimated.
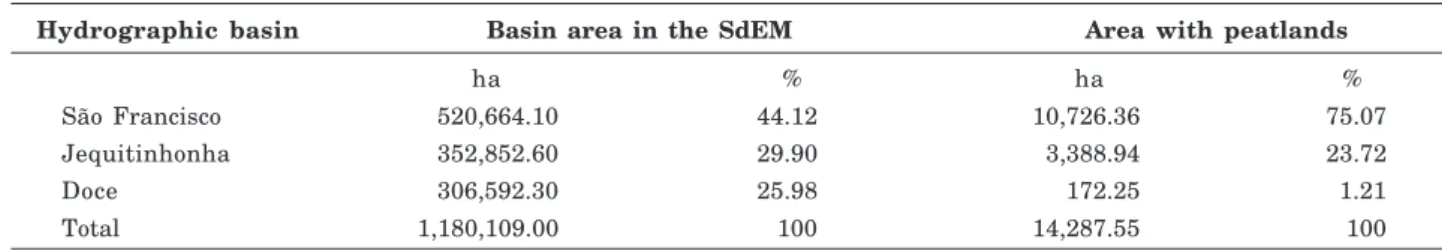
The headwaters of the major rivers or tributaries of three of the main hydrographic basins of eastern Brazil are in the SdEM. Peatlands are found in the basins of the São Francisco River (44 % of the study site and 75 % of the mapped area), the Jequitinhonha River (30 % of the study site and 24 % of the mapped area) and the Rio Doce (26 % of the study area and 1 % of the mapped area) (Figure 1 and Table 5).
Five of the nine major rivers of the SdEM have peat bogs in the headwaters (Figure 1) and the words “brown” and “black” appear in the names of three, referring to the dark color of their waters due to the organic acids from peatlands (Lévesque & Dínel, 1982; Gorham, 1991; Maltby & Dugan, 1994). The Jequitinhonha River and its main tributary, the Araçuaí River, which are the main or only water source for more than 1 million inhabitants of a significant area in the semi-arid region of Minas Gerais State, have their headwaters in the SdEM and the peat bogs greatly influence their flow.
The accumulation of organic matter by anaerobic conditions caused by excess water accentuates your “sponge effect”, in other words, its ability to retain more and more water (Rycroft et al., 1975a,b; Ingram, 1983; Stevenson, 1994; Brandyk et al., 2003; Pontevedra-Pombal & Martínez Cortizas, 2004; Campos et al., 2012).
The accumulation of organic matter under anaerobic conditions caused by excess water accentuates its “sponge effect”, ie, the ability to retain large quantities of water.
Peatland area AD Volume ASD OM TPOM APOM AWV AWVA TWV
ha cm m3 g cm-3 dag kg-1 t t ha-1 % m3 m3 ha-1
14,287.55 119 170,021,845 0.47 46.7 6,120,167 428.36 83.6 142,138,262 9,948 Table 4. Area, volume of stored water and organic matter stocks of peatlands in SdEM
AD.: Average Depth, ASD: Average Soil Density, AOM: Average Organic Matter; TPOM: total pool of organic matter; APOM: average pool of organic matter; AWV: Average Water Volume in the SdEM peatlands (Campos et al., 2012); AWVA: Average Water Volume per Area; TWV: Total Water Volume in the SdEM peatlands.
Peatland AA Area AD Total volume ASD AOM TPOM APOM
m ha cm m3 g cm-3 dag kg-1 t t ha-1
Sopa 1,434 21.52 0.98 210,896 0.48 46 7,638.80 354.87
São João da Chapada I 1,323 64.7 1.34 866,980 0.39 57 31,607.66 488.53
São João da Chapada II 1,276 138.84 1.04 1,443,936 0.81 30 57,543.54 414.46
Pinheiro 1,244 52.91 1.18 624,338 0.38 48 18,676.20 352.98
Sempre-Vivas II 1,170 47.52 0.82 389,638 0.71 31 14,064.53 295.97
Sempre-Vivas III 1,277 142.26 1.34 1,906,225 0.30 50 46,893.14 329.17
AA: Average Altitude, AD: Average Depth; ASD: Average Soil Density, AOM: Average Organic Matter Content;TPOM: total pool of organic matter; APOM: average pool of organic matter.
CONCLUSIONS
1. In the northern SdEm peatlands, advanced and intermediate decomposition stages of organic matter predominate.
2. The vertical growth rate of the SdEM peatlands
ranges between 0.04 and 0.43 mm year-1 and the carbon
accumulation rate varies from 6.59 to 37.66 g m-2 year-1.
3. The peatlands in the northern SdEM store large amounts of organic carbon and water. The organic matter stocks were estimated at 6,120,167 t (428.36 t
ha-1) and the total volume of stored water at
142,138,262 m3 (9,948 m3 ha-1).
ACKNOWLEDGEMENTS
The authors wish to thank the Universidade Federal do Vale do Jequitinhonha e Mucuri (UFVJM), Research Foundation of the State of Minas Gerais (FAPEMIG) and the National Council for Scientific and Technological Development (CNPq) for the financial support and the Brazilian Federal Agency for Support and Evaluation of Graduate Education (CAPES) for the scholarship.
LITERATURE CITED
ALMEIDA ABREU, P.A. & RENGER, F.E. Serra do Espinhaço Meridional: Um orógeno de colisão do Mesoproterozóico. R. Bras. Geoci., 32:1-14, 2002.
ANDRIESSE, J.P. Uso de solos orgânicos em condições tropicais e subtropicais aliado às possibilidades brasileiras. In: SIMPÓSIO NACIONAL DE SOLOS ORGÂNICOS, 1984, Curitiba. Anais... Curitiba, Provárzeas Nacional, Embrater, SEAG-Paraná e Acarpa/Emater - Paraná, 1984. p.11-34.
ARMENTANO, T.V. & MENGES, E.S. Patterns of change in the carbon balance of organic soil-wetlands of the temperature zone. J. Ecol., 74:755-774, 1986.
BRANDYK, T.; SZATYLOWICZ, J.; OLESZCZUK, R. & GNATOWSKI, T. Water-related physical attributes of organic soils. In: PARENT, L. & ILNICKI, P., eds. Organic soils and peat materials for sustainable agriculture. Boca Raton, CRC Press, 2003. p.35-70.
BRUNETTO, G.; MELO, G.W.; KAMINSKI, J.; FURLANETTO, V. & FIALHO, F.B. Avaliação do método de perda de peso por ignição na análise de matéria orgânica em solos da Serra Gaúcha do Rio Grande do Sul. Ci. Rural, 36:1936-1939, 2006.
CAMPOS, J.R.R.; SILVA, A.C.; VASCONCELLOS, L.L.; SILVA, D.V.; ROMÃO, R.V.; SILVA, E.B. & GRAZZIOTTI, P.H. Pedochronology and development of peat bog in the environmental protection area PaudeFruta -Diamantina, Brazil. R. Bras. Ci. Solo, 34:1965-1975, 2010. CAMPOS, J.C.; SILVA, A.C.; VIDAL-TORRADO, P. & FEREIRA, M.M. Water retention in a peatland containing organic matter in different decomposition stages, Brazil. R. Bras. Ci. Solo, 35:943-950, 2011.
CAMPOS, J.R.R.; SILVA, A.C. & VIDAL-TORRADO, P. Mapping, organic matter mass and water volume of a peatland in Serra of Espinhaço Meridional. R. Bras. Ci. Solo, 36:723-732, 2012.
CONCEIÇÃO, M.; FREIXO, A.A.; ARAÚJO, W.S.; CUNHA, T.J.F.; MARTIN NETO, L. & SAAB, S.C. Caracterização das substâncias húmicas em solos orgânicos do estado do Rio de Janeiro, sob diversas atividades agrícolas. Pesq. Andamento, 5:1-6, 1999.
EBELING, A. G.; ANJOS, L.H.C.; PÉREZ, D.V.; PEREIRA, M.G. & GOMES, F.W.F. Atributos químicos, carbono orgânico e substâncias húmicas em Organossolos Háplicos de várias regiões do Brasil. R. Bras. Ci. Solo, 35:325-336, 2011. EMPRESA BRASILEIRA DE PESQUISA AGROPECUÁRIA
-EMBRAPA. Centro Nacional de Pesquisa de Solos. Sistema brasileiro de classificação de solos. Brasília, Embrapa Produção de Informação; Rio de Janeiro, Embrapa Solos, 2006. 306p.
FAO - UNESCO. Soil Map of the World at scale 1:5.000.000. In: WORD CONGRESS OF SOIL SCIENCE, 14., Kyoto, 1990. Proceedings… Kyoto, International Soil Science Society, 1990.
GORHAM, E. Northern peatlands: role in the carbon cycle and probable responses to climatic warming. Ecol. Applic., 1:182-195, 1991.
HORÁK, I.; VIDAL TORRADO, P.; SILVA, A.C. & PESSENDA, L.C.R. Pedological and isotopic relations of a highland tropical peatland, Mountain Range of the Southern Espinhaço (Brazil). R. Bras. Ci. Solo, 35:41-52, 2011. INGRAM, H.A.P. Hydrology. In: GORE, A.J.P., ed. Ecosystems
of the World 4 A, mires, swamp, bog, fen and moor. Oxford, Elsevier, 1983. p.67-158.
Hydrographic basin Basin area in the SdEM Area with peatlands
ha % ha %
São Francisco 520,664.10 44.12 10,726.36 75.07
Jequitinhonha 352,852.60 29.90 3,388.94 23.72
Doce 306,592.30 25.98 172.25 1.21
Total 1,180,109.00 100 14,287.55 100
INTERGOVERNMENTAL PANEL ON CLIMATE CHANGE -IPCC. Irish Peatland Conservation Council: Action for bogs and wildlife, 2001. Available at: <http://www.ipcc.ie./ >. Accessed: Aug 20, 2012.
KIEHL, E.J. Manual da compostagem: Maturação e qualidade do composto. 3.ed. São Paulo, 2002. 171p.
KING, L.C. A geomorfologia do Brasil Oriental. R. Bras. Geogr., 2:3-121, 1956.
LÉVESQUE, M. & DÍNEL, H. Some morphological and chemical aspects of peats applied to the characterization of Histosols. Soil Sci., 133:324-332, 1982.
MALTBY, E.& DUGAN, P.J. Wetland ecosystem protection, management and restoration: An international perspective. London, St. Locie Press, 1994. 234p. MARTINELLI, L.A.; OMETTO, J.P.H.B.; FERRAZ, E.S.;
VICTORIA, R.L.; CAMARGO, P.B.C. & MOREIRA, Z. Desvendando questões ambientais com isótopos estáveis. São Paulo, Oficina de Textos, 2009. 144p.
MOREIRA, M.A. Fundamentos do sensoriamento remoto e metodologias de aplicação. 4.ed. Viçosa, MG, Universidade Federal de Viçosa, 2011. 422p.
OBSERVATÓRIO SÃO PAULO - OSP. Available at: <http:// www.nossasaopaulo.org.br/>. Accessed: Aug. 29, 2012. PEREIRA, M.G.; ANJOS, L.H.C. & VALLADARES, G.S.
Organossolos: Ocorrência, gênese, classificação, alterações pelo uso agrícola e manejo. In: VIDAL-TORRADO, P.; ALLEONI, L.R.F.; COOPER, M.; SILVA, A.P. & CARDOSO, E.J., eds. Tópicos em ciência do solo. Viçosa, MG, Sociedade Brasileira de Ciência do Solo, 2005. v. 4, p.233-276.
PESSENDA, L.C.R. & CAMARGO, P.B. Datações radiocarbônicas de amostras interesse arqueológico e geológico por espectrometria de cintilação líquida de baixa radiação de fundo. Quím. Nova, 14: 98-103, 1991. PONTEVEDRA-POMBAL, X. Turberas de Montaña de Galícia:
Génesis, propiedades y su aplicación como registros ambientales geoquímicos. Santiago de Compostela, Universidade de Santiago de Compostela, 2002. 489p. (Tese de Doutorado)
PONTEVEDRA-POMBAL, X. & MARTINEZ-CORTIZAS, A. Tuberas de Galicia: Processos formativos, distribuición y valor medioambiental. El caso particular de lãs “Serras Septentrionais”. Chioglossa, 2:103-121, 2004.
RYCROFT, D.W.; WILLIAMS, D.J.A. & INGRAM, H.A.P. The transmission of water through peat. I. Review. J. Ecol., 63:535-556, 1975a.
RYCROFT, D.W.; WILLIAMS, D.J.A. & INGRAM, H.A.P. The transmission of water through peat. II. Field experiments. J. Ecol., 63:557-568, 1975b.
RIELEY, J.O.; WUST, R.A.J.; JAUHIAINEN, J.; PAGE, S.E.; WOSTEN, H.; HOOIJER, A.; SIEGERT, F.; LIMIM, S.H.; VASANDER, H. & STAHLHUT, M. Tropical Peatlands: Carbon stores, carbon gas emissions and contribution to climate change processes. In: STRACK, M., ed. Peatlands and climate change. Calgary, Peat Society, 2008. p.44-70.
ROCHA, C.H.B. Geoprocessamento: tecnologia transdisciplinar. 3.ed. Juiz de Fora, Edição do Autor, 2007. 220p.
SAADI, A. & VALADÃO, R.C. Evolução geomorfológica quaternária da região de Gouveia, Serra do Espinhaço. In: SIMPOSIO DE GEOLOGIA DE MINAS GERAIS, 4., Belo Horizonte, 1987. Anais... Belo Horizonte, SBG/MG, 1987. p. 443-448. (Bol. SBG/MG, v.7)
SANTOS, R.D.; LEMOS, R.C.; SANTOS, H.G.; KER, J.C. & ANJOS, L.H.C. Manual de descrição e coleta de solo no campo. 5. ed. Viçosa, SBCS, 2005. 100p.
SILVA, A.C.; HORÁK, I.; MARTINEZ-CORTIZAS, A.; VIDAL-TORRADO, P.; RODRIGUES-RACEDO, J.; GRAZZIOTTI, P.H.; SILVA, E.B. & FEREIRA, C.A. Turfeiras da Serra do Espinhaço Meridional - MG. I - Caracterização e classificação. R. Bras. Ci. Solo, 33:1385-1398, 2009. SILVA, A.C.; PEDREIRA, L.C.V.S.F. & ALMEIDA ABREU,
P.A. Serra do Espinhaço Meridional: Paisagens e ambientes. Belo Horizonte, O Lutador, 2005. 272p. SILVA, M.L. Turfeiras da Serra do Espinhaço Meridional:
Mapeamento e estoque de matéria orgânica. Diamantina, Universidade Federal dos Vales do Jequitinhonha e Mucuri, 2012. 139p. (Dissertação de Mestrado)
SILVA, E.V.; SILVA, A.C.; PEREIRA, R.C.; CAMARGO, P.B.; SILVA, B.P.C.; BARRAL, U.M. & MENDONÇA FILHO, C.V. Composição lignocelulósica e isótopica da vegetação e da matéria orgânica do solo de uma turfeira tropical. I -Composição florística, fitomassa e acúmulo de carbono. R. Bras. Ci. Solo, 37:121-133, 2013a.
SILVA, A.C.; SILVA, E.V.; SILVA, B.P.C.; CAMARGO, P.B.; PEREIRA, R.C.; BARRAL, U.M.; BOTELHO, A.M.M. & VIDAL-TORRADO, P. Composição lignocelulósica e isótopica da vegetação e da matéria orgânica do solo de uma turfeira tropical. II - Substâncias húmicas e processos de humificação. R. Bras. Ci. Solo, 37:134-144, 2013b. SIRE, J. Composition and properties of raised bog peat humic
acids. Riga, University of Latvia, 2010. 105p. (Tese de Doutorado)
STANEK, W. & SILC, T. Comparisons of four methods for determination of degree of peat humification (decomposition) with emphasis on the von Post method. Can. J. Soil Sci., 57:109-117, 1977.
STEVENSON, F.J. Humus chemistry: Genesis, composition and reaction. 2.ed. New York, John Wiley & Sons, 1994. 496p. TAKESHI, I.; ALLISON, L.D.; STEVEN, C.W. & MOORCROFT,
P.R. High sensitivity of peat decomposition to climate change through water-table feedback. Nat. Geosci., 1:763-766, 2008.
TOLONEN, K. Peat as a renewable resource: long-term accumulation rates in North European mires. In: INTERNATIONAL SYMPOSIYUM CLASSIFICATION OF PEAT AND PEATLANDS, 1979, Hyytiala, Finlandia. Proceedings... Helsinki, International Peat Society, 1979. p.282-296.