Environmental and genetic effects on the lactation curves of four genetic
groups of crossbred Holstein-Zebu cows
Joana Ribeiro da Glória1, José Aurélio Garcia Bergmann2, Célia Raquel Quirino3, José Reinaldo Mendes Ruas4, Jonas Carlos Campos Pereira2, Ronaldo Braga Reis2,
Sandra Gesteira Coelho2, Martinho de Almeida e Silva2
1 Instituto de Ciências Agrárias, Universidade Federal de Minas Gerais, UFMG. 2 Escola de Veterinária, Universidade Federal de Minas Gerais, UFMG. 3 Universidade Estadual Norte Fluminense Darci Ribeiro, UENF. 4 Empresa de Pesquisa Agropecuária de Minas Gerais, EPAMIG.
ABSTRACT - The objective of this study was to evaluate the effects of genetic group and environmental factors, including farm of origin, season of calving and lactation number, on the individual lactation curves of 1,010 Holstein-Gyr, Guzerat-Holstein, Holstein-Nellore, and Holstein-Zebu F1 cows on the experimental farms of the Agricultural Research Company in Minas Gerais (Empresa de Pesquisa Agropecuária de Minas Gerais, EPAMIG). Least squares analysis and the incomplete gamma function were used to investigate differences in early milk yield, peak milk yield, time from onset to the lactation peak, persistency, total milk yield and lactation duration. The highest early yields were observed for Holstein-Gyr and Holstein-Zebu, and the lowest were observed for Holstein-Nellore cows. Early yield increased with lactation number, and the lactations that began in the late rainy and early dry seasons had the highest early yield. The time between lactation onset and the lactation peak was longer for primiparous Holstein-Gyr and Holstein-Guzerat cows. The lowest yields at the lactation peak were observed for the first lactation number. The highest values of persistency were observed for the first lactation number in Holstein-Guzerat cows. Total production from Holstein-Gyr and Holstein-Zebu cows were higher by approximately 14% and 29% compared with Holstein-Guzerat and Holstein-Nellore cows, respectively. The highest total yields were observed in lactations beginning in the dry season. Total yield increased with lactation number. The shortest lactation periods were observed in lactations beginning late in the rainy season. The incomplete gamma function was used to fit the individual curves from the genetic groups evaluated. The total yield differences were linked to early yields and yields at the peak of lactation.
Key Words: bovine, F1, incomplete gamma function
Introduction
In 2010, Brazil produced approximately 31.7 billion liters of cow milk, making it the fifth-largest producer worldwide. In 2000, the national production was 20.4 billion liters, representing 55% growth over 10 years (FAOSTAT, 2012). Thus, milk production is becoming increasingly significant for the national economy.
Despite the steady growth, dairy farming in Brazil does not have a standard of production. The systems are of extremely hight (Zocal, 2012); in particular, the genetic makeup and nutritional and health management of the herds vary. Most production is from dairy cows that are various crosses between European breeds and Zebu breeds. In 2005, 44% of the herds in the state of Minas Gerais, which is the largest producer, were made up of crossbred Holstein-Zebu cows (Gomes, 2006).
Lactation curves describe milk production over time and can be studied using mathematical models. The incomplete
gamma function is the most frequently cited method in the literature and is used to fit data for crossbred Holstein-Zebu cows (Glória et al., 2010). The function parameters are used to estimate lactation curve characteristics with economic significance, including early yield, peak yield, time from onset to lactation peak, persistency and total lactation yield. Knowing these characteristics and how they are influenced by genetic and environmental factors is useful for the selection process, choosing the most suitable genotype for each situation, establishing different nutritional strategies, planning feed purchases, and determining calving season suitability, among other activities that maximize productivity and/or profitability. In addition, the curves of animal lactation facilitate the prediction of the total yield from partial yield, which aids in early animal disposal and breeding evaluation when the lactation records of the progeny are incomplete.
The objective of this study was to model the individual curves of four genetic groups of crossbred
Holstein-ISSN 1806-9290
www.sbz.org.br R. Bras. Zootec., v.41, n.11, p.2309-2315, 2012
Zebu cows and to evaluate the influence of genetic and environmental factors on the estimated parameters and characteristics of the lactation curves.
Material and Methods
Individual curves were modeled using the records of milk production between February 1998 and February 2007 for Holstein-Gyr, Holstein-Guzerat, Holstein-Nellore and Holstein-Zebu F1 cows at two experimental farms of the Agricultural Research Company in Minas Gerais (Empresa de Pesquisa Agropecuária de Minas Gerais, EPAMIG). One farm was located in Felixlândia, which is in the state Minas Gerais, and the other was in Patos de Minas, located in the region of Alto Paranaíba, Brazil. The animals at both properties originated from other farms and were either purchased or bred in EPAMIG farms. The Zebu group refers to the animals with a Zebu genetic makeup, primarily from the Indubrasil and Gyr breeds, which were selected for milk production. The Nellore group refers to animals from this breed that were not selected for milk production. Because these are experimental herds, the animals were not selected based on qualities associated with the progression of lactations; as a result, the milk controls were not conducted based on this information.
Milk control was performed at regular intervals over 14 days. Incomplete lactations and lactations that persisted for fewer than 100 (n = 34) days or more than 400 days (n = 32) were not considered, which yielded 23,102 records for milk production from 1,340 lactations from the first through ninth lactations to model the individual curves. The length of lactation was defined as the number of lactating days in the last milk control.
In the summer, nutritional management was based on
Brachiaria decumbens and Brachiariabrizantha pastures, and in the winter, the cows were fed corn and sugarcane silage supplemented with urea. During milking, concentrated feed was provided according to individual milk production and lactation stage. Within 30 days before delivery, the animals were kept in calving paddocks with Brachiaria brizantha and Brachiaria decumbens pastures and received only mineral salt ad libitum during the summer. During the dry season, the cows received supplemental roughage with corn silage and 800 g of protein. Cows that produced more than 8 kg of milk per day were milked mechanically twice a day, and cows with lower yields were only milked once per day. During milking, calves were present to induce the milk let-down reflex, and after milking, the calves were released with the cows to suckle the residual milk. Habituation to milking conditions, which were identical for
both farms, began 30 days before the heifers were born. First, the heifers proceeded through the milking parlor in a single line, and then they stopped in the line so that the dairy farmer was able to reach them and clean their udders with water (Amaral et al., 2006).
Although the roughage used in both farms was similar, putative differences in the soils and climate (rainfall and temperature) and the unique methods for roughage preparation of each farm may have generated a disparity in feed quality between the farms. The management practices of the two farms were similar, and the milking conditioning procedures used on both farms are practices accepted in the industry. However, these practices were carried out by different employees, which may have led to putative differences between management practices and procedures of the farms.
Wood’s incomplete gamma function (1967) was used to fit the individual lactation curves, described as yt = atb exp(-ct).
In this description, yt is the daily yield on day t and ‘a’, ‘b’ and ‘c’ are constants. Parameter ‘a’ is the daily yield at the onset of lactation, ‘b’ is the slope of the ascending phase of milk production and ‘c’ is the slope of the descending phase (Wood, 1976). The parameters of each individual curve were estimated in accordance with the NLIN procedure of the statistical package Statistical Analysis System (version 6.12) through the Gauss-Newton iterative method. The initial parameter values were based on the values observed by Glória et al. (2010) with variable amplitudes.
Estimates for the early-yield lactation characteristics were then generated for each individual curve through
yt = a 1b exp(-c1); milk yield at the lactation peak through
ymax = a(b / c)b exp–b; time between lactation onset and
lactation peak through t = b / c; lactation persistency (persistency) through –(b + 1)1n(c); and total milk yield from lactation through
n
t t
y Y
1
, in which n is mean lactation length and yt is the yield on day t.
The coefficients of determination, which were adjusted (R2
A) to the number of function parameters (K), were
calculated to determine the fit of the data to the model (Silva, 2005) through R2
A =(1– RSS/(N – K))/(TSS/(N – 1)), in
which N is the number of observations, RSS is the residual sum of squares and TSS is the total sum of squares.
The environmental factors were as follows: farm of origin (Felixlândia versus Patos de Minas), season of calving (the beginning of the rainy season, from November to January; versus the end of the rainy season, from February to April; versus the onset of the dry season, from May to July; versus the end of the dry season, from August to October) and lactation number (classified as first, second, third, fourth or higher for all genetic groups).
The fixed effects of genetic group and environmental factors on lactation parameters and traits were evaluated using the least squares method and GLM procedure from the statistical package SAS (Statistical Analysis System, version 6.12).
Initially, complete models were tested with parameters ‘b’ and ‘c’ as well as lactation traits (early yield, peak yield, time between the lactation onset and peak of lactation, persistency, and estimated total yield and lactation duration) as dependent variables. The fixed independent variables were farm of origin, genetic group, season of calving, lactation number and their pairwise interactions. Parameter ‘a’ was not tested because it was closely correlated (0.99) with early yield. The primary objective for these models was to investigate any interactions between the genetic group and environmental effects. The final models included only the significant interactions (P<0.05) between environmental effects and genetic group. The adjusted means were compared using Tukey’s test with the assumption that 0.05 is significant.
Results and Discussion
Twenty-three percent of the individual curves were considered atypical, primarily because ‘b’ yielded negative
values, which reflects curves with no peak and a linear decrease in milk production beginning with the onset of lactation. This percentage of atypical curves was lower than that observed by Cobucci et al. (2000) and El Faro & Albuquerque (2002) when adjusting lactation curves for Guzerat (25.3%) and Caracu (40%) cows, respectively, using the incomplete gamma function.
Of the 1,010 curves considered normal, 99% had determination coefficients adjusted to the number of parameters that were above 0.90, which indicates that the incomplete gamma function adequately modeled the individual curves for Holstein-Gyr, Holstein-Guzerat, Holstein-Nellore and Holstein-Zebu F1 cows according to milk production records in 14-day intervals. Adjusting individual lactations for Caracu cows using the incomplete gamma function, El Faro & Albuquerque (2002) measured 6.79% lactations with determination coefficients above 0.90.
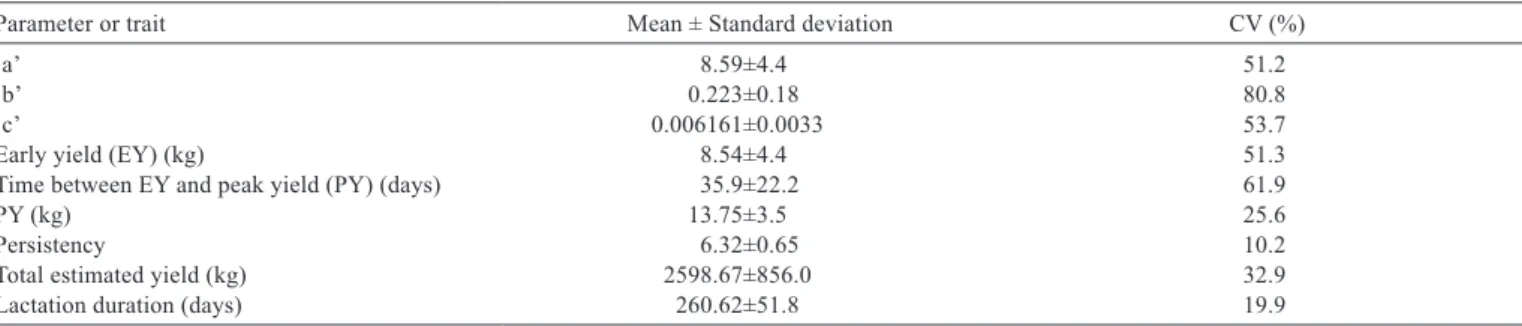
High values for coefficients of variation were observed for typical lactation curve parameters and features (Table 3). According to El Faro & Albuquerque (2002), highly variable coefficient values and extreme values for parameter estimates suggest a large variation in the shape of the lactation curve. These variations may result from the influence of different environmental and genetic factors. An analysis of variance established lactation number as the variable that contributed most to variation in lactation parameters and traits.
The highest early yields were observed for Gyr and Zebu animals, followed by Holstein-Guzerat and then the Holstein-Nellore group (Table 4). The Gyr breed is more commonly selected for milk production, and there has been a recent trend in the selection of the
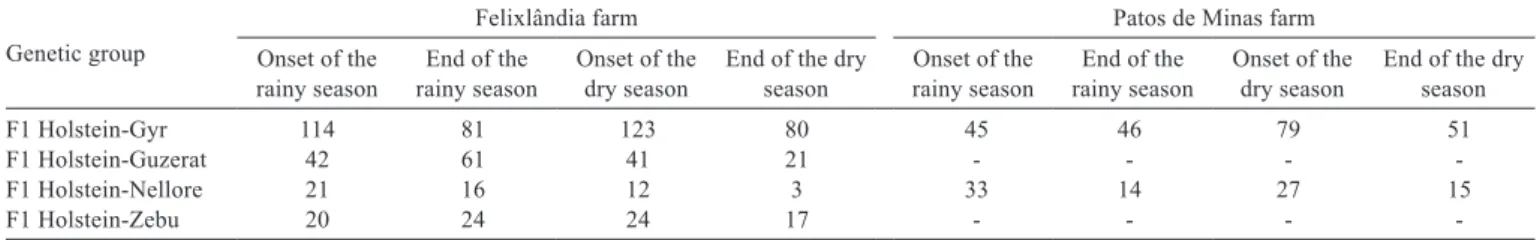
Table 1 - Number of lactations according to season of calving, genetic group and farm
Genetic group
Felixlândia farm Patos de Minas farm
Onset of the
rainy season rainy seasonEnd of the Onset of the dry season End of the dry season rainy seasonOnset of the rainy seasonEnd of the Onset of the dry season End of the dry season
F1 Holstein-Gyr 114 81 123 80 45 46 79 51
F1 Holstein-Guzerat 42 61 41 21 - - -
-F1 Holstein-Nellore 21 16 12 3 33 14 27 15
F1 Holstein-Zebu 20 24 24 17 - - -
-Table 2 - Number of lactations according to lactation number, genetic group and farm
Genetic group Felixlândia farm Patos de Minas farm
1 2 3 4 1 2 3 4
F1 Holstein-Gyr 109 112 76 101 38 42 37 104
F1 Holstein-Guzerat 38 44 34 49 - - -
-F1 Holstein-Nellore 13 11 12 16 20 20 20 29
-Guzerat breed for superior dairy performance, which may have generated the observed disparity in yield.
Cows that calved at the end of the rainy period and at the onset of the dry season had the highest early yields (Table 4). This result may be related to the superior condition score of animals that calved at the end of the rainy period because these cows had access to higher-quality pastures during the pre-birth period as well as roughage supplementation with corn silage and protein concentrate supplementation during the dry season, which coincided with the onset of lactation. Gonçalves et al. (1997) observed higher early yields for lactations in Gyr cattle that began during the rainy season, which were individually adjusted using the quadratic logarithmic function.
Early yield increased with lactation number, and all of the numbers were significantly different (P<0.05). Increases of 51, 13, and 16% were measured between the first and second, second and third, and third and fourth lactations, respectively (Table 4). This result may be related to the decrease in stress from milking management through the increased lactations. During the first lactation, the animal encounters unfamiliar situations, including the atmosphere of the milking parlor, the presence of the dairy farmer, and the milking procedure. These factors trigger physiological reactions that interfere with milk production and release. Madalena et al. (1979) studied the lactation curve for Holstein-Frisian cows and their offspring from Gyr crossbreds using the incomplete gamma function. This group also measured decreased values for parameter ‘a’, which is linked to early yield, for primiparous cows; however, in contrast with the study herein presented, the values of parameter ‘a’ were similar for the remaining lactation numbers.
Farm, season of calving, and lactation number affected parameter ‘b’, and farm and season of calving affected ‘c’. According to Cobby & Le Du (1978), a biological interpretation is difficult for these parameters. Nevertheless, such parameters are crucial for estimating lactation
features, including early yield, milk yield at lactation peak, time between the onset of lactation and lactation peak and persistency.
Farm, season of calving and the interaction between genetic group and lactation number affected the time between lactation onset and lactation peak. The number of days from lactation onset to peak yield was 29% higher on the Felixlândia farm and lower for lactations initiated at the end of the rainy season (Table 5). The farm effect may be related to both higher peak yield and the greater number of days until peak yield.
For the Holstein-Gyr and Holstein-Guzerat genetic groups, the longest time between lactation onset and
Table 3 - Means, standard deviations, coefficients of variation and minimum and maximum values for normal curve lactation parameters and traits
Parameter or trait Mean ± Standard deviation CV (%)
‘a’ 8.59±4.4 51.2
‘b’ 0.223±0.18 80.8
‘c’ 0.006161±0.0033 53.7
Early yield (EY) (kg) 8.54±4.4 51.3
Time between EY and peak yield (PY) (days) 35.9±22.2 61.9
PY (kg) 13.75±3.5 25.6
Persistency 6.32±0.65 10.2
Total estimated yield (kg) 2598.67±856.0 32.9
Lactation duration (days) 260.62±51.8 19.9
Table 4 - Means and standard errors of early yield according to genetic group, the season of calving and lactation number
Genetic group Mean ± Standard error
Holstein-Gyr 8.58±0.16a
Holstein-Guzerat 8.01±0.30ab
Holstein-Nellore 7.21±0.33b
Holstein-Zebu 9.07±0.42a
Season of calving
Onset of the rainy season 7.91±0.25cb
End of the rainy season 8.90±0.26a
Onset of the dry season 8.54±0.25ba
End of the dry season 7.51±0.31c
Lactation number
1 5.25±0.27d
2 7.94±0.26c
3 8.97±0.28b
4 or more 10.71±0.25a
Means followed by different letters differ according to Tukey’s test (P<0.05).
Table 5 - Means and standard errors for time between the onset of lactation and lactation peak in days according to season of calving
Season of calving Mean ± Standard error
Onset of the rainy season 33.57±1.46ab
End of the rainy season 29.60±1.51b
Onset of the dry season 36.37±1.42a
End of the dry season 37.11±1.71a
lactation peak was observed in primiparous cows. Values ranged from 29.0 to 40.6 days for Holstein-Gyr cows and 24.9 to 55.5 days for Dutch-Guzerat cattle (Table 6). As cited by Tekerli et al. (2000), Rao & Sundaresan (1979) reported that the milk-secretory tissue requires more time for peak activity in primiparous cows than in multiparous cows. No differences were observed for early yields in the remaining genetic groups for the various parity numbers. High standard errors may contribute to these similarities. El Faro & Albuquerque (2002) measured 21.8 days for normal curves in Caracu cows, and Madalena et al. (1979) measured 5-6 days for Holstein-Frisian and crossbred Gyr and Holstein-Friesian cows.
Milk yield at the lactation peak was affected by the farm as well as the interaction between genetic group and lactation number. The Felixlândia Farm had a milk yield at lactation peak 0.7 kg higher than the Patos de Minas Farm. This result is most likely related to differences in the condition of animals resulting from differences in roughage quality, since the animals in the present study had no pre-calving preparation. According to Baumann & Currie (1980), in the first month of lactation, body reserves may contribute with approximately 33% of milk production. For Holstein-Nellore and Holstein-Zebu crossbred cows, milk yield peak was lowest in the first lactation and similar in the remaining lactations. In the remaining genetic groups, the lowest values were also observed for the first lactation, followed by the second, third, fourth or higher numbers, and the last two lactations did not differ (Table 9). During the first lactations, primiparous cows are still developing and have reduced udder and digestive capacity and direct a portion of their nutrients to growth. For the first lactation, the highest
yield was observed in the crossbred Holstein-Gyr cows, and the lowest yield was observed the in Holstein-Guzerat and Holstein-Nellore cows (Table 7). The peak yields for primiparous cows were the lowest, perhaps because these cows were still growing and a portion of their nutrients was directed to growth. Investigating the factors that affect the shape of lactation curves for Holstein cows, Tekerli et al. (2000) observed reduced peak yields in primiparous cows. Junqueira et al. (1997) also observed increased milk yield at the lactation peak as the number of parities increased in Holstein cows.
Farm, season of calving and the interaction between genetic group and lactation number affected lactation persistency, which was defined by Wood (1967) as the period when the lactation peak is sustained. Management practices to improve animal behavior, primarily during milking, may promote dairy potential in the animal and prevent what is known as ‘milk hiding.’ Proper nutrition management is also required for high milk production during lactation. Reduced persistency was observed for lactations initiated at the end of the rainy season.
Increased persistency was observed for the first lactation in Holstein-Guzerat animals, whereas similar persistency values were observed for all lactations in the remaining genetic groups (Table 9). Persistency, as estimated using Wood’s incomplete gamma function (1967), is difficult to interpret because it lacks a biological unit of measure. An increased value indicates increased lactation persistency. Increased persistency values observed in the first lactations (Table 8) are typically related to longer service periods, which delay the negative effect of the fetus on milk yield. As cited by Capuco et al. (2003), Bachman et al. (1988) reported
Table 6 - Means and standard errors for the time between lactation onset and lactation peak, in days, according to genetic group and lactation number
Genetic group Lactation number
1 2 3 4 or higher
Holstein-Gyr 40.6±1.8Ba 36.7±1.7Aab 33.2±2Aab 29.0±1.5Ab
Holstein-Guzerat 55.5±3.5Aa 34.6±3.3Ab 30.3±3.7Ab 24.9±3.1Ab
Holstein-Nellore 41.1±3.7ABa 31.4±3.8Aa 29.4±3.7Aa 28.6±3.1Aa
Holstein-Zebu 40.1±4.3ABa 40.2±4.2Aa 29.9±4.4Aa 21.1±5.5Aa
Means followed by different lowercase letters in the same row and uppercase letters in the same column differ according to Tukey’s test (P<0.05).
Table 7 - Means and standard errors for milk yield at lactation peak, in kg, according to genetic group and lactation number
Genetic group Lactation number
1 2 3 4 or higher
Holstein-Gyr 10.6±0.2Ac 14.0±0.2Ab 15.3±0.2Aa 16.2±0.2Aa
Holstein-Guzerat 8.4±0.4Bc 12.6±0.4ABb 14.4±0.5ABab 15.8±0.4Aa
Holstein-Nellore 8.5±0.4Bb 11.7±0.5Ba 12.7±0.5Ba 13.4±0.4Ba
Holstein-Zebu 9.6±0.6ABb 14.4±0.5Aa 15.2±0.5Aa 17.2±0.7Aa
that the negative effect of pregnancy on milk production coincides with the onset of estrogen secretion by the fetal-placental unit, and estrogen mediates the inhibitory effects of pregnancy on lactation. Increased lactation persistency was also observed by Abubakar & Buvanendran (1981) in primiparous Frisian-Bunaji crossbred cows in Nigeria and by Cobuci et al. (2001) in Guzerat cows.
Farm, genetic group, season of calving, and lactation number affected the estimated total yield. The estimated total yield from the Felixlândia farm was 24% higher than that from the Patos de Minas farm. This difference likely resulted from management practices specific to each farm and putative differences in roughage quality. Higher total milk yields were estimated for the Holstein-Gyr and Holstein-Zebu groups; the yields were approximately 14% higher than that estimated for the Holstein-Guzerat group, which, in turn, was 14% higher than for the Holstein-Nellore cows. The lower total milk yield estimated for the latter group may have been caused by more active behavior and because milk is not typically a trait selected in the Nellore breed (Table 10).
Increased total yields were estimated for lactations initiated at the onset and end of the dry season (Table 10). Cows that began lactating at the onset of drought received dry roughage supplementation of corn silage and concentrate for two thirds of the lactation. Cows that calved at the end of drought received roughage supplementation during the first third of their lactation and grazed for the remaining two thirds. Decreased total yields for lactations initiated at the end of the rainy season may be linked to the reduced persistency observed over the same period.
In general, total yield increased with lactation number. The lowest and highest total yields were observed for the
first and fourth lactations, respectively (Table 10). The increase in total yield associated with parity is related to physiological development because the primiparous cows are growing and to milking conditioning. Animals at higher lactations are more conditioned to milking and have higher digestive, respiratory and udder capacities. Differences between genetic groups may be related to genetic differences between the animals depending on the whether the Zebu breed was selected for milk production and behavior.
Season of calving and interaction between genetic group and lactation number affected lactation length. The lactation period was shorter when it began at the end of the rainy season (Table 11). For lactations that began during this period, the last third of the lactation was during the transition period between the end of the rainy season and the onset of drought. Perhaps because they are at the end of lactation, little attention has been given to the nutritional management of such animals, which has led to their dying off.
Table 8 - Means and standard errors for lactation persistency according to the season of calving
Season of calving Mean ± Standard error
Onset of the rainy season 6.25±0.04a
End of the rainy season 6.11±0.04b
Onset of the dry season 6.32±0.04a
End of the dry season 6.36±0.05a
Means followed by different letters differ according to Tukey’s test (P<0.05).
Table 9 - Means and standard errors of lactation persistency according to genetic group and lactation number
Genetic group Lactation number
1 2 3 4 or higher
Holstein-Gyr 6.44±0.05Aa 6.35±0.05Aab 6.25±0.06Aab 6.13±0.04Ab
Holstein-Guzerat 6.81±0.10Aa 6.22±0.10Ab 6.18±0.11Ab 6.03±0.09Ab
Holstein-Nellore 6.39±0.11Aa 6.18±0.11Aa 6.05±0.11Aa 6.16±0.09Aa
Holstein-Zebu 6.54±0.13Aa 6.44±0.12Aa 6.14±0.13Aa 5.86±0.16Aa
Means followed by different lowercase letters in the same row and uppercase letters in the same column differ according to Tukey’s test (P<0.05).
Table 10 - Means and standard errors of the estimated total yield, in kg, according to genetic group, season of calving and lactation number
Genetic group Mean ± Standard error
Holstein-Gyr 2585.2±30.0a
Holstein-Guzerat 2318.9±61.4b
Holstein-Nellore 2035.4±60.1c
Holstein-Zebu 2678.3±80.4a
Season of calving
Onset of the rainy season 2348.6±48.5bc
End of the rainy season 2220.6±50.0c
Onset of drought 2573.4±47.0a
End of drought 2475.1±56.8ab
Lactation number
1 1844.9±52.5c
2 2424.8±50.1b
3 2580.2±53.8b
4 or higher 2767.8±45.5a
Means followed by different letters differ according to Tukey’s test (P<0.05).
Table 11 - Means and standard errors of lactation length, in days, according to the season of calving
Season of calving Mean ± Standard error
Onset of the rainy season 262.89±3.28a
End of the rainy season 249.71±3.45b
Onset of drought 261.54±3.26a
End of drought 267.80±3.99a
In the Holstein-Guzerat and Holstein-Zebu groups, the longest and shortest lactation lengths were observed for the first, fourth or higher lactations, respectively. In the first lactation, lactation length was longest for the Holstein-Zebu and Holstein-Guzerat groups (Table 12).
Conclusions
Wood’s incomplete gamma function (1967) properly fits the data to describe the individual curves for Gyr, Guzerat, Nellore, and Holstein-Zebu F1 cows. Differences between the total yields for the four genetic groups are related to increased early and peak yields, as the lactation persistency did not differ among the genetic groups.
Acknowledgments
The authors thank the Minas Gerais Research Foundation (Fundação de Amparo a Pesquisa do Estado de Minas Gerais, FAPEMIG) for funding the project (CVZ - 0084-07); the Agricultural Research Company of Minas Gerais (Empresa de Pesquisa Agropecuária de Minas Gerais, EPAMIG); the National Council for Scientific
and Technological Development (Conselho Nacional de
Desenvolvimento Científico e Tecnológico, CNPq) for awarding a scholarship during this research period; and the Office of the Vice Provost for Research at Universidade Federal de Minas Gerais (Pró-Reitoria de Pesquisa da Universidade Federal de Minas Gerais).
References
ABUBAKAR, B.Y.; BUVANENDRAN, V. Lactation curves of Friesian-Bunaji crosses in Nigeria. Livestock Production Science, v.8, p.11-19, 1981.
AMARAL, R.; RUAS, J.R.M.; MARCATTI NETO, A. et al. Sistema de produção de leite em pasto com vacas F1 HZ [Pasture-based system of milk production with F1 HZ cows]. Belo Horizonte: EPAMIG, 2006. 3p.
BACHMAN, K.C.; HAYEN, M.J.; MORSE, D. et al. Effect of pregnancy, milk yield, and somatic cell count on bovine milk fat hydrolysis. Journal of Dairy Science, v.71, p.925-931, 1988. BAUMAN, D.E.; CURRIE, W.B. Partitioning of nutrients during
pregnancy and lactation: a review of mechanisms involving
homeostasis and homeorhesis. Journal of Dairy Science, v.63, n.9, p.1514-1529, 1980.
CAPUCO, A.V.; ELLIS, S.E.; HALE, S.A. et al. Lactation persistency: Insights from mammary cell proliferation studies. Journal of Animal Science, v.81, p.18-31, 2003.
COBBY, J.M.; LE DU, Y.L.P. On fitting curves to lactation data. Animal Production, v.26, p.127-133, 1978.
COBUCI, J.A.; EUCLYDES, R.F.; TEODORO, L.R. et al. Aspectos genéticos e ambientais da curva de lactação de vacas da raça Guzerá. Revista Brasileira de Zootecnia, v.30, n.4, p.1204-1211, 2001.
COBUCI, J.A.; EUCLYDES, R.F.; VERNEQUE, R.S. et al. Curva de lactação na raça Guzerá. Revista Brasileira de Zootecnia, v.29, n.5, p.1332-1339, 2000.
EL FARO, L.; ALBUQUERQUE, L.G. Comparação de alguns modelos matemáticos para o ajuste às curvas de lactação individuais de vacas da raça Caracu. Arquivo Brasileiro de Medicina Veterinária e Zootecnia, v.54, n.3, p.295-302, 2002.
FOOD AND AGRICULTURE ORGANIZATION OF THE UNITED NATIONS. FAOSTAT. Available at: <http://faostat.fao.org/site/ 339/default.aspx>. Accessed on: Apr. 10, 2012.
GLÓRIA, J.R.; BERGMANN, J.A.G.; QUIRINO, C.R. et al. Curvas de lactação de quatro grupos genéticos de mestiças Holandês-Zebu. Revista Brasileira de Zootecnia, v.39, n.10, p.2160-2165, 2010.
GOMES, S.T. Diagnóstico da pecuária leiteira do Estado de Minas Gerais em 2005: relatório de pesquisa. Belo Horizonte: FAEMG, 2006. 156p.
GONÇALVES, T.M.; MARTINEZ, M.L.; MILAGRES, J.C. Curva de lactação na raça Gir. 2. Influência dos fatores de meio ambiente, estimativa da repetibilidade e herdabilidade para os parâmetros da curva de lactação quadrática logarítmica. Revista Brasileira de Zootecnia, v.26, n.1, p.88-97, 1997.
JUNQUEIRA, L.V.; NEIVA, R.S.; VEIGA, R.D. et al. Estudo das curvas de lactação de vacas Holandesas de alguns rebanhos do estado de Minas Gerais, por intermédio de uma função gama incompleta. Revista Brasileira de Zootecnia, v.26, n.6, p.1109-1118, 1997.
MADALENA, F.E.; MARTINEZ, M.L.; FREITAS, A.F. Lactation curves of Holstein-Friesian and Holstein-Friesian x Gir cows. Animal Production, v.29, p.101-107, 1979.
RAO, M.K.; SUNDARESAN, D. Influence of environmental and heredity on the shape of the lactation curves in Sahiwal cows. Journal Agricultural Science, v.92, p.393-401, 1979.
SILVA, M.A. Conceitos de análises de dados. Belo Horizonte: FEPMVZ, 2005. 179p.
TEKERLI, M.; AZINCI, Z.; DOGAN, I. et al. Factors affecting the shape of lactation curves of Holstein. Journal of Dairy Science, v.86, n.6, p.1381-1386, 2000.
WOOD, P.D.P. Algebraic model of the lactation curve in cattle. Nature, v.216, p.164-165, 1967.
WOOD, P.D.P. Algebraic models of the lactation curves for milk, fat, and protein production, with estimates of seasonal variations. Animal Production, v.22, p.35-40, 1976.
ZOCAL, R. O Brasil produziu 30 bilhões de litros em 2012. Panorama do leite, ano 6, n.62, 2012. Available at: <http://www.cileite.com.br/ content/o-brasil-produziu-30-bilh%C3%B5es-de-litros-em-2010.> Accessed on: Apr. 10, 2012.
Table 12 - Means and standard errors of lactation length, in days, according to genetic group and lactation number
Genetic group Lactation number
1 2 3 4 or higher
Holstein-Gyr 270.8±4.2Ba 265.7±4.0Aa 265.9±4.7Aa 254.9±3.5Aa
Holstein-Guzerat 286.1±8.1ABa 258.2±7.6Aba 255.9±8.6ABab 245.5±7.1Ab
Holstein-Nellore 239.0±8.7BCa 239.8±9.0Aa 228.6±8.8Ba 245.7±12.9Aa
Holstein-Zebu 317.8±10.9Aa 278.9±10.0Aab 269.4±10.2ABab 245.5±12.9Ab