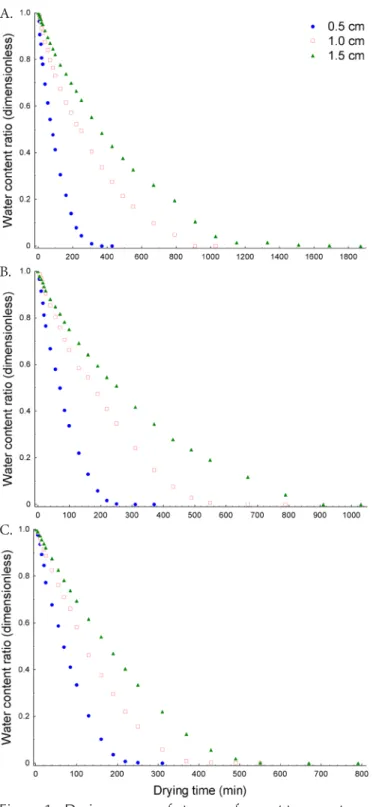
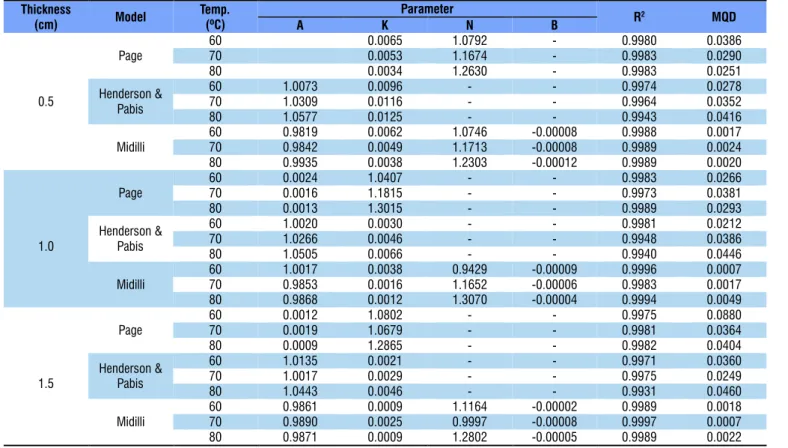
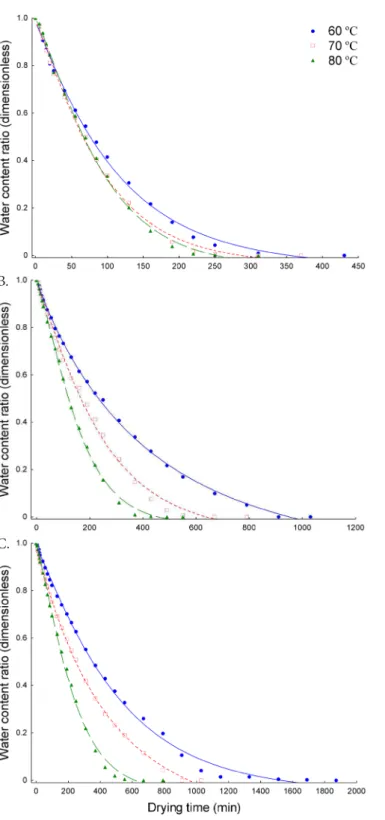
Drying kinetics of atemoya pulp
Texto
Imagem
Documentos relacionados
According to the return loss plot from figure 2.8, it is clear that the wider the gap between the dipole arms becomes, the better the antenna is matched to the 2.4 GHz. On the
As normas de direito fundamental, quando abstratamente consideradas, encontram-se em permanente estado de tensão, no qual a proteção normativa conferida a determinado bem ou
gondii induz o acúmulo de ferro nos órgãos que são acometidos durante a fase aguda da infecção, tais como o intestino delgado, pulmão e fígado em camundongos C57BL/6.. O
Pergunta (Mestre) Endereço do escravo Função MEI Type Código de leitura Número do Objeto CRC- CRC+ Resposta (Escravo) Endereço do escravo Função MEI Type Conformity Level More
[...] as organizações podem ser denominadas de instituições quando elas desenvolvem a capacidade de agir como agente de uma sociedade em âmbito maior na
The probability of attending school four our group of interest in this region increased by 6.5 percentage points after the expansion of the Bolsa Família program in 2007 and
Ao contrário, percebemos que as fronteiras coloniais estabelecidas entre aldeamentos distintos e povoados não-indígenas são flexíveis e suscetíveis a trocas intensas,
