FOAM
-
MAT DRYING KINETICS OF KEITT MANGO PULP
1MARY KARLLA ARAÚJO GUIMARÃES2*, ROSSANA MARIA FEITOSA DE FIGUEIRÊDO3, ALEXANDRE JOSÉ
DE MELO QUEIROZ3
ABSTRACT – This study aimed to assess the foam-mat drying kinetics of mango pulp (cv. Keitt) adding 1% Emustab® and 1% Super Liga Neutra®, for a whipping time of 20 minutes, dried in a forced-air convection oven at different temperatures (50, 60 and 70oC) and foam layer thicknesses (0.5, 1.0 and 1.5 cm). Drying
kinetic data were used to build drying curves and then fit to Page, Henderson, Henderson and Pabis, Logarithmic and two-term Exponential models. Both temperature and foam layer thickness influenced drying
time, which reached the shortest value at the highest temperature and smallest thickness. The Page model provided the best fit to the experimental drying curve data.
Keywords: Mangifera indica L.. Dehydration. Mathematical modeling.
CINÉTICA DE SECAGEM EM CAMADA DE ESPUMA DA POLPA DE MANGA CV. KEITT
RESUMO- Este trabalho foi realizado com o objetivo de avaliar a cinética de secagem em camada de espuma da polpa de manga cv. Keitt, com a incorporação de 1% de Emustab® e 1% de Super Liga Neutra®, para um tempo de batimento de 20 min, desidratada em estufa com circulação forçada de ar em diferentes temperaturas (50; 60 e 70 oC) e espessuras de camada de espuma (0,5; 1,0 e 1,5 cm). A partir dos dados obtidos durante a
cinética de secagem foram construídas as curvas de secagem e ajustados os modelos de Page, Henderson, Henderson e Pabis, Logarítmico e Exponencial de dois termos. Verificou-se que a temperatura de secagem e a espessura da camada de espuma influenciaram no tempo de secagem, com os menores tempos de secagem observados na maior temperatura e na menor espessura. O modelo de Page foi o que melhor se ajustou aos dados experimentais das curvas de secagem.
Palavras-chaves: Mangifera indica L.. Desidratação. Modelagem matemática.
________________ *Corresponding author
1Received for publication in 05/19/2014; accepted in 03/06/2016. Paper extracted from the doctoral thesis of the first author.
2Instituto Federal de Educação, Ciência e Tecnologia, Campina Grande, PB, Brazil; [email protected].
Rev. Caatinga, Mossoró, v. 30, n. 1, p. 172 – 180, jan. – mar., 2017 173
INTRODUCTION
Mangoes (Mangifera indica L.) are one of the most popular tropical fruits in the world, owning a great economic importance in national and international markets. The greatest customers are Latin America and Asian countries (LIMA, 2013).
Brazil produced about 1.2 million tons of mangoes in the 2014/2015 harvest (FAO, 2015). The Northeast is the largest producing region as it has the best suited weather for cultivating mangoes, with the São Francisco Valley standing out as a large producer. Mango output in 2014 in the Northeast region was 784,692 tons, of which nearly 50% was yielded in the state of Bahia. The average productivity in the Northeast was around 16 tons by hectare (IBGE, 2014).
Mango is a popular fruit, often consumed fresh; otherwise, techniques enabling exploitation of its entire nutritional potential have been pursued to develop new products. Rational use of this fruit represents economic growth for Brazil, as the country is a major world producer of mangoes (BEZERRA et al., 2011).
Among the mango varieties grown in Brazil, Keitt has great potential for internal and external markets. These fruits are oval, large (600-800 g), firm, juicy, sweet, with yellow-green rind, intense yellow pulp, little fiber, besides having a small pit (7 to 8.5% fruit weight) and late ripening (PINTO; MATOS; CUNHA, 2000).
The short-term harvest of mangoes should be incentive to industrialization, considering it would absorb surplus production for lower costs, besides enabling consumption of industrialized products when fresh fruit cannot be found (RAMOS et al., 2004).
Drying, besides being a preservation method that reduces commercial value deterioration and losses, also transform products, adding value and resulting in new market alternatives. Dehydrated products can be directly consumed or used as ingredients for baked goods, yogurts, ice creams, etc. (SOUZA NETO et al., 2005). This procedure extends shelf life of products as reduces water activity, decreasing transport and storage costs for being lighter and more compressed. Besides that, these products show are most microbiologically and chemically stable (FELLOWS, 2006).
Foam-mat drying is a simple and inexpensive process which uses foam-stability facilitators and keepers throughout the process. Some of its advantages are low processing temperatures, short dehydration period, because of larger contact area to
air, rapid water removal and attainment of an easily rehydratable porous product.
The objective of this study was to evaluate the foam-mat drying kinetics of cv. Keitt mango pulp with added Emustab® and Super Liga Neutra® at different temperatures (50, 60 and 70°C) and foam layer thicknesses (0.5, 1.0 and 1.5 cm).
MATERIAL AND METHODS
Ripe mangoes the Keitt variety, from the Vale do São Francisco and Petrolina, were used as raw materials, with Super Liga Neutra® and Emustab® additives purchased from the local market of Campina Grande, PB.
The fruits were harvested and transported to the laboratory inside wooden boxes. Next, they were hand selected, removing damaged, infected, and unripe or semi-ripe ones. Then, the selected mangoes were washed in tap water with a sponge and neutral detergent, sanitized with 50-ppm sodium hypochlorite solution for 10 minutes, thoroughly rinsed, and manually peeled with stainless steel knives. Afterwards, they were pulped with mechanical agitation for pulp removal. Finally, pulp was packed into 1-L low-density polyethylene bags and stored at -18°C for further use.
At room temperature, mango pulp was added with 1% Super Liga Neutra® and 1% Emustab®, homogenized by blender at maximum speed for 20 min to form a foam of 0.5170 g cm-3 density. Next, foam was spread onto stainless steel trays at varied layer thickness (0.5, 1.0 and 1.5 cm) and left to dry in a forced-air convection oven at different temperatures (50, 60 and 70oC). While drying,
kinetics was monitored by weighing the trays regularly until constant weight. Moisture ratio (Equation 1) and drying kinetics curves were then built/ calculated using these data.
(1) Where:
RX – Moisture ratio, non-dimensional; X - Moisture content, dry basis;
Xe - Moisture content equilibrium, dry basis;
X0- Initial moisture content, dry basis.
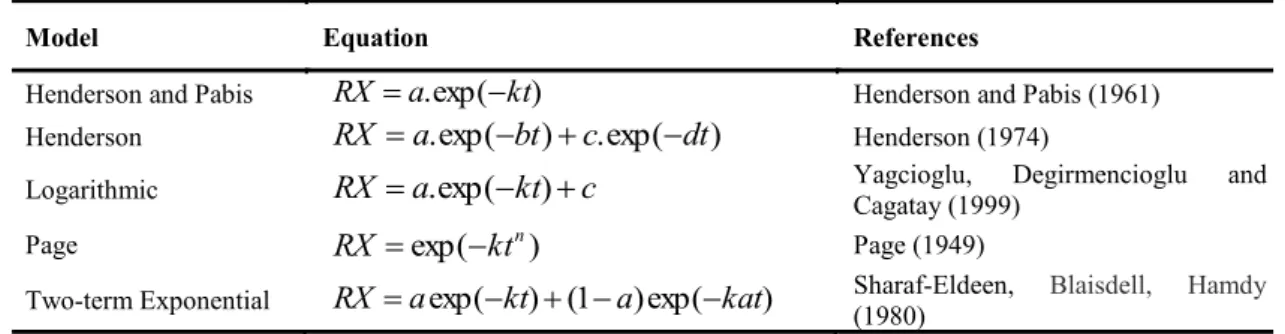
Table 1 shows the semi-theoretical models of Henderson and Pabis, Henderson, Logarithmic, Page and the two-term Exponential models, which were adjusted to the curves of drying kinetics using Statistica 5.0 software.
Coefficient of determination (R2) and the
root-mean-square deviation (RMSD) (Equation 2) were used as adjustment criteria for the mathematical models.
(2) Where:
RMSD - Root-mean-square deviation; RXpred – Moisture ratio predicted by the
model;
RXexp – Experimental moisture ratio;
n - Number of observations.
RESULTS AND DISCUSSION
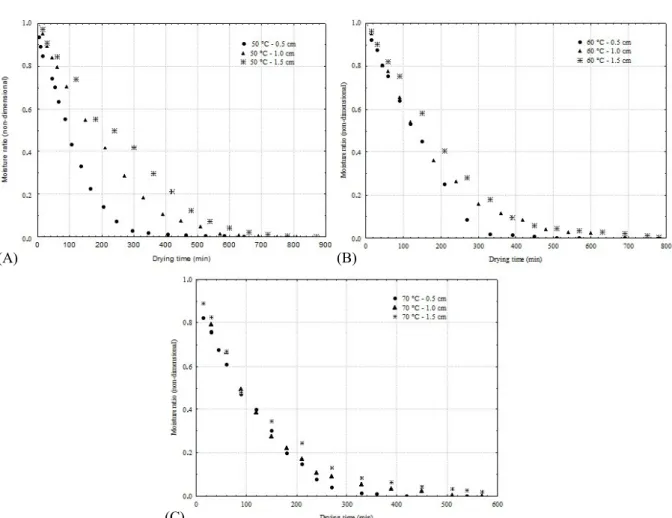
Figure 1 shows the foam-mat drying kinetics of mango pulp for each layer (0.5, 1.0 and 1.5 cm) and temperature (50, 60 and 70°C), showing the moisture ratio changes with time. The lowest times arose at 70°C, being of 9.00, 12.00 and 14.20 h for 0.5, 1.0 and 1.5 cm layers, respectively. At 60°C, they reached 11.50, 13.83 and 14.75 h for 0.5, 1.0 and 1.5 cm layers, respectively. While at 50°C, they resulted in the longest times of 13.00, 14.00 and 15.50 h for 0.5, 1.0 and 1.5 cm, respectively.
Both layer thicknesses and temperature influenced foam-drying time. Kadam et al. (2011) also noted this when studying the drying kinetics of tomato juice with egg albumin at 60, 65 and 70°C and 2.5 mm thickness layer.
The findings pointed the greater the thickness, the greater the drying time. It might be due to a greater water diffusion in thinner layers, speeding up the drying. The extended drying times in thicker layers may be result of resistance faced by moisture
in migrating from layer center to surface (SILVA et al., 2009). Kandasamy et al. (2014)
reported the effect of thickness layer (2, 4, 6, 8 and 10 mm ) on drying time of papaya pulp.
We found temperature influence on the drying curves, with a gradual time decline with rising
n
RX
RX
RMSD
pred 2 exp)
(
temperatures for all studied layers. Wilson et al. (2012) reported the same trend when studying foam-mat drying of Dussehri mango pulp; they noted a significant effect of air temperature on time spent for drying, which is clear since time is shortened as heating rise.
Through Figure 1, we can define that the time required to withdraw all water content drying at 50°C was nearly 1.44 times longer than the one at 70°C, for a 0.5-cm layer.
Table 2 displays the parameters of the models, dried at different temperature, for the layer of 0.5 cm. It also illustrates the coefficients of determination (R2) and root-mean-square deviations (RMSD) for
the drying formulation with 0.5 cm foam layer at the studied temperatures.
The findings explain that all models can be used to represent the drying process for foam layer of 0.5 cm at the temperatures mentioned, once they have coefficients of determination (R2) higher than 0.99
and root-mean-square deviations below 0.005. Babalis et al. (2006), studying the drying of figs within a temperature range between 55 and 85 °C, found R2 value above 0.990 for all temperatures by
means of Henderson and Pabis model. Similarly, after adjusting the Henderson and Pabis model to drying kinetics data from Barbary fig pulp at 60 to 70°C, Madureira et al. (2011) found R2 values above
0.990. Interestingly, among the tested models, Page and two-term Exponential provided best fits at 50-60°C and at 70°C, respectively, reaching the highest R2 values and the least root-mean-square
deviations. Similarly, Sousa et al. (2011) stressed the Page model by reaching R2 higher than 0.99 and
root-mean-square deviations below 0.01, evaluating the drying kinetics of oiti pulp at 50, 60 and 70°C.
The parameter k (min-1) of Henderson and Pabis, Logarithmic, and Page models increased with temperature. According to Correa et al. (2010), such benchmark has an increasing trend, since the higher the temperatures, the greater the drying rates, thus reaching an equilibrium moisture content within a shorter time. Kaya, Aydin and Demirtas (2007) achieved the same conclusion researching the drying kinetics of apples at 35, 45 and 55°C.
Table 1. Mathematical models applied to the drying kinetics data.
RX – moisture; a, b, c, d and n - parameters of the equations; t - time (min); K - constant of the equation (min-1).
Model Equation References
Henderson and Pabis RX a.exp(kt) Henderson and Pabis (1961)
Henderson
RX
a
.
exp(
bt
)
c
.
exp(
dt
)
Henderson (1974)Logarithmic
RX
a
.
exp(
kt
)
c
Yagcioglu, Degirmencioglu and Cagatay (1999)Page
RX
exp(
kt
n)
Page (1949)Two-term Exponential RX aexp(kt)(1a)exp(kat) Sharaf-Eldeen, Blaisdell, Hamdy
Rev. Caatinga, Mossoró, v. 30, n. 1, p. 172 – 180, jan. – mar., 2017 175
(B)
(C)
Figure 1. Drying kinetics curves of the formulation at 50 (A), 60 (B) and 70°C (C) for different foam layer widths.
Table 2. Parameters, coefficients of determination (R2)and root-mean-square deviations (RMSD) of the models adjusted
for drying curves, with foam layer thickness of 0.5 cm, at different temperatures.
(A)
Model Temperature (°C) Parameter R² RMSD
A k
Henderson and Pabis
50 1.0070 0.0018 0.9948 0.0014
60 1.0067 0.0057 0.9989 0.0010
70 0.9807 0.0083 0.9979 0.0005
Temperature (°C) A c k R² RMSD
Logarithmic
50 1.0319 - 0.0312 0.0077 0.9967 0.0011 60 1.0713 - 0.0169 0.0188 0.9981 0.0002 70 0.9671 0.0205 0.0214 0.9982 0.0004
Temperature (°C) a b c d R² RMSD
Henderson
50 0.503 0.008 0.503 0.008 0.9947 0.0014 60 0.529 0.025 0.529 0.025 0.9964 0.0010 70 0.343 0.039 0.666 0.013 0.9992 0.0009
Temperature (°C) K n R² RMSD
Page
50 0.0029 1.2118 0.9973 0.0007
60 0.0077 1.3031 0.9996 0.0001
70 0.0268 0.9014 0.9988 0.0002
Temperature (°C) A k R² RMSD
Two-term Exponential
50 0.3599 0.0221 0.9947 0.0049
60 0.0021 0.0113 0.9944 0.0016
An increased drying resistance could be noted base on the n constant of the Page model for 60°C. For Corrêa et al. (2007), this constant of the Page model reflects internal resistance of product against drying.
The drying coefficient a of the Logarithmic model at 70°C shows a lower resistance to the drying process. The k constant of this model depends on temperature, noting that it increased with increases in drying temperatures. Evaluating the foam-mat drying
kinetics of Dussehri mango pulp, Wilson et al. (2012) observed increasing values of parameter k of the Logarithmic model by rising temperature from 65°C to 75°C, as remarked in this study.
Figure 2 shows the fit of the drying kinetics curves of mango pulp, dried at different temperatures (50, 60 and 70°C) and 0.5-cm foam layer, to the Page model. It was considered one of the best among the applied models.
Figure 2. Mango pulp drying kinetics with additives and foam layer thickness of 0.5 cm at different temperatures, adjusted by the Page model.
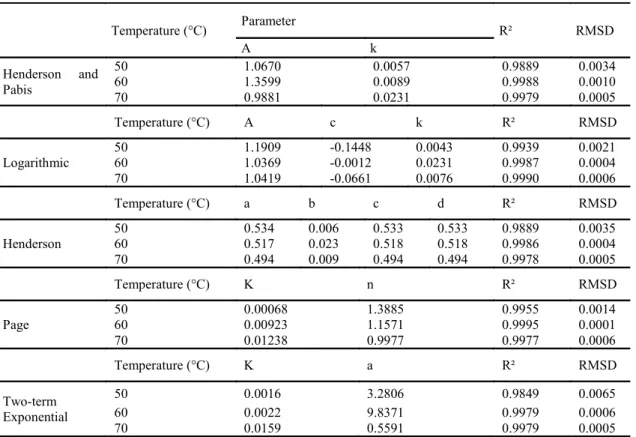
Table 3 shows the parameters of the models adjusted to the drying curves of mango pulp at different temperatures, for the layer of 1.0 cm. The results present coefficients of determination (R2)
higher than 0.98 and root-mean-square deviations under 0.007, which enables using all tested models accurately.
Table 3. Parameters, coefficients of determination (R2)and root-mean-square deviations (RMSD) of the models adjusted
for drying curves, with foam layer thickness of 1.0 cm, at different temperatures.
Temperature (°C) Parameter R² RMSD
A k
Henderson and Pabis
50 1.0670 0.0057 0.9889 0.0034
60 1.3599 0.0089 0.9988 0.0010
70 0.9881 0.0231 0.9979 0.0005
Temperature (°C) A c k R² RMSD
Logarithmic
50 1.1909 -0.1448 0.0043 0.9939 0.0021 60 1.0369 -0.0012 0.0231 0.9987 0.0004 70 1.0419 -0.0661 0.0076 0.9990 0.0006
Temperature (°C) a b c d R² RMSD
Henderson
50 0.534 0.006 0.533 0.533 0.9889 0.0035 60 0.517 0.023 0.518 0.518 0.9986 0.0004 70 0.494 0.009 0.494 0.494 0.9978 0.0005
Temperature (°C) K n R² RMSD
Page
50 0.00068 1.3885 0.9955 0.0014
60 0.00923 1.1571 0.9995 0.0001
70 0.01238 0.9977 0.9977 0.0006
Temperature (°C) K a R² RMSD
Two-term Exponential
50 0.0016 3.2806 0.9849 0.0065
60 0.0022 9.8371 0.9979 0.0006
Rev. Caatinga, Mossoró, v. 30, n. 1, p. 172 – 180, jan. – mar., 2017 177
Page model had the best fit to the experimental data at both 50 to 60oC, yet the
Logarithmic model at 70oC (R2 > 0.99) with the
lowest root-mean-square deviations. Alexandre et al. (2009) studied the drying kinetics of the Pernambuco pineapple at temperatures of 50, 60, 70 and 80°C, obtaining R2 > 0.99 and RMSD <0.001 using the
Page model.
Furthermore, the n parameter of Page model was inversely proportional to temperature. Equally, Madureira et al. (2011) found similar results by adjusting the Page model to the drying kinetics curves of Barbary fig pulp at 50, 60 and 70°C. The k parameter of the Page model and the two-term
Exponential model increased with the increase of temperature. Also, Melo et al. (2013) meet the same conclusion by adjusting this model to experimental data from foam-mat drying kinetics of Mandacaru fruit pulp at 70, 80 and 90°C.
Constant k of the Logarithmic model did not show the standard behavior with increasing temperatures.
Figure 3 shows the drying kinetic curves of mango with additives, dehydrating 1.0-cm foam layer at different temperatures. When adjusted by the Page model, the curves presented the highest R2 and
the lowest RMSD.
Figure 3. Mango pulp drying kinetics with additives and foam layer thickness of 1.0 cm at different temperatures, adjusted by the Page model.
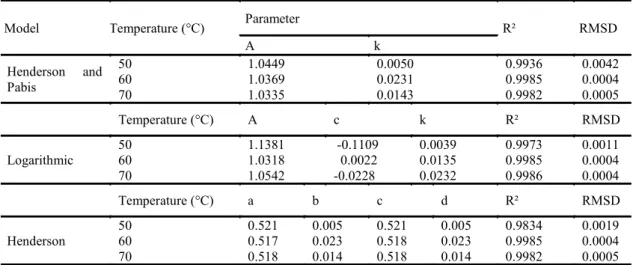
Table 4 presents the parameters of the models adjusted to the drying curves at different temperatures, for the layer of 1.5 cm. The results demonstrate coefficients of determination (R2) higher
than 0.98 and root-mean-square deviations under 0.005, which enables all tested models.
Again, the Page model had the best fit among all the tested models, with the highest coefficients of
determination (R2 > 0.99), and the lowest
root-mean-square deviations (RMSD < 0.0005). As well, Doymaz (2012) found R2 > 0.99 and RMSD <
0.00014 using the Page model to assess the drying kinetics of a thin layer of sliced persimmon at 50, 60 and 70°C.
Table 4. Parameters, coefficients of determination (R2)and root-mean-square deviations (RMSD) of the models adjusted
for drying curves, with foam layer thickness of 1.5 cm, at different temperatures.
Model Temperature (°C) Parameter R² RMSD
A k
Henderson and Pabis
50 1.0449 0.0050 0.9936 0.0042
60 1.0369 0.0231 0.9985 0.0004
70 1.0335 0.0143 0.9982 0.0005
Temperature (°C) A c k R² RMSD
Logarithmic
50 1.1381 -0.1109 0.0039 0.9973 0.0011 60 1.0318 0.0022 0.0135 0.9985 0.0004 70 1.0542 -0.0228 0.0232 0.9986 0.0004
Temperature (°C) a b c d R² RMSD
Henderson
Table 4. Continuation.
Notably, the parameter k increased with temperature for the Logarithmic and the Page models. This parameter outlines drying rate alterations throughout temperature change; thus, the highest drying rates were reached at raised temperatures, striking moisture balance within a lesser time. Other authors drew the same conclusion. One example is Doymaz and Ismail (2011) who studied the drying kinetics of sweet cherries at 60, 70 and 75°C; another is Silva et al. (2008) who assessed tamarind pulp added to 5% albumin at 50, 60, 70 and 80°C. In the same vein, the Henderson and Pabis model had an indirect proportion between k and temperatures; also, Silva et al. (2014), while using
such model to describe the drying of a thin layer of banana at 40, 50 and 70°C, had also reported it.
Figure 4 shows the drying kinetics of 1.5 cm foam layer of mango pulp formulated with additives, dehydrated at three temperatures, and adjusted by the Page model. Dissa et al. (2008) obtained R2 > 0.99
and RMSD < 0.0005 when studied the drying characteristics of Amelie mangoes at 50, 60 and 70ºC, concluding this model had the best fit to the experimental data. Figueirêdo, Queiroz and Medeiros (2013) claimed the fitness of this model to predict the foam-mat drying curves of mangaba pulp
through kinetics analysis, observing values of R2 = 0.9945 and RMSD = 0.0347.
Figure 4. Mango pulp drying kinetics with additives and foam layer thickness of 1.5 cm at different temperatures, adjusted by the Page model.
CONCLUSIONS
Drying kinetics of mango pulp with additives was influenced by temperature, and the smallest foam layer thickness showed to be the fastest at high temperatures.
Overall, the Page model resulted in the best fits to the drying data, showing to be suitable to predict the drying kinetics of mango pulp with additives for all conditions of temperature and foam layer thicknesses.
ACKNOWLEDGMENTS
To CNPq for the support by granting a Research Productivity scholarship (Process N. 304961/2010-8).
REFERENCES
ALEXANDRE, H. V. et al. Cinética de secagem de abacaxi cv. pérola em fatias. Revista Brasileira de
Produtos Agroindustriais, Campina Grande, v. 11,
Model Temperature (°C) Parameter R² RMSD
A k
Temperature (°C) K n R² RMSD
Page
50 0.0009 1.3039 0.9988 0.0004
60 0.0073 1.1533 0.9993 0.0002
70 0.0126 1.1465 0.9990 0.0003
Temperature (°C) K a R² RMSD
Two-term Exponential
50 0.0021 2.2139 0.9917 0.0041
60 0.0022 9.9554 0.9978 0.0006
Rev. Caatinga, Mossoró, v. 30, n. 1, p. 172 – 180, jan. – mar., 2017 179
n. 2, p. 123-128, 2009.
BABALIS, S. J. et al. Evaluation of thin-layer drying models for describing drying kinetics of figs (Ficus carica). Journal of Food Engineering, Essex, v. 75, n. 2, p. 205-214, 2006.
BEZERRA, T. S. et al. Avaliação físico-química e aplicação de modelos matemáticos na predição do comportamento de polpas de manga desidratadas em pó. Revista Ceres, Viçosa, v. 58, n. 3, p. 278-283, 2011.
CORRÊA, P. C. et al. Modelagem matemática para a descrição do processo de secagem do feijão (Phaseolus vulgaris L.) em camadas delgadas. Engenharia Agrícola, Jaboticabal, v. 27, n. 2, p. 501-510, 2007.
CORRÊA, P. C. et al. Modelagem matemática e determinação das propriedades termodinâmicas do café (Coffea arabica L.) durante o processo de secagem. Revista Ceres, Viçosa, v. 57, n. 5, p. 595
-601, 2010.
DISSA, A. O. et al. Convective drying characteristics of Amelie mango (Mangifera indica L. cv. Amelie) with correction for shrinkage. Journal of Food Engineering, Essex, v. 88, n. 4, p. 429-437, 2008.
DOYMAZ, I. Evaluation of some thin-layer drying models of persimmon slices (Diospyros kaki L.). Energy Conversion and Management, Essex, v. 56, n. 1, p. 199-205, 2012.
DOYMAZ, I.; ISMAIL, O. Drying characteristics of sweet cherry. Food and Bioproducts Processing, Essex, v. 89, n. 1, p. 31-38, 2011.
FAO - FOOD AND AGRICULTURE
ORGANIZATION OF THE UNITED NATIONS. Agricultural Outlook 2015. Paris: OECD Publishing, 2015. 143 p. Disponível em: <http:// dx.doi.org/10.1787/agr_outlook-2015-en>. Acesso em: 10 mai. 2016.
FELLOWS, P. J. Tecnologia do processamento de alimentos: princípios e prática. 2. ed. Porto Alegre: Artmed, 2006. 602 p.
FIGUEIRÊDO, R. M. F.; QUEIROZ, A. J. M.; MEDEIROS, J. Cinética de secagem em camada de espuma da polpa de mangaba. In: CONGRESSO IBÉRICO DE AGROINGENIERÍA Y CIENCIAS HORTÍCOLAS, 7., 2013, Madrid. Anais…Madrid: AgIng, 2013. p. 1361-1366.
HENDERSON, S. M. Progress in developing the thin layer drying equation. Transactions of the
ASAE, St. Joseph, v. 17, n. 6, p. 1167-1168, 1974.
HENDERSON, S. M.; PABIS, S. Grain drying theory. Temperature effect on drying coefficient. Journal of Agricultural Engineering Research, London, v. 6, n. 3, p. 169-174, 1961.
IBGE – INSTITUTO BRASILEIRO DE GEOGRAFIA E ESTATÍSTICA. Produção agrícola municipal: culturas temporárias e permanentes. Rio de Janeiro, RJ: IBGE, 2014. 95 p.
KADAM, D. M. et al. Quality of fresh and stored foam mat dried mandarin powder. International Journal of Food Science and Technology, Essex, v. 46, n. 4, p. 793–799, 2011.
KANDASAMY, P. et al. Optimization of process parameters for foam-mat drying of papaya pulp. Journal of Food Science and Technology, Essex, v. 51, n. 10, p. 2526–2534, 2014.
KAYA, A.; AYDIN, O.; DEMIRTAS, C. Drying kinetics of red delicious apple. Biosystems Engineering, Essex, v. 96, n. 4, p. 517–524, 2007.
LIMA, J. R. F. Exportações de manga produzida no Submédio do Vale do São Francisco no período de 2003-2012. Petrolina, PE: Embrapa Semiárido, 2013. 4 p.
MADUREIRA, I. A. M. et al. Cinética de secagem da polpa do figo-da-índia. Revista Brasileira de
Produtos Agroindustriais, Campina Grande, v. 13, Sup., p. 345-354, 2011.
MELO, K. S. et al. Secagem em camada de espuma da polpa do fruto do mandacaru: experimentação e ajustes de modelos matemáticos. Revista Caatinga, Mossoró, v. 26, n. 2, p. 10-17, 2013.
PAGE, G. E. Factors influencing the maximum rates of air drying shelled corn in thin layers. West Lafayette: Purdue University, 1949. 44 p.
PINTO, C. A. Q.; MATOS, A. P.; CUNHA, G. A. P. Variedades (cultivares). In: MATOS, A. P. (Ed.) Manga: aspectos técnicos. Brasília: Embrapa Comunicação para Transferência de Tecnologia, 2000. v. 1, cap. 6, p. 19-20.
RAMOS, A. M.; SOUSA, P. H. M.; BENEVIDES, S. D. Tecnologia da industrialização da manga. In: ROZANE, D. E. et al. (Eds.) Manga: produção integrada, industrialização e comercialização. Viçosa: Universidade Federal de Viçosa, 2004. v. 1, cap. 17, p. 571-604.
Transactions of the ASAE, St. Joseph, v. 23, n. 1, p. 1.261-1.265, 1980.
SILVA, A. S. et al. Cinética de secagem em camada fina da banana maçã em secador de leito fixo. Revista Brasileira de Produtos Agroindustriais, Campina Grande, v. 11, n. 2, p. 129-136, 2009.
SILVA, A. S. et al. Dehydration of tamarind pulp through the foam–mat drying method. Ciência e Agrotecnologia, Lavras, v. 32, n. 6, p. 1899-1905, 2008.
SILVA, W. P. et al. Mathematical models to describe thin-layer drying and to determine drying rate of whole bananas. Journal of the Saudi Society of Agricultural Sciences, Essex, v. 13, n. 1, p. 67-64, 2014.
SOUSA, F. C. et al. Modelagem matemática para descrição da cinética de secagem de polpa de oiti. Revista Educação Agrícola Superior, Brasília, v. 26, n. 2, p. 108-112, 2011.
SOUZA NETO, M. A. et al. Desidratação osmótica de manga seguida de secagem convencional: avaliação das variáveis de processo. Ciência e Agrotecnologia, Lavras, v. 29, n. 5, p. 1021-1028, 2005.
WILSON, R. A. et al. Foam mat drying characteristics of mango pulp. International Journal of Food Science and Nutrition Engineering, Essex, v. 2, n. 4, p. 63-69, 2012.
YAGCIOGLU, A.; DEGIRMENCIOGLU, A.; CAGATAY, F. Drying characteristic of laurel leaves under different conditions. In: INTERNATIONAL
CONGRESS ON AGRICULTURAL