Revista Brasileira de
Engenharia Agrícola e Ambiental
Campina Grande, PB, UAEA/UFCG – http://www.agriambi.com.br
v.20, n.10, p.941-945, 2016
Vertical and horizontal oscillation of three models
of self-propelled boom sprayers
Étore F. Reynaldo
1, Thiago M. Machado
2, Leandro Taubinger
3& Dionathan de Quadros
4DOI: http://dx.doi.org/10.1590/1807-1929/agriambi.v20n10p941-945
A B S T R A C T
The spray boom is one of the sprayer components that most affect the application quality and may cause phytotoxicity and overlay application problems. Therefore, this study aimed to evaluate the displacement in the vertical and horizontal movements of the spray booms in three models of self-propelled boom sprayers. The vibrations of the spray boom in the vertical direction was measured using three receivers (GNSS) with RTK differential correction. The vibration measurements in the horizontal direction were determined using a high resolution camera. At the end, the processed data were entered into a spreadsheet for the descriptive statistics. The smallest spray boom movement in the horizontal direction was obtained by the specimen 2. No statistical differences were observed between the different speeds for the spray boom vibration in the horizontal and vertical directions, in the evaluated sprayers. The largest vertical movements of the spray booms were observed for the self-propelled specimen 3. The impact/collision route type showed the highest deviations and, in undulating and gentle to undulating types, there was no significant difference in deviation values.
Oscilação vertical e horizontal de barras
de três modelos de autopropelidos
R E S U M O
A barra de pulverização é um dos componentes do pulverizador que mais afetam a qualidade de aplicação podendo provocar fitotoxicidade e problemas de sobreposição de aplicação; portando, o presente trabalho teve, como objetivo, avaliar o deslocamento nos movimentos verticais e horizontais de pulverização em três modelos de autopropelidos. A mensuração das vibrações das barras de pulverização no sentido vertical foi realizada com a utilização de três receptores (GNSS) com correção diferencial RTK. As mensurações de vibração no sentido horizontal foram determinadas com a utilização de câmera de alta resolução. Ao final, os dados processados foram transcritos para planilha eletrônica visando à realização de estatística descritiva. O menor deslocamento da barra no sentido horizontal foi apresentado pelo espécime 2. Não foram observadas diferenças estatísticas entre as diferentes velocidades avaliadas em relação à vibração da barra no sentindo horizontal e vertical, nos pulverizadores avaliados. Os maiores deslocamentos verticais das barras foram observados para o autopropelido espécime 3. O modo de percurso impacto/ colisão apresentou os maiores desvios e nos modos ondulado e suave a ondulado não foram observadas diferenças significativas de valores de desvio.
Key words: sprayer
application technology vibration
Palavras-chave: pulverizador
tecnologia de aplicação vibração
1 Monsanto. Uberlândia, MG. E-mail: [email protected]
2 Universidade Federal de Mato Grosso/Instituto de Ciências Agrárias e Ambientais. Sinop, MT. E-mail: [email protected] (Corresponding author)
3 Universidade Estadual do Centro-Oeste. Guarapuava, PR. E-mail: [email protected]
4 Fundação Agrária de Pesquisa Agropecuária. Entre Rio, PR. E-mail: [email protected]
Introduction
Self-propelled boom sprayers are machines used in operations of application of agrochemicals that can perform low-, medium- and high-volume applications according to crop needs, whose main advantages are the high speed and the large volume of the tank (Gadanha Júnior et al., 1991; Ferreira et al., 2010).
Vertical oscillations of the spray boom caused by irregularities on the terrain alter the distance between each nozzle and the target, and distort the distribution. The movement of the spray boom, vertical and/or horizontal, causes a drastic effect on the distribution pattern (Pontelli et al., 2010). In addition, when excessive, they cause the tips of the spray booms to touch the soil, causing eventual damages (Pontelli, 2012). According to the same authors, the rolling movement of the spray boom is caused by the rotation of the equipment in relation to the longitudinal axis. This type of movement causes the spray boom, seen from behind, to oscillate up and down. Such oscillation primarily causes vertical motions of the spray boom, although it can also cause lateral motions (transversal). On the other hand, the yaw movement is caused by the rotation of the equipment in relation to the vertical axis. This type of movement causes the spray boom, seen from the side, to oscillate forward and backward. By reducing the oscillating movements of the spray booms, the variability of deposition can be reduced (Ganzelmeir & Moser, 1977).
One of the ways to minimize the coefficients of variation of the spray distribution is to install mechanisms to stabilize the boom within acceptable parameters. These mechanisms are known as boom suspensions for sprayers (Pontelli & Mucheroni, 2009). According to Queiroz (2001), the use of boom with stabilizer promoted better result regarding the amplitude of the vertical movement, decreasing its oscillation.
The adoption of adequate application techniques and devices that favor the deposition of the product on the desired target is one of the ways to increase application efficiency, besides reducing losses and risks of environmental contamination (Cunha, 2008; Cunha & Silva Júnior, 2010; Rodrigues et al., 2010; Zyl et al., 2013; Machado, 2014).
This study aimed to determine the vertical and horizontal movements of the spray boom in three models of self-propelled sprayers.
Material and Methods
Field evaluations were conducted at the Santa Clara Farm, in the municipality of Candoi, PR, situated at the geographic coordinates of 25° 36’ S and 51° 59’ W. The soil of the experimental area was a cambic aluminic Brown Latosol, with prominent A horizon, gently undulating relief and basalt substrate (EMBRAPA, 1999), with textural class varying from clayey to very clayey.
Prior to the field test, the correction base was allocated (differential signal), through the collection of information from the Global Navigation Satellite System (GNSS) data, using a GNSS receiver (Trimble NetR9) with 440 channels. After the period of collection of information (16 hours), the
coordinate was transported (correction of the base location error) according to the norms established by the Brazilian Institute of Geography and Statistics - IBGE. The estimated base error was 0.004 m in planimetry and 0.010 m in altimetry.
The vibrations on the spray boom, in the vertical direction, were measured using three GNSS receivers with RTK differential correction. Two of the receivers were allocated on the tips of the spray boom and one was allocated in the center of the displacement axis of the self-propelled sprayer. Data collection was parameterized by distance, i.e., altimetry information was collected every 0.10 m. After collection, the data were transferred to the Trimble Business Center software and those with low precision level and/or abnormal were eliminated. In addition, the collected data of latitude and longitude with number of satellites lower than 18 were excluded. Thus, higher horizontal and vertical precision was maintained.
Vibrations in the horizontal direction were measured using a high-resolution camera (1080 pixels) with 30 frames per second (30 FPS) (GoPro - Model Hero and Hero 3). The cameras were positioned at the base of the spray booms in order to capture forward and backward boom movements in relation to the forward direction of the self-propelled sprayer. After the collection, the images were edited using the Adobe Premmier 2.0 software. The RTK GNSS receiver, fixed at the tips of the spray boom (right and left sides), was used as reference (0.22 m scale) for the determination, by rule of three, of the number of spaces (scale) between the resting point of the boom during the displacement and its maximum movement (forward and backward), thus obtaining the values for the horizontal vibrations (yaw movement) of the spray boom; then, the values were transcribed to an electronic spreadsheet for the descriptive analyses.
The self-propelled sprayers evaluated in the test of boom stability were: (Specimen 1) model - Imperador 3100, brand - Stara, weight - 9800 kg, boom length - 30 m, spacing between nozzles - 0.5 m, tank - 3100 L, power - 215 hp, tires - 300/95R46; (Specimen 2) model - 4730, brand - John Deere, weight - 10650 kg, boom length - 30.5 m, spacing between nozzles - 0.5 m, tank - 3028 L, power - 245 hp, tires - 420/80R46, (Specimen 3) model - 3030, brand - Jacto, weight - 9900 kg, boom length - 32 m, spacing between nozzles - 0.5 m, tank - 3000L, power - 243 hp, tires - 390/90R46. For the test, a volume of 1500 L was used, which is equivalent to half the volume of the tank.
The variables used in the evaluation of spray boom vibration of the different sprayers were: displacement speed, 13, 18 and 23 km h-1; type of route used in boom stability
evaluation: gentle to undulating, from 1 to 23 m; undulating, from 24 to 71 m, and impact/collision, from 72 to 83 m (point at which the spray boom touches the crop and/or the soil). The statistical design was in strips, with 3 replicates.
Descriptive statistics was used to analyze the data referring to yaw movement, vertical vibration in relation to the type of terrain and boom position error according to the sprayer and the speed.
subjected to F test and the means were compared by Tukey test at 0.05 probability level.
Results and Discussion
The result of the altimetry survey of the evaluation track of the self-propelled sprayers is presented in Figure 1.
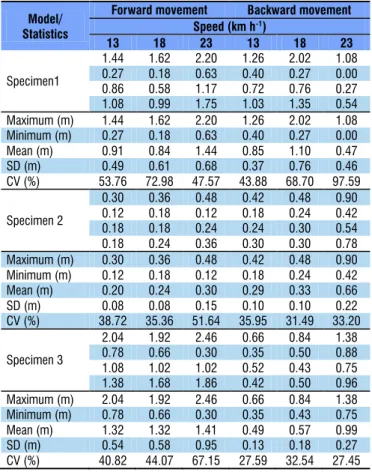
The sprayers specimen 3 and specimen 2 showed increase in the mean vibration of the spray booms in the horizontal direction as the displacement speed increased (Table 1), but did not have significant results. The sprayer specimen 1 did not show this tendency in the behavior, probably due to the fact that the structure of the boom was in its center, thus distributing the vibration loads. For specimen 3 and specimen 1, the boom movements in the horizontal direction reached a maximum of
more than 2 m. The results are consistent with those of Musillami (1977), who observed that the oscillations increased with the increment in the displacement speed of the machine.
The specimen 3 showed the highest mean value of horizontal boom movement (1.02 m), while the lowest value occurred for the specimen 2 (0.34 m of variation) (Figure 2A).
The horizontal movement of the boom cannot be rigid to the point of compromising its structure or, on the other hand, too flexible, since it may lead to the presence of areas with phytotoxicity due to the excess of product deposited on the plant, resulting from the excessive boom movement (forward and backward).
Despite the tendency of increment in the movement as the displacement speed increased, there were no statistical differences between the different speeds evaluated (Figure 2B) and, for the horizontal boom vibration, the values of spray boom movement ranged from 0.68 to 0.88 m.
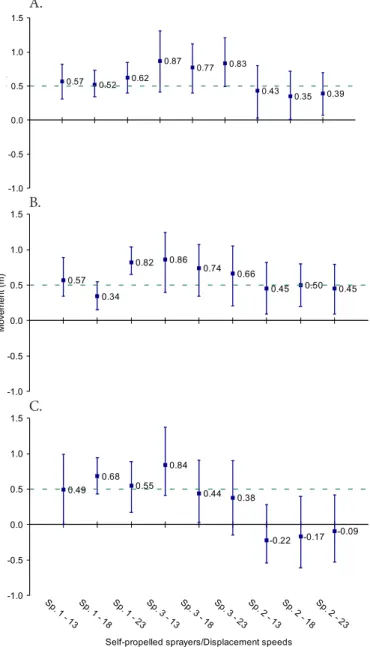
The graph of Figure 3 shows the profiles of vibration of vertical movement of the spray boom (rolling movement) in the different self-propelled sprayers evaluated with displacement speeds of 13, 18 and 23 km h-1, respectively. The reference line
represents the altimetry profile where the spray boom should pass, i.e., 0.5 above the crop canopy.
The sprayers that showed greater movements in the spray boom position, in relation to the reference, were specimen 3 and specimen 2.
Model/ Statistics
Forward movement Backward movement Speed (km h-1)
13 18 23 13 18 23
Specimen1
1.44 1.62 2.20 1.26 2.02 1.08
0.27 0.18 0.63 0.40 0.27 0.00
0.86 0.58 1.17 0.72 0.76 0.27
1.08 0.99 1.75 1.03 1.35 0.54
Maximum (m) 1.44 1.62 2.20 1.26 2.02 1.08
Minimum (m) 0.27 0.18 0.63 0.40 0.27 0.00
Mean (m) 0.91 0.84 1.44 0.85 1.10 0.47
SD (m) 0.49 0.61 0.68 0.37 0.76 0.46
CV (%) 53.76 72.98 47.57 43.88 68.70 97.59
Specimen 2
0.30 0.36 0.48 0.42 0.48 0.90
0.12 0.18 0.12 0.18 0.24 0.42
0.18 0.18 0.24 0.24 0.30 0.54
0.18 0.24 0.36 0.30 0.30 0.78
Maximum (m) 0.30 0.36 0.48 0.42 0.48 0.90
Minimum (m) 0.12 0.18 0.12 0.18 0.24 0.42
Mean (m) 0.20 0.24 0.30 0.29 0.33 0.66
SD (m) 0.08 0.08 0.15 0.10 0.10 0.22
CV (%) 38.72 35.36 51.64 35.95 31.49 33.20
Specimen 3
2.04 1.92 2.46 0.66 0.84 1.38
0.78 0.66 0.30 0.35 0.50 0.88
1.08 1.02 1.02 0.52 0.43 0.75
1.38 1.68 1.86 0.42 0.50 0.96
Maximum (m) 2.04 1.92 2.46 0.66 0.84 1.38
Minimum (m) 0.78 0.66 0.30 0.35 0.43 0.75
Mean (m) 1.32 1.32 1.41 0.49 0.57 0.99
SD (m) 0.54 0.58 0.95 0.13 0.18 0.27
CV (%) 40.82 44.07 67.15 27.59 32.54 27.45
Table 1. Descriptive statistics of spray boom movements in the variation of forward and backward positions relative to the movements promoted at different speeds
Figure 1. Altimetry survey of the route simulation track
921 922 923 924 925 926
0 5 11 17 24 31 37 43 49 56 64 72 79 86 93 99
107 114 121 128 136 142
El
ev
atio
n(
m)
Route distance (m)
*Means followed by the same letters do not differ by Tukey test at 0.05 probability level
Figure 2. Statistical analysis between self-propelled sprayers evaluated for the horizontal vibration of the spray boom (A) and mean horizontal movement as a function of the forward speed of the self-propelled sprayers (B)
0.0 0.2 0.4 0.6 0.8 1.0 1.2
13 18 23
p value: < 0.0001
M
o
v
e
m
e
n
t
(m
)
Displacement speed (km h )-1
0.68 0.73
0.88
0.0 0.2 0.4 0.6 0.8 1.0 1.2
Specimen 3 Specimen 1 Specimen 2
p value: < 0.0001
M
o
v
e
m
e
n
t
(m
)
A
B
C 1.02
0.94
0.34
The greatest movements were obtained in the undulating route (from 24 to 71 m), reaching in some cases the distance of 2.24 m in relation to the reference. The specimen 3 showed the greatest distances (time of response to the normalization of the boom) for the boom to come back to the desired position after passing through the different routes.
According to the graph in Figure 3, the greatest boom movements were observed for the specimen 3, regardless of the displacement route. Specimen 1 showed the best behavior in relation to the reference (black dashed line), with values close to the desired one (0.5 m in relation to the target). Specimen 2, on the other hand, showed boom movement behavior below the desired one, with potential to reduce the efficiency of application, since it operated with boom height below the desired position in all routes; consequently, it may compromise the overlapping of the spraying nozzles. This fact is explained by the absence of boom action to return to the original position (application position) after it touches the crop, due to the passing through the obstacles of the evaluation track.
Studies indicate that the rolling movement of the spray boom is responsible for variations of 0 to 1000% in the volume distribution, whereas a variation of up to 100% would be usual due to the field variations (Ramon et al., 1997). Figure 4A shows the result of the statistical analysis for the standard deviation of the evaluated sprayers.
The standard deviation is an interesting way to evaluate the different sprayers, since it measures the deviations (displacement) in relation to the reference (0.5 m above the canopy) at the different measurement points.
Basically, the specimen 1 showed the lowest standard deviation and differed from the others, with mean standard deviation of 0.18 m; specimen 2 and specimen 3 ranged from 0.26 to 0.29 m, respectively. It should be pointed out that, although the specimen 3 has boom with 32 m, it showed a behavior similar to that of specimen 2, with spray boom of 30 m.
The displacement speed did not influence the standard deviation measurement of the spray boom in the different self-propelled sprayers evaluated, as presented in the graph of Figure 4B.
The data in Figure 4B demonstrate that the displacement speed would not be the limiting factor and/or would not influence the spray boom in following the altimetry profile
S S S S S S S S S
-1.0 -0.5 0.0 0.5 1.0 1.5
Movement (m)
0.57 0.52 0.62 0.87
0.77 0.83
0.43
0.35 0.39
-1.0 -0.5 0.0 0.5 1.0 1.5
S S S S S S S S S
Movement (m)
0.57
0.34
0.82 0.86 0.74
0.66
0.45 0.50 0.45
-1.0 -0.5 0.0 0.5 1.0 1.5
Sp. 1 - 13
Sp. 1 - 18
Sp. 1 - 23
Sp. 3 - 13
Sp. 3 - 18
Sp. 3 - 23
Sp. 2 - 13
Sp. 2 - 18
Sp. 2 - 23
Self-propelled sprayers/Displacement speeds 0.49
0.68 0.55
0.84
0.44 0.38
-0.22 -0.17 -0.09
A.
B.
C.
Figure 3. Descriptive statistics of the vertical vibration of the spray boom (rolling) according to the sprayer and displacement speed for the route conditions: (A) Gentle to undulating; (B) Undulating and (C) Impact/collision
*Means followed by the same letters do not differ by Tukey test at 0.05 probability level
Figure 4. Standard deviation (boom positioning error) according to the different self-propelled sprayers evaluated for the vertical movement of the spray boom (A) and according to the different displacement speeds evaluated (B)
0.00 0.05 0.10 0.15 0.20 0.25 0.30 0.35 0.40 0.45 0.50
13 18 23
p value: < 0.3728
S
ta
n
d
a
rd
e
v
ia
ti
o
n
(m
)
d
Displacement speed (km h )-1
0.27
0.22 0.24
0.00 0.05 0.10 0.15 0.20 0.25 0.30 0.35 0.40 0.45 0.50
Imperador JD 4730 Uniport 3030 p value: < 0.0007
S
ta
n
d
a
rd
e
v
ia
ti
o
n
(m
)
d
Self-propelled sprayers B
A
A
0.18
0.26
0.29
of the soil. Although there is no statistical difference between the deviations, there was even a tendency of reduction in the vertical movements when the speed increased. This is partially due to the absorption of vibrations by part of the suspension system of the self-propelled sprayers.
According to Lardoux et al. (2007a; b), various studies show that the use of boom suspension system causes the variation in volume distribution to decrease drastically.
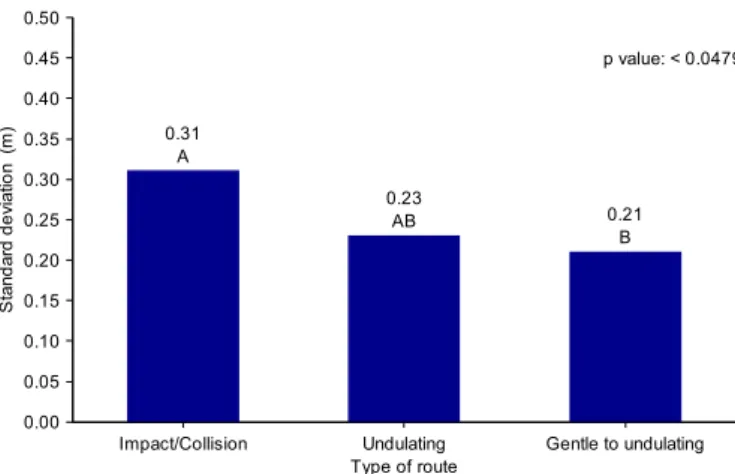
The graph of Figure 5 shows the standard deviation according to the type of route for the different self-propelled sprayers evaluated. The impact/collision type of route showed the highest standard deviations, 0.31 m. In the undulating and gentle to undulating type, there was no difference, with deviations 0.23 and 0.21 m. The increment in speed did not influence spray boom stability; however, the type of route has great influence on the vibration-absorbing systems of the spray booms.
EMBRAPA - Empresa Brasileira de Pesquisa Agropecuária. Centro Nacional de Pesquisa de Solos. Sistema brasileiro de classificação de solos. Rio de Janeiro: Embrapa CNPS, 1999. 412p.
Ferreira, A. L.; Balthazar, J. M.; Pontes Júnior, B. R. P. Influência da suspensão na segurança e no conforto de um pulverizador autopropelido. Engenharia Agrícola, v.30, p.753-760, 2010. http:// dx.doi.org/10.1590/S0100-69162010000400019
Gadanha Júnior, C. D.; Molin, J. M.; Coelho, J. L. D.; Yahn, C. H.; Tomimori, S. M. A. W. Máquinas e implementos agrícolas do Brasil. São Paulo: Instituto de Pesquisas Tecnológicas do Estado de São Paulo, 1991. 468p.
Ganzelmeir, H.; Moser, E. Effect of boom movements of field sprayers on the evenness of distribution of the spray fluid. Journal Agricultural Engineering Resource, v.27, p.65-72, 1977.
Lardoux, Y.; Sinfort, C.; Enfält, P.; Miralles, A.; Sevila, F. Test method for boom suspension influence on spray distribution. Part I: Experimental study of pesticide application under a moving boom. Biosystems Engineering, v.96, p.29-39, 2007a. http://dx.doi. org/10.1016/j.biosystemseng.2006.08.014
Lardoux, Y.; Sinfort, C.; Enfält, P.; Miralles, A.; Sevila, F. Test method for boom suspension influence on spray distribution. Part II: Validation and use of a spray distribution model. Biosystems Engineering, v.96, p.161-168, 2007b. http://dx.doi.org/10.1016/j. biosystemseng.2006.10.003
Machado, T. M. Inspeção periódica de pulverizadores de barras na região de Guarapuava - PR. Enciclopédia Biosfera, v.10, p.1225-1233, 2014.
Musillami, S. Les mouvements des rampes de pulverization pour culture bases, a fixation classique, etudiés a travers les repartitions au banc a gouttieres. Antomy: CNEEMA, 1977. 103p.
Pontelli, C. O. Estratégias de controle para isolação ativa de vibrações em barras de pulverizadores agrícolas. São Carlos: Escola de Engenharia de São Carlos, Universidade de São Paulo, 2012. 139p. Tese Doutorado. http://dx.doi.org/10.11606/t.18.2012. tde-03102013-093840
Pontelli, C. O.; Mucheroni, M. F. Validação do modelo de uma suspensão de barra utilizada em pulverizadores tracionados. Minerva - Pesquisa e Tecnologia, v.6, p.189-196, 2009.
Pontelli, C. O.; Mucheroni, M. F.; Balthazar, J. M.; Pontes Júnior, B. R. Comparação entre dois tipos de suspensão passiva de barra em condições simuladas de pista de prova normalizada. Engenharia Agrícola, v.30, p.761-775, 2010. http://dx.doi.org/10.1590/S0100-69162010000400020
Queiroz, C. A. S. Uso de videografia digital para avaliação da estabilidade da barra de pulverização em área de florestamento. Botucatu: UNESP, 2001. 48p. Dissertação Mestrado
Ramon, H.; Missotten, B.; Baerdemaeker, J. de. Spray boom motions and spray distribution: Part 2, experimental validation of the mathematical relation and simulation results. Journal of Agricultural Engineering Research, v.66, p.31-39, 1997. http:// dx.doi.org/10.1006/jaer.1996.0115
Rodrigues, A. C. P.; Filho, S. I. B. S.; Martins, D.; Costa, N. V.; Rocha, D. C.; Souza, G. S. F. Avaliação qualitativa e quantitativa na
deposição de calda de pulverização em Commelina benghalensis.
Planta Daninha, v.28, p.421-428, 2010. http://dx.doi.org/10.1590/ S0100-83582010000200022
Zyl, J. G. van; Fourie, P. H.; Schutte, G. C. Spray deposition assessment and benchmarks for control of Alternaria brown spot on mandarin leaves with copper oxychloride. Crop Protection, v.46, p.80-87, 2013. http://dx.doi.org/10.1016/j.cropro.2012.12.005
*Means followed by the same letters do not differ by Tukey test at 0.05 probability level
Figure 5. Standard deviation (boom positioning error) according to the type of route
0.00 0.05 0.10 0.15 0.20 0.25 0.30 0.35 0.40 0.45 0.50
Impact/Collision Undulating Gentle to undulating p value: < 0.0479
S
ta
n
d
a
rd
e
v
ia
ti
o
n
(m
)
d
Type of route A
AB
B 0.31
0.23
0.21
Conclusions
1. The smallest boom movement in the horizontal direction occurred for the specimen 2.
2. There were no statistical differences between the evaluated speeds and their boom vibration behaviors in the horizontal and vertical directions for the evaluated self-propelled sprayers.
3. The greatest vertical boom movements were observed for the specimen 3, regardless of the displacement route. The specimen 1 showed the best behavior.
4. The type of route had high influence on the vibration-absorbing systems of the spray booms and the impact/collision type showed the highest deviations, while undulating and gentle to undulating showed no significant differences in the deviation values.
Literature Cited
Cunha, J. P. A. R. Simulação de deriva de agrotóxicos em diferentes condições de pulverização. Ciência e Agrotecnologia, v.32, p.1616-1621, 2008. http://dx.doi.org/10.1590/S1413-70542008000500039 Cunha, J. P. A. R.; Silva Júnior, A. D. Volumes de calda e pontas de
pulverização no controle químico de Spodoptera frugiperda na