BJRS
RADIATION SCIENCES
07-01A (2019) 01-13ISSN: 2319-0612 Accepted 2018-09-24
Development of an automatic tool for dose management in
digital mammography
M. Medina
a; F. Funes
a; V. Sanz
a,b; A. Palau
c; M. Namías
ca
Comisión Nacional de Energía Atómica, 1429, Buenos Aires City, Buenos Aires, Argentina
b
Facultad de Ciencias Exactas, Universidad Nacional de La Plata /1900, La Plata, Buenos Aires, Argentina
c
Fundación Centro Diagnóstico Nuclear, 1417, Buenos Aires City, Buenos Aires, Argentina [email protected]
ABSTRACT
INTRODUCTION: Digital mammography units usually record the entrance surface exposure (ESE) and the average glandular dose (AGD) received by the patient for each exposure. This information is available in the DICOM image headers and can be used to perform dose surveys. The main objective of this paper was to develop a software tool to automatically analyze digital mammography image headers and to estimate the dose received by each patient. MATERIALS AND METHODS: Images were acquired on a Senographe Essential (GE Healthcare) digital mammography system, using automatic exposure control. Patients with breast implants were excluded. Images were queried and downloaded from the institution's PACS system using the DCM4CHE 3.0 open source toolkit. MATLAB code was developed to extract the breast thickness and the AGD from the DICOM headers. This data was exported to a spreadsheet for further analysis. RESULTS: Demographic data, breast thickness and dose per view were analyzed for 59 patients. Mean AGDs of 1.57 mGy and 1.53 mGy were obtained for the craniocaudal (CC) and mediolateral oblique (MLO) views respectively. CONCLUSIONS: the developed tool proved to be useful for auditing doses from digital mammography.
1. INTRODUCTION
According to the World Health Organization, breast cancer is the most common type of cancer in women and the second leading cause of death in American women. For this reason, asymptomatic women are encouraged to undergo screening, leading to early diagnosis and improved outcomes [[1]]. Mammography is the most common screening method currently used. The frequency with which mammography scans are carried out differs around the world, as it is dependent on national regulations and local medical societies’ recommendations. The National Breast Cancer Control Program was created in Argentina in 2013 [[2]]. This program uses mammography as the main screening method, with the recommendation that mammograms be repeated every second year.
The use of mammography as a screening method involves exposing an asymptomatic population to ionizing radiation. As such, it is crucial that the procedure is optimized.
In medical procedures, optimization involves achieving a balance between radiation dose and image quality. The first step in dose optimization should involve the implementation of a dose monitoring program. The values obtained over time should be periodically compared with reference levels, if available. This system allows checks to be carried out, ensuring that patients are exposed to appropriate dose levels.
Due to the high number of patients that are usually scanned in a mammography service, and taking into account the fact that at least four images are acquired for every patient (two for each breast), it is not feasible to maintain a manual record of dosimetric parameters. A retrospective analysis of the patient doses would also be difficult to carry out. Without an automatic method to obtain and analyze this data, institutions often choose to not keep patient dose records.
Digital mammography units record exposure parameters (kV, current, anode-filter combination) and dose parameters (entrance surface exposure [ESE] and average glandular dose [AGD]) after each acquisition. This information is available in the DICOM headers and can be used to perform a dosimetric survey. Commercial software that carries out this kind of analysis exists (GE Dosewatch, Siemens Right Dose [[3], [4]] etc.), although it is not currently available in Argentina.
The aim of this project was to develop a software tool that automatically retrieves and processes the dose data from digital mammograms. A comparison was made between the dose values obtained with this program and those available in literature.
2. MATERIALS AND METHODS
2.1. Image acquisition
Images were acquired using automatic exposure control (AEC). This method estimates the attenuation of the breast by carrying out a low-exposure pre-scan. With this information, the system estimates the voltage (kV) and current (mAs) needed to achieve a certain signal level in the detector. The system have three AEC modes: contrast (CNT), standard (STD) and dose (DOSE), corresponding to different signal, noise and dose levels. The STD mode was used for image acquisition, as it provided a good balance between signal-to-noise ratio and dose. This was determined by carrying out a signal difference noise ratio (SDNR) compensation and AGD test [[5]]. The contrast and noise characteristics of STD mode were also subjectively preferred by the institution’s radiologist.
2.2. Quality control of the mammography unit
Routine quality control tests, based on the European Federation of Organizations for Medical Physics (EFOMP) protocol [5], were implemented in order to evaluate dosimetric and image quality parameters.
Dosimetric evaluation was carried out by obtaining exposure parameters (kV and mAs) for different PMMA thicknesses (range 20 – 60 mm), using AEC in STD mode. The values obtained were used to repeat the acquisition in manual mode. Air kerma delivered by the equipment was measured with an ionizing chamber (Flat ionization chamber, type 77334-773347, model PTW) placed 40 mm above the image receptor. This was in order to avoid backscatter. Measurements were also obtained with the ionizing chamber placed 60 mm away from the detector side, in order to achieve better precision.
Measured air kerma values were used to calculate the AGD [[5], [6]] as shown in eq. 1
AGDcalc [mGy] = Ki.g.c.s (1)
Where:
Ki is the entrance surface air kerma without backscatter;
g is the incident air kerma to dose conversion factor for breasts with 50 % glandularity and 50 %
fat tissue. It is dependent on breast thickness and the X-ray beam half value layer (HVL);
c is a factor that corrects for departures in breast composition from 50% glandularity. This factor
takes HVL and breast thickness into account for breasts of glandularities of: 0.1, 25, 50, 75 and 100%.
s is a factor that corrects for the target/filter combination, taking different X-ray spectra into
account.
The AGD values estimated using this method were compared with the values shown on the acquisition station (recorded in the DICOM headers) in order to check for agreement.
An American College of Radiology (ACR) mammography phantom was used to analyze image quality. The measured parameters were: noise uniformity, high frequency modulation (HFM), number of bad ROIs or pixels, signal to noise ratio (SNR), contrast to noise ratio (CNR), modulation transfer function (MTF) and mass, micro-calcification and fiber detectability. This last test was carried out with AEC, to simulate the clinical scenarios.
2.3. Inclusion criteria
This was a retrospective study that included the images of patients who underwent breast cancer screening. Only patients with complete studies (containing at least four images: left and right CC and MLO projections) were included. Images from patients with breast implants and those, which had been magnified, were excluded.
2.4. Data extraction
Images were downloaded from our institution’s PACS archive, using the DCM4CHE 3 open source toolkit [[7]]. The downloading process is completely automatic and the duration of the transfer depends on the number of images to be downloaded.
Another software tool was developed in MATLAB to analyze the images. It reads the DICOM headers and extracts demographic information (name, age, study date) as well as dosimetric parameters (breast thickness, laterality, compression force and AGD). The AGD dose value was stored on the 0040,0316 DICOM tag, which is a GE proprietary implementation.
The remaining information was then exported to a spreadsheet for further analysis.
Breast glandularity was obtained from the medical report of each patient [8]. Fibro-fatty, dispersed fibro-glandular and heterogeneously dense breasts were assigned a descriptive score of 1, 2 and 3, respectively. This data was available only for a subgroup of patients.
2.5. Data analysis
The following analyzes were performed:
2.5.1 Comparison between AGDcalc and the AGD values stored in the DICOM headers, as
explained in section 2.2. The comparison was performed using a Bland-Altman plot. 2.5.2 Comparison of the AGD for the CC and MLO projections of each breast: AGD values
obtained from the CC and MLO projections were compared to each other for each breast, in order to check whether there were significant differences in the dose received by the breast in each projection.To carry out this analysis, a paired t-test was performed.
2.5.3 Analysis of factors affecting AGD: multiple regression analysis was performed in Microsoft Excel to identify which factors contributed to the AGD. The independent variables were breast thickness, glandularity and compression force. In this analysis, only the images that had records of the three variables were included.
2.5.4 Dosimetric analysis and comparison with similar surveys: a comparison was made between the AGD values obtained for CC and MLO views in this survey, and those
reported by similar surveys [[9], [10]] for mammography units identical to the one installed in our institution.
3. RESULTS AND DISCUSSION
3.1. Image acquisition
The SDNR compensation and AGD test showed that using the equipment in STD mode gave acceptable values for both SDNR and AGDcalc (Table 1). DOSE mode resulted in increased image
noise for small thicknesses of PMMA (30 mm and 40 mm) and the CNT mode for thicknesses of PMMA of 20 mm and 30 mm resulted in AGD values which were higher than the upper acceptable limits recommended by the EFOMP protocol.
Table 1: Results of the SDNR compensation and AGDcalc tests
PMMA [mm] SDNR ΔSDNR45mm (%) ΔSDNR45mm Limits Test AGDcalc [mGy] AGD limit [mGy] 20 2.20 222.13 ≥ 0% Passed 0.803 < 1.0 30 1.51 120.50 ≥ 0% Passed 0.945 < 1.5 40 0.74 7.66 ≥ 0% Passed 1.464 < 2.0 45 0.68 0.00 0 Passed 1.669 < 2.5 50 0.20 -71.13 ≤ -15% Passed 1.416 < 3.0 60 0.80 16.88 ≥ -30% Passed 1.783 < 4.5
3.2. Quality control of the mammography unit
The following results were obtained during the evaluation of image quality; they are expressed as the name of the test: value obtained (acceptance limit).
Brightness Non-Uniformity: 0.72 (≤ 10.0), High Frequency Modulation (HFM): 0.33 (≤ 0.80), SNR Uniformity: 32.85 (≤ 50), masses detected: 5 (≥ 3; ≤ 5), calcification groups detected: 4.5 (5), fibers detected: 5.5 (6), MTF parallel at 2 lp/mm: 63.10 ( > 49%), MTF parallel at 4 lp/mm: 28.73 (
> 18%), MTF perpendicular at 2 lp/mm: 64.11 ( > 49%), MTF perpendicular at 4 lp/mm: 28.61 (> 18%), contrast to noise ratio (CNR): 35.72 (N/A), signal to noise ratio (SNR): 140.21 ( > 50.0). No bad ROI’s or bad pixels were obtained.
3.3. Inclusion criteria
A total of 257 images (130 CC and 127 MLO) from 59 patients were analyzed, their ages ranged between 40 and 70 years old. Demographic (name, age, study date) and dosimetric (breast thickness, laterality and AGD) information was obtained from the DICOM headers.
3.4. Data extraction
The query/retrieve and analysis steps took less than five minutes. Although this would take longer if more images were required, the process is fully automatic, and requires minimal user intervention.
Although the software was tested on a small number of patients, it could be easily adapted for use in other imaging sites with a larger number of patients. The software developed can be adapted to other mammography units provided that the DICOM fields that store the AGD information are known. Also, the software could be useful for national or regional dose surveys that lead to the establishment of dose reference levels.
3.5. Data analysis
3.5.1 Comparison between AGD
calcand AGD from DICOM Headers
Table 2 shows the values obtained for AGDcalc, as detailed in section 2.2, as well as the AGD
recorded in the DICOM headers. The difference between the values obtained using each method was less than ± 2%.
Table 2: AGD obtained from DICOM headers and the calculated using equation 1 Thickness PMMA DICOM header [mGy] AGDCalc [mGy] Difference [%] 20 0.790 0.803 1.819 30 0.960 0.945 1.571 40 1.450 1.464 0.984 45 1.670 1.669 0.056 50 1.410 1.416 0.423 60 1.790 1.783 0.388
As a further comparison, figure 1 shows a Bland-Altman graph where the AGDCalc and
AGDDICOM Header measurement methods are compared. The mean and the SD of the differences
between both methods were -0.0016 and 0.011 respectively; the dashed lines represent a 95% confidence interval of (-0.02;0.02). Although this dataset consists of few points, the 95% confidence limits are about an order of magnitude below any clinically relevant AGD value and so it can be concluded that the AGD provided by the DICOM header files are probably estimated using equation 1.
3.5.2 Comparison of the AGD for the CC and MLO projections of each
breast
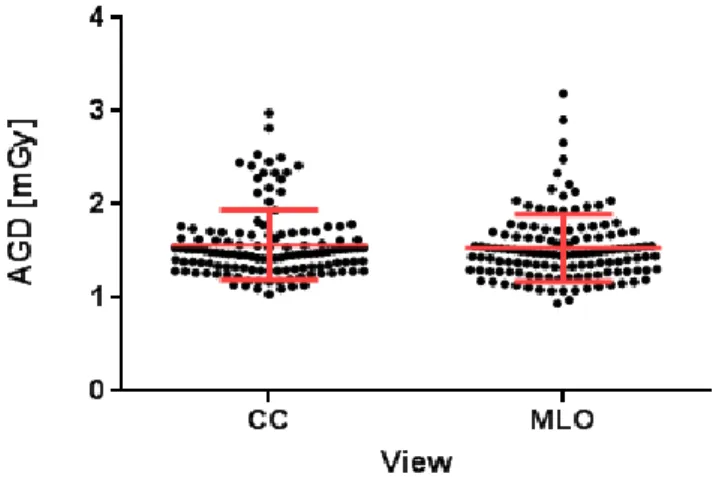
The paired t-test resulted in a p-value of 0.37, showing that no statistically significant difference was found between the AGD from CC and MLO views. Figure 2 shows the AGD dispersion for each view. Mean and standard deviation values for the differences are -0.03 mGy and 0.43 mGy, respectively.
Figure 2. AGD dispersion of the analyzed patients for each view. Each dot represents a patient. Horizontal bars show mean ± standard deviation.
3.5.3. Factors that contribute to AGD
The paired t-test resulted in a p-value of 0.37, showing that no statistically significant difference was found between the AGD from CC and MLO views. Figure 2 shows the AGD dispersion for each view. Mean and standard deviation values for the differences are -0.03 mGy and 0.43 mGy, respectively.
The relationship between AGD and compressed breast thickness for each projection is shown in Figure 3.
Figure 3. AGD vs breast thickness
These results suggest that probably the AGD not only depends on breast thickness. This is in agreement with the literature [[11]], which suggest that AGD can also depend on breast density and compression force.
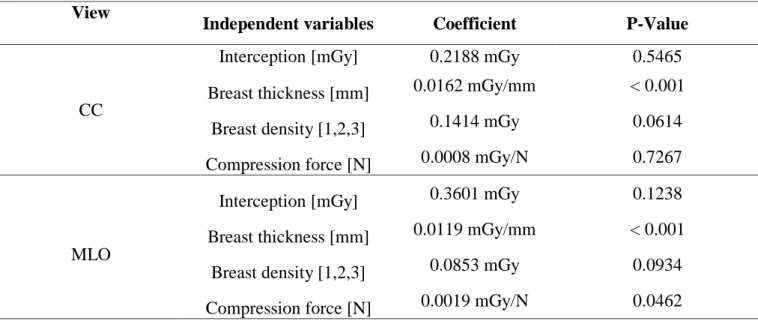
The results of multiple regression analysis from 62 CC and 64 MLO views are shown in table 3.
Table 3: Multiple regression analysis for CC and MLO view View
Independent variables Coefficient P-Value
CC
Interception [mGy] 0.2188 mGy 0.5465 Breast thickness [mm] 0.0162 mGy/mm < 0.001
Breast density [1,2,3] 0.1414 mGy 0.0614 Compression force [N] 0.0008 mGy/N 0.7267
MLO
Interception [mGy] 0.3601 mGy 0.1238 Breast thickness [mm] 0.0119 mGy/mm < 0.001
Breast density [1,2,3] 0.0853 mGy 0.0934 Compression force [N] 0.0019 mGy/N 0.0462
Multiple regression showed a weak correlation between breast thickness and AGD for both projections. This result was also visualized in figure 3 where AGD does not increase significantly
with thickness. It is also observed that, for the AGD values of the images analyzed, the variables breast density and compression strength are not significant in the estimation of the AGD value.
3.5.4. Dosimetric analysis and comparison with similar surveys
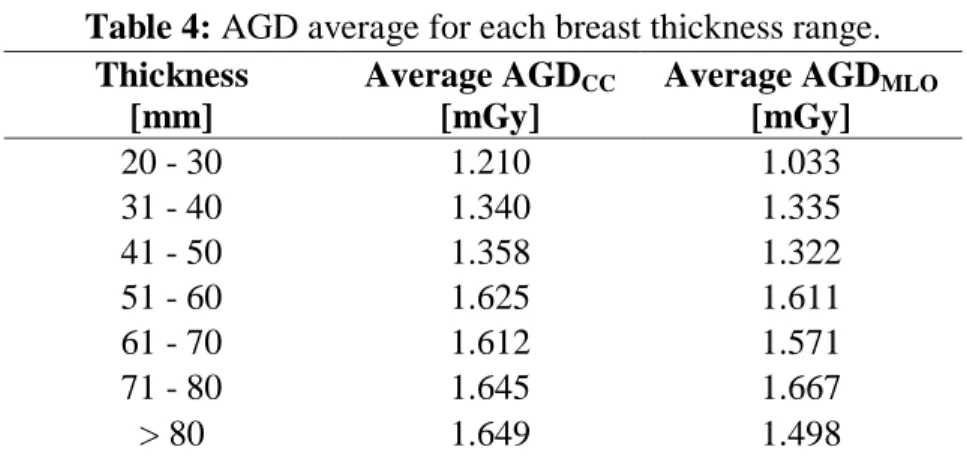
Table 4 shows the average AGD values obtained from the DICOM headers for each view and breast thickness range.
Table 4: AGD average for each breast thickness range. Thickness
[mm]
Average AGDCC
[mGy]
Average AGDMLO
[mGy] 20 - 30 1.210 1.033 31 - 40 1.340 1.335 41 - 50 1.358 1.322 51 - 60 1.625 1.611 61 - 70 1.612 1.571 71 - 80 1.645 1.667 > 80 1.649 1.498
Table 5 summarizes the average values of AGD and the thicknesses obtained for each projection (CC and MLO) in our analysis and those reported in the literature.
Table 5: AGD values obtained locally and comparison with those reported in the literature Projection Average Thickness [mm] AGD [mGy] Average SD CC 59.4 1.57 0.37 MLO 59.2 1.53 0.36 Both[9] 60.0 1.30 0.21 CC [10] 61.1 1.38 0.11 MLO[10] 1.47 0.13
AGD values obtained for the population analyzed in this study are similar to the values reported in the research by Suleiman et al [[10]] and are also comparable to the levels which were found to be acceptable and achievable in Hauge et al [[9]]. Although the mean values were similar, a
significant difference was found between the standard deviation of our doses and those reported in [8] and [9]. The cause of this difference will be analyzed in future work.
CONCLUSION
A software tool was developed and evaluated for AGD management in digital mammography. This tool was successfully used for the retrieval and analysis of the dosimetric parameters of patients imaged at our institution. The procedure was fast and mostly automatic and enabled us to analyze the dose to our patient population and compare it with previously published dose surveys.
A weak correlation was found between breast thickness and AGD when using AEC in our system. Future work could include a thorough investigation that includes more patients and other mammography units, thus enabling the optimization of dose and image quality across institutions.
REFERENCES
[1] WHO - World Health Organisation. WHO Breast cancer: prevention and control. Available at: <http://www.who.int/topics/cancer/breastcancer/es/index3.html>. Last accessed: 23 Aug. 2017.
[2] infoLEG – Información Legislativa- Ministerio de Justicia y Derechos Humanos-
Presidencia de la Nación. Argentina: Ministerio de salud - Resolución 1813/2013.
Available at:
<http://servicios.infoleg.gob.ar/infolegInternet/anexos/220000-224999/221755/norma.htm>. Last accessed: 28 Jun. 2018
[3] GE Healthacare. USA. 2015. Available at: <http://www3.gehealthcare.com/en/products/dose_management/dosewatch>. Last accessed: 20 Dec. 2017.
[4] Siemens Healthineers. Germany. 2017.Available at: <https://www.healthcare.siemens.com/medical-imaging/low-dose>. Last accessed: 20 Dec. 2017.
[5] EFOMP - European Federation of Organisations for Medical Physics. Mammo Protocol.
EFOMP Mammo working group protocol, London:EFOMP, 2015. 223p.
[6] DANCE, D. Monte-Carlo calculation of conversion factors for the estimation of mean glandular breast dose. Phys. Med.Biol, v. 35 , p.1211-1219, 1990.
[7] dcm4chee.org - Open Source Clinical Image and Object Management. Available at: <http://www.dcm4che.org/>. Last accessed: 02 May. 2017
[8] American Cancer Society. Available at: < https://www.cancer.org/es/cancer/cancer-de- seno/pruebas-de-deteccion-y-deteccion-temprana-del-cancer-de-seno/mamogramas/la-densidad-de-los-senos-y-el-informe-de-su-mamograma.html>. Last accessed: 30 Jul. 2018.
[9] HAUGE, I.; BREDHOLT, K. AND OLERUD, H. NEW diagnostic reference level for full-field digital mammography units. Radiat. Prot.Dosimetry, v. 157, p.181-192, 2013.
[10] SULEIMAN, M.; MCENTE, M.; et al. Diagnostic reference levels for digital mammography in New South Wales. Journal of Medical Imaging and Radiation
Oncology, v. 61, p. 48-57, 2017.
[11] SULEIMAN, M.; PATRICK, C.; ERNEST, E.; PETER, K.; AND MARK, F. Integrating mammographic breast density in glandular dose calculation. Br J Radiol, v.91, 2018.