Prevalence rates of hypertensive and obese children in a public
elementary school in southern Minas Gerais State, Brazil
Nádia Bonfilio LIMA1 Márcia Maria MASSAFERA1 Rudy BONFILIO1* Sueli Leiko Takamatsu GOYATÁ2 Márcia Helena Miranda Cardoso PODESTÁ1 Olinda Maria Gomes da Costa VILAS BOAS1 Eric Batista FERREIRA3 Walnéia Aparecida de SOUZA1
ABSTRACT: Many studies have disclosed that high blood pressure in adults is a disease that starts in childhood. The aim of this study was to perform a survey about the prevalence rates of hypertensive and obese children in at a public elementary school in southern Minas Gerais, as well as to verify the correlation between weight alterations and blood pressure. We evaluated 274 children, from both genders, aged between 6 and 13, from October until December 2009. This study identified 7.3% prevalence of hypertension among the evaluated children. Furthermore, it found a high percentage of obese individuals (16.4% overweight and 12.8% obese). Besides, the study showed a statistical tendency of increasing blood pressure levels due to increase in the BMI. These results show the importance of precocious diagnosis of hypertension and the need of obesity prevention, and they remark the necessity of changes in the present health care system for obtaining treatment turned to chronic conditions.
KEY WORDS: Children’s health. Body mass index. Hypertension. Overweight. Prevalence.
1Faculty of Pharmaceutical Sciences, Federal University of Alfenas, Street Gabriel Monteiro da Silva, 700, 37130-000, Alfenas-MG, Brasil.
2
Faculty of Nursing, Federal University of Alfenas, Street Gabriel Monteiro da Silva, 700, 37130-000, Alfenas-MG, Brasil.
3
Institute of Exact Sciences, Federal University of Alfenas, Street Gabriel Monteiro da Silva, 700, 37130-000, Alfenas-MG, Brazil.
*corresponding Author: Walnéia Aparecida de Souza
Federal University of Alfenas, Street Gabriel Monteiro da Silva, 700, 37130-000, Alfenas-MG, Brasil. Phone: (35) 32991341 Fax: (35) 32991350
E-mail: walne23@yahoo.com.br
INTRODUCTION
According to the World Health Organization (WHO), the Brazilian epidemiologic scenery presents a transition. Infectious diseases responded
for 46% of the death rate in 1930, but in 2003, they were responsible for just 5%
mortality, giving room for
cardiovascular diseases, cancer, accidents and violence. It is believed that until 2020, chronic conditions will doi: http://dx.doi.org/10.5892/ruvrv.2012.101.124136
be responsible for 60% of the global disease rate in the developing countries (MINISTÉRIO DA SAÚDE, 2003).
Among the chronic conditions, hypertension (high blood pressure [BP]) is the most common and is associated to morbidity and mortality, with growing costs. High BP increases social health costs, mainly because of its
complications, such as the
cerebrovascular disease, coronary heart disease, peripheral artery disease, besides chronic renal insufficiency (BISSON, 2007), which makes it a grievance of great magnitude concerning social, economic and life
quality terms
(KEARNEY; WHELTON; REYNOLD, 2005).
In Brazil, approximately 65% of the elderly population suffer from systemic blood hypertension, such that, among women aged above 65 this prevalence may reach 80%. Kearney et
al. (2005) estimated that the
hypertension rate in the adult population worldwide was 26% in 2005, and that by 2025 this rate will increase 24% in developed countries, and 80% in developing countries (ALMEIDA;
D’ÁVILA; CADAVAL, 2002;
MOURA; SILVA; FERRAZ, 2004). Therefore this shows high prevalence of hypertension in the
Brazilian adult population. However, we cannot undervalue the fact that there are between 2% and 13% of children and teenagers with high BP according to data from international studies, or 6 to 8% in Brazilian epidemiologic studies (SALGADO; CARVALHAES, 2003).
Many studies have revealed strong evidence that the hypertension in adults is a condition initiated in childhood, which has increased the concern in evaluating the blood pressure in children in the last decades
(GUARCIA; TERRA; QUEIROZ,
2004). But, just in the last 25 years, hypertension has received the proper attention from pediatricians (LUCAS, 2002), being recognized as an important component in the pediatric routine (FALKNER et al., 2004).
This new paradigm of
understanding hypertension in pediatric age range highlights the need of incorporating this measure as part of the child’s physical exam, as well as the publication of rules for evaluation in childhood, enabling the detection of not
just asymptomatic secondary
hypertension, previously undetected, but also discreet blood pressure heights (SALGADO; CARVALHAES, 2003). Besides, it is acknowledged that obesity, sedentary lifestyle, and
excessive ingestion of salt increase the rate of hypertension in children and teenagers (LUCAS, 2002).
In spite of the evident importance of detecting the prevalence of hypertension in children, few scientific studies about this subject are found in literature. Therefore, this article has the objective of performing a survey about the rate of hypertensive and obese children within a population of theoretically healthy children, because if the diagnosis is not performed in this age group, the opportunity of starting guidance, causal investigation and precocious treatment, which may prevent greater damage in adulthood, will be lost.
MATERIALS AND METHODS
Localization and studied population
The present study took place at the Public Elementary School Dr. Lélio de Almeida, in Poço Fundo, MG, during October through December 2009. The sample was composed by 274 children of both genders, aged between 16 and 13. The age was recorded in completed years.
Selective Criteria
All students enrolled at the Fundamental State School Dr. Lélio de Almeida, who agreed to participate in the research, were included in this study.
Blood Pressure measurements
Blood pressure (BP)
measurements were taken using a
mercury sphygmomanometer as
recommended by The Fourth Report on the diagnosis, evaluation and treatment of high blood pressure in children and adolescents (FALKNER et al., 2004). The measurements were taken in a quiet room in the sitting posture with the arm resting on the table. Efforts were made to eliminate the factors which may affect the blood pressure, e.g., anxiety, crying, exercise, etc. The average of two consecutive readings was taken as the blood pressure of the child, maintaining an interval of 2 minutes. Average systolic or diastolic BP >95th percentile for gender, age and height was considered as hypertension. Pre-hypertension was defined as average systolic BP or diastolic BP that was >90th (FALKNER et al., 2004).
Anthropometric data analysis
Anthropometric data (height and weight) were collected. Children with a body mass index (BMI) >85th percentile of reference data were considered overweight and those with a BMI >95th percentile were considered obese. The reference data used to identify the cut-off points were taken from the Centers for Disease Control and Prevention, National Center for Health Statistics (CDC, 2002) dataset for BMI.
Ethical aspects
The research project and the consent term follow the determinations of the resolution 196/96 from the
National Health Council and
complementary rules, and were previously approved by the Committee for Ethics in Research from the Federal University of Alfenas-MG, protocol number 066/2010.
Statistical Analysis
Blood pressure and BMI rates and their intervals were calculated, according to age and gender, under 95% of confidence. The associations of blood pressure between genders, as well
as between the blood pressure and the BMI were verified buy the exact Fisher's test. For comparing the BMI between genders, and hypertension plus BMI between genders, the Student’s t-test was used. The comparison of Hypertension/BMI to gender, and
between the mean BMIs, was
performed using Kuskal-Wallis test. The data were processed and analyzed with the use of the software R (R
DEVELOPMENT CORE TEAM,
2012). The level of significance adopted was 5%.
RESULTS
Blood pressure analysis in elementary school children
We evaluated 274 students from both genders, aged between 6 and 13. Firstly, the stature percentiles were obtained, according to each gender. From these values, the blood pressure percentiles were obtained. The data from the blood pressure percentiles were, then, used for classifying the students as normotensive, pre-hypertension or stage 1 and stage 2 hypertension. The results are presented in table 1.
Table 1- Blood pressure of students from public school Blood Pressure nº % CI 95% Normotensive 218 79.6 [74.2; 84.0] pre-hypertension 36 13.1 [9.5; 17.9] BH – I 14 5.1 [2.9; 8.6] BH- II 06 2.2 [0.9; 4.9] Total 274 100
BH I – stage 1 hypertension; BH II - stage 2 hypertension; CI95%- confidence interval (CI); nº- absolute number of students;
% - students percentage.
Through the analysis of the 274 students, we verified that 7.3% (n=20) have presented high BP. The detection
of high BP, reported here,
comprehended the stage 1 hypertensive students as well as the stage 2 ones.
Blood pressure analysis by gender
Among the 274 students
evaluated, 52.9% were males and 47.1% were females. We remarked that 13 (9%) boys and 7 (5.4%) girls presented high blood pressure. These data may be checked on table 2.
Table 2- Distribution of blood pressure by gender in students from the public school
BP M % CI 95% F % CI 95% Normotensive 111 76.5 [68.6; 83.0] 107 82.9 [75.1; 88.8] Borderline 21 14.5 [9.4; 21.5] 15 15.7 [6.9; 18.8] BH-I 10 6.9 [3.5; 12.6] 04 3.1 [1.0; 8.2] BH-2 03 2.1 [0.54; 6.4] 03 2.3 [0.6; 7.2] Total 145 129
BP – Blood pressure; M- males; F- females; BH I - stage I hypertension; HA II – Hypertension stage II; CI 95% - Confidence interval
When comparing the systolic and the diastolic pressure between the genders, in all kinds of blood pressure, it was observed that there was no significant statistical difference by the variance analysis.
Body Mass Index analysis
Regarding the BMI analysis, 16.4% of the students were considered overweight and 12.8% obese. The data are presented on Table 3.
Table 3. Distribution of the students’ BMI at the public school.
BMI Number of Students % CI 95% Normal 191 69.7 [63; 75] Overweight 45 16.4 [10; 19] Obese 35 12.8 [11; 20] Low weight 03 1.1 [0.3; 3.4] Total 274 100
BMI- Body Mass Index; CI (Confidence Interval) 95%.
By means of the BMI analysis in each gender, it was found that 17.2% of Group of the boys were overweight and 13.1% were obese, while in the girls group 15.5% were overweight and 12.4% were obese. These results are presented on Table 4.
The mean BMIs were compared between the genders by the Kruskal-Wallis test, and we verified that there was no statistical difference among the mean BMIs (low weight, normal weight and obese). But in relation to the overweight subjects, the value of “p” was 0.02, showing a significant difference between genders. These data are presented in Table 4.
Table 4- Distribution of the students’ BMI by gender, at the public school
BMI M % CI 95% F % CI 95% p Normal 100 69.0 [61.3; 76.7] 91 70.5 [65.3; 80.5] 0.95 Overweight* 25 17.2 [8.1; 19.6] 20 15.5 [9.2; 21.4] 0.02 Obese 19 13.1 [11.4; 24.1] 16 12.4 [6.9; 18.2] 0.59 Low weight 01 0.7 [0.04; 4.3] 02 1.6 [0.04; 4.5] 1.0 Total 145 129
BMI- Body Mass Index; M- males; CI (Confidence Interval) 95%; F-females; *p<0.05 – considered significant.
Analysis of the relation between Blood Pressure and the BMI
When comparing the hypertension and the BMI, we may see that the blood pressure depended on the BMI
(p=0.0093), according to exact Fisher’s test. This means that, with the BMI increase, there is a tendency in increasing the blood pressure. The comparisons are presented on Table 5.
Table 5- Relation between the Blood pressure and BMI from a the public school Normal pre-hypertension BH I BH II Total BMI/BP Number of students % Number of students % Number of students % Number of student % Low weight 3 1,1 0 0 0 0 0 0 3 Normal 158 57.7 25 9.1 7 2.6 1 0.4 191 Overweigh 30 10.9 7 2.6 1 0.4 1 0.4 39 Obesity 27 9.9 4 1.5 6 2.2 4 1.5 41 Total 218 36 14 6 274
BMI- Body Mass Index; BP – Blood Pressure ; BH I – Hypertension level I; HA II - Hypertension level II After comparing the blood
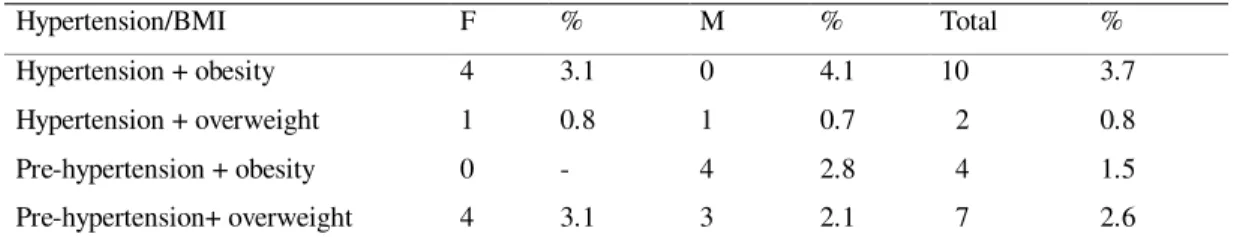
pressure/BMI between genders, we see that this relation was not dependent on the sex (p=0.28) according to exact Fisher’s test. The relation between the blood pressure data and the BMI data by gender are verifiable in Table 6.
When comparing the hypertension and the BMI between males and females, there was no significant statistical difference (p=0.426), according to the Student’s t-test.
Table 6- Relation between Blood Hypertension/ BMI and gender in students from the public school
Hypertension/BMI F % M % Total %
Hypertension + obesity 4 3.1 0 4.1 10 3.7
Hypertension + overweight 1 0.8 1 0.7 2 0.8
Pre-hypertension + obesity 0 - 4 2.8 4 1.5
Pre-hypertension+ overweight 4 3.1 3 2.1 7 2.6
BMI – Body Mass Index; F-females; M-males.
DISCUSSION
The early diagnosis of blood pressure and the proper continuous treatment are fundamental for its control, avoiding late complications.
However, it is in the primary prevention that a more effective way to combat this condition is found, reducing the high cost of the treatment and its complications (ALMEIDA et al., 2002).
In this survey, 7.3% of the studied students presented arterial hypertension, without any statistical difference between males and females. Almeida et
al.(2002)found 15% prevalence of high
blood pressure in 542 students aged 17 in average, in the interior of S. Paulo State. Silva and Junior (2007) reported 7.4% hypertension in 674 teenagers aged from 14 to 17, in public and private schools, in João Pessoa, Paraíba (Brazil) Pina and Manetti (2009) noted 9.5% hypertensive subjects in 148 scholars aged between 6 and 11, from a fundamental public school northeast of São Paulo (Brazil) state. In a recent study, Pinto et al. (2011) found 4.8% hypertension in a group of 1131 children and teenagers, from both genders, aged between 7 and 14, enrolled in public schools (58 municipal, 27 state owned) from Salvador Bahia Brazil.
There are studies in the literature with similar results to those we met. However, there is a great variation among the overall results of the works described.
This variation may be due to several factors that interfere in the comparison of results, such as: the population used; the methodology employed in each study; the age range
observed; the number of visits; the number of blood pressure assessments in each visit; the assessment methodology; time lapse between assessments.
Nevertheless, the high BP rate in the population of this study is within the national and international variation (between 1% and 13%), according to data from Salgado and Carvalhaes (2003).
In this study, it is relevant to observe that the measurements were taken in a single visit. It is known that higher rates may be found in studies based on single visits (OLIVEIRA et
al., 1999). When the blood pressure is
measured several times, as
recommended for blood pressure diagnosis, the rate tends to fall because of the phenomenon of regression to the average, besides the child gets used to the measurement procedure and becomes calmer. Then, the occurring hypertension rate, in childhood, drops significantly to 1% (KAY; SANAIKO; STEPHEN, 2001). Therefore, it is necessary to follow up the population studied in this research, performing new assessments in different occasions, in order to comply with the diagnose criteria presently advocated.
The results found in this study call the attention to the lack of early blood
hypertension diagnosis, because, in Brazil, the projects for primary prevention against hypertension (ALMEIDA et al., 2002) are scarce. This fact is probably due to the current trend in the public healthcare service which is turned to care for the acute cases.
The importance of diagnosing and following up hypertensive children and teenagers, highlighted in this study, is reinforced by the fact that many studies have revealed strong evidence that the systemic arterial hypertension (SAH) in adulthood is a condition initiated in childhood, which has increased the concern with the evaluation of blood pressure in children for the last decades (MOURA; SILVA; FERRAZ, 2004).
Besides, the results demonstrated in this study are in line with the observations by Almeida et al. (2002), who declared that actions in the health area, including those related to cardiovascular problems, should be taken with the students still in fundamental school. These actions which involve clarifying educators and relatives about the importance of changes in lifestyle, which would certainly benefit children in what concerns the prevention and treatment of AH.
Discussing the BMI analysis, 16.4% of the subjects were overweight and 12.8% presented obesity, although there wasn’t statistical difference between the males’ and females’ BMIs, either underweight, normal weight, or obese. But reporting to the overweight students, the males’ group got the highest statistical mean. Balaban and Silva (2001) found overweight and obesity rates of 26.2% and 8.5% in respectively 332 infants and 430 teenagers (762 students) from an upper/middle class school in Recife, in 1999. Silva et al. (2003) reported rates of 22.6% overweight and 11.3% obesity in 250 infants with ages between two and five, in two privately owned schools, in Recife, PE, Brazil. Netto-Oliveira et al. (2010) found 13.8% overweight and 8.3% obesity in 1,634 children from 6.0 to 7.9 years old in 24 schools (17 public, 7 privately owned), from the city of Maringa/PR (Brazil). According to data from Brazilian Institute of Geography and Statistics (2006), the Brazilian overweight and obesity rates in children and teenagers were respectively 12.3% and 2.3% in 2002-2003.
The results of this study, comparing to results described in literature, show differences between overweight and obesity rates, which
may be justified by several factors such as: population subject of the study; age range observed; social-economic characteristics of each group; etc. However, upon analyzing this study’s data and those of latest studies, high overweight and obesity rates were noticed, which shows a tendency to increase the number of children assailed by these risk factors.
Referring to gender, some authors describe overweight and obesity rates in females among teenagers (MOKHTAR
et al., 2001), but the opposite (as
observed in this research) is also described (BALABAN; SILVA, 2001). The importance of high rates of overweight and obesity obtained by this study is based in the occurrence of excess body fat which may predispose individuals to morbidities such as dyslipidemia, liver diseases, osteoarthritis, and sleep apnea
(CRESPO; ARBESMAN, 2003;
SILVA et al., 2005). Therefore, obesity may be considered as a double-problematic condition for the organism, since it is a disease by itself, as well as a risk factor for other diseases (FERREIRA; AYDOS, 2010).
However, the cardiovascular condition is among the most concerning comorbidities associated to obesity, once it is responsible for high mortality
rate countries with differing social-economic situations (FRANCISCHI et
al., 2000). According to several surveys
that compare overweight children and teenagers to normal weight children and teenagers, the risk of developing hypertension increases 180% in the overweight groups (ARAUJO et al.,
2008; SANTOS; TENÓRIO;
KANASHIRO, 2010). Obesity accounts for a growing health problem in the world pediatric population. With the increasing rates of obese Brazilian children, it is foreseen, among other complications, the increase of arterial hypertension (SANTOS et al., 2003).
These facts are confirmed by the results obtained in this study, in which is detected a statistical trend to increase blood pressure as BMI increases, without any significant difference between males and females for this trend. In a similar way to these results, other studies published point out the prevalence of AH in obese and overweight children and teenagers ( MOURA; SILVA; FERRAZ, 2004; ZANOTI; PINA; MANETTI, 2009; CHU; PAN, 2007).
This correlation between BMI and AH is of utmost importance, because it may be detected in childhood and has great clinical relevance due to the association with asymptomatic
conditions, such as dyslipidemia,
diabetes mellitus type II and the insulin
resistance syndrome (BARTOSH; ARONSON, 1999).
The results of this study show the importance of the early diagnosis of blood pressure alterations, and the need to prevent obesity, by means of clarifying educators and relatives, by programming physical exercises and through dietetic education.
Besides, through the results obtained in this study, the authors call the attention to the necessity of changes in the present healthcare network, towards an attention turned to chronic conditions.
CONCLUSION
The results of the present study show the importance of the early diagnosis of blood pressure alterations and the need of obesity prevention, and highlight the lack of changes in the present healthcare network, for an attention turned towards chronic conditions.
AKNOWLEDGEMENTS
Federal University of Alfenas (Unifal-MG), for the support given to our projects.
REFERENCES
1. ALMEIDA, F.A. de; D’ÁVILA, R.D.; CADAVAL, R.A.M. et al. Prevenção primária e detecção precoce da hipertensão arterial em escolas do ensino médio. Projeto comunitário envolvendo estudantes de medicina. Rev. Bras. Educ. Med,. v.26, n.2, p. 88-93, 2002. 2. ARAÚJO, T.L. de; LOPES,
M.V.O.; CAVALCANTE, T.F. et
al. Análise de indicadores de risco
para hipertensão arterial em crianças e adolescentes. Rev. Esc. Enferm. USP, v.42, n.1, p.120-126, 2008. 3. BALABAN, G.; SILVA, G.A.P.
Prevalência de sobrepeso e obesidade em crianças e
adolescentes de uma escola da rede privada de Recife. J. Pediatr., v.77, n.2, p.96-100, 2001.
4. BARTOSH, S.M.; ARONSON, A.J. Childhood hypertension: an update on etiology, diagnosis and
treatment. Pediatr. Clin. North Am., v.56, n.2, p.235-252, 1999. 5. BISSON, M.P. Farmácia clínica e
atenção farmacêutica. 2. ed. São Paulo: Editora Manole, 2007. 371p. 6. CDC Growth Charts for the
United States: methods and development. (DHHS publication ; no. (PHS) 2002-1696). (Vital and health statistics. Series 11, Data from the National Health Survey; n. 246). May 2002 7. CHOBANIAN, A.V.; BAKRIS,
G.L.; BLACK, H,R. et al. The seventh report of the joint national committee on prevention, detection, evaluation, and treatment of high blood pressure: The JNC 7 Report.
J. Am. Med. Assoc., v.289, n.19, p.2560-2571, 2003.
8. CHU, N.F.; PAN, W.H. Prevalence of obesity and its comorbidities among schoolchildren in Taiwan. Asia Pac. J. Clin. Nutr., v.12, Suppl 2, p.601-607, 2007. 9. CRESPO, C.J.; ARBESMAN, J.
Obesity in the United States: a worrisome epidemic. Phys Sportsmed, v.31, n.11, p23-28, 2003.
10. FALKNER, B.; DANIELS, S.R.; FLYNN, J.T. et al. The Fourth Report on the Diagnosis, Evaluation, and Treatment of High Blood Pressure in Children and Adolescents. Pediatrics, v.114, n.2, p.555-576, 2004.
11. FERREIRA, J.S.; AYDOS, R.D. Prevalência da hipertensão arterial em crianças e adolescentes obesos. Ciênc. Saúde Coletiva, v.15, n.1, p. 97-104, 2010.
12. FRANCISCHI, R.P.P. de;
PEREIRA, L.O.; FREITAS, C.S. et
al. Obesidade: atualização sobre
sua etiologia, morbidade e tratamento. Rev. Nutr., v.13, n.1, p.17-20, 2000.
13. GARCIA, F.D.; TERRA, A.F.; QUEIROZ, A.M. et al. Avaliação de fatores de risco associados com elevação da pressão arterial em crianças.J. Pediatr., v.80, n.1, p.29-34, 2004. 14. INSTITUTO BRASILEIRO DE GEOGRAFIA E ESTATÍSTICA, 2006. Pesquisa de Orçamentos Familiares/2002-2003.
Antropometria e análise do estado nutricional de crianças e adolescentes no Brasil. http://www.ibge.gov.br/home/estatis tica/populacao/condicaodevida/pof/ 2003medidas/pof2003medidas.pdf (acessado em 15/Dez/2011). 15. KAY, J.D.; SANAIKO, A.E.;
STEPHEN, R.D. Pediatric
hypertension. Am. Heart J., v.142, n.2, p. 422-432, 2001.
16. KEARNEY, P.M.; WHELTON, M.; REYNOLDS, K. et al. Global burden of hypertension: analysis of worldwide data. Lancet, v.365, n.9455, p.217–223, 2005. 17. LUCAS, B. Nutrição na Infância.
In: MAHAN, L. K, ESCOTT-STUMP, S. Alimentos, Nutrição & Dietoterapia. 10ª ed. São Paulo: Roca, 2002. Capítulo 10. 229-246. 18. LYRA Jr., D,P. de; AMARAL,
R.T. da; VEIGA, E.V. et al. A farmacoterapia no idoso: revisão sobre a abordagem multiprofissional no controle da hipertensão arterial sistêmica. Rev. Latino-Am. Enfermagem, v.14, n.33, p.435-441, 2006.
19. MINISTÉRIO DA SAÚDE, 2006. Secretaria de Estado de Saúde de Minas Gerais. Atenção à Saúde do Adolescente. 1 ed. Belo Horizonte. http://www.saude.mg.gov.br/publica coes/linha-guia/linhas-
guia/LinhaGuiaSaudeAdolescente.p df (acessado em 15/Dez/2011). 20. MOKHTAR, N.; ELATI,
J.; CHABIR, R. et al. Diet culture and obesity in northern Africa. J Nutr, v.131, Suppl 3, p.887-892, 2001.
21. MOURA, A.A.; SILVA, M.A.M.; FERRAZ, M.R.M.T. Prevalência de pressão arterial elevada em
J. Pediatr., v.80, n.1, p.35-40, 2004.
22. NETTO-OLIVEIRA, E.R.
Sobrepeso e obesidade em crianças de diferentes níveis econômicos. Rev. Bras. Cineantropom.
Desempenho Hum., v.12, n.2, p.83-89, 2010.
23. OLIVEIRA, R.G.; LAMOUNIER, J.A.; OLIVEIRA. A.D.B. et al. Pressão arterial em escolares e adolescentes: o estudo de Belo Horizonte. J. Pediatr., v.75, n.4, p.256-266, 1999.
24. PINTO, S.L.; SILVA, R.C.R.; PRIORE, S.E. et al. Prevalência de pré-hipertensão e de hipertensão arterial e avaliação de fatores associados em crianças e adolescentes de escolas públicas de Salvador, Bahia, Brasil. Cad. Saúde Pública, v.27, n.6, p.1065-1076, 2011.
25. R DEVELOPMENT CORE TEAM. R: A language and environment for statistical computing. Version 2.15.0. Vienna: R Foundation for Statistical Computing; 2012. 26. SALGADO, C.M.;
CARVALHAES, J.A.T.
Hipertensão arterial na infância. J. Pediatr., v.70, Suppl 1, p.115-124, 2003.
27. SANTOS, A.A.C. dos; ZANETTA, D.M.T.; CIPULLO, J.P. et al. O diagnóstico da Hipertensão Arterial na Criança e no Adolescente. Rev. Paul. Pediatr., v.25, n.4, p.174-183, 2003.
28. SANTOS, V.M.A.B.; TENÓRIO, C.M.; KANASHIRO, C.A. Hipertensão arterial em crianças e
adolescentes. Olhares Plurais, v.2, n.3, p.70-75, 2010.
29. SILVA, G.A.P. da; BALABAN, G.; FREITAS, M.M.V. et al.
Prevalência de sobrepeso e
obesidade em crianças pré-escolares matriculadas em duas escolas particulares de Recife, Pernambuco. Rev. Bras. Saúde Matern. Infant., v.3, n.3, p.323-327, 2003.
30. SILVA, K.S.; JÚNIOR, J.C.F. Fatores de risco associados à pressão arterial elevada em adolescentes. Rev. Bras. Med. Esporte, v.13, n.4, p.237-240, 2007. 31. SILVA, M.A.M. da; RIVERA,
I.R.; FERRAZ, M.R.M.T. et al. Prevalência de fatores de risco cardiovascular em crianças e adolescentes da Rede de Ensino da cidade de Maceió. Arq. Bras. Cardiol., v.84, n.5, p.387-392, 2005. 32. TU, K.; CHEN, Z.; LIPSCOMBE,
L.L. Prevalence and incidence of hypertension from 1995 to 2005: a population-based study. Can. Med. Assoc. J. , v.178, n.11, p.1429-1435, 2008.
33. WENDHAUSEN, A.L.P.;
REBELLO, B.C. As concepções de saúde-doença de portadores de hipertensão arterial. Ciênc. Cuid. Saúde, v.3, n.3, p.243-251, 2004. 34. ZANOTI, M.D.U.; PINA, J.C.;
MANETTI. M.L. Correlação entre pressão arterial e peso em crianças e adolescentes de uma escola
municipal do noroeste paulista. Rev. Enferm., v.13, n.4, p.879-885, 2009.