BJRS
RADIATION SCIENCES
07-2A (2019) 01-14ISSN: 2319-0612 Accepted: 2018-10-27
Use of the neutron activation analysis, k
0-standardized
method, in the evaluation of the air quality in critical
points of Belo Horizonte
Moura, I. F. S.
a; Cruz, A. B.
b; Cesar, R. H. S.
b; Oliveira, A. F. G.
b; Barreto, A. A.
b;
Menezes, M. A. B. C.
a,ba Universidade Federal de Minas Gerais, Departamento de Engenharia Nuclear (DEN), PCTN – Programa de
Pós-Graduação em Ciências e Técnicas Nucleares, Av. Presidente Antônio Carlos nº 6627 – Pampulha 31270-901 Belo Horizonte – MG, Brazil
igorfelipedx@ufmg.br
b Centro de Desenvolvimento da Tecnologia Nuclear (CDTN/CNEN), Divisão de Meio Ambiente
abc@cdtn.br; raisa.santana@hotmail.com; aab@cdtn.br; menezes@cdtn.br
ABSTRACT
Belo Horizonte, the capital of Minas Gerais, is one of the largest cities in Brazil. It is geographically centered on a region with intense mining and industrial activity and a fleet of more than 1.5 million vehicles. The numerous sources of atmospheric emissions of particulate matter in this capital and its vicinity offer a considerable risk to the degradation of air quality. In order to contribute with elemental composition of particulate matter, the Nuclear Technology Development Center / Brazilian Commission for Nuclear Energy, and the Department of Nuclear Engineering of the Federal University of Minas Gerais has developed a research based on environmental samples. This work aims to present the sampling methodology, the concentration values of sampled particulate matter preliminarily, the methodology of analysis of elemental concentration using the nuclear technique of neutron activation analysis, k0-standardized method, and interpreted through statistical techniques and values of the elemental concentrations more representative of the samplings carried out. The results pointed out the
vehicle emissions as the major source that contributes to airborne particulate matter followed by soil resuspension.
Keywords: k0-Neutron Activation Analysis, Air Filter, Air Quality.
1. MATERIALS AND METHODS
Belo Horizonte is one of the largest cities in Brazil, located in a mining region in the center of the state of Minas Gerais. In this city there are several and diversified industrial activities pointing out the strong consumer market. According to the Brazilian Institute of Geography and Statistics (IBGE) [1] the population in the year 2016 was about 2,513,451 inhabitants, with a total fleet of 1,714,233 vehicles, which implies an intense traffic of motor vehicles.
Atmospheric pollutants are defined by the National Council for the Environment (CONAMA) [2] as any form of matter that in quantity, concentration, time or characteristics in disagreement with air quality standards, which detract from health, safety and well-being of the population. They may cause environmental and material damage.
Particulate matter (PM) is any substance in the solid or liquid form present in the atmosphere, forming one of the major environmental risk factors. It is composed by organic and inorganic substances that have a microscopic size but larger dimensions than the molecular structures [3]–[5].
The size of the PM is inversely proportional to the damage caused by the particles, because it can easily be transported to the respiratory system where it can cause perceptible damages to health. It will be worse with the occurrence of PM deposition in the pulmonary alveoli with a long term of exposure [6]–[8].
In order to adequately monitor airborne particulate matter, the collection of 2 and 10 micrometers sizes is needed. Currently, most of the environmental monitoring and control systems in Brazil are based on sampling of PM with 10 micrometers, PM10 [9].
This work presents a statistical modeling constructed basing on data of concentration of PM10 and the elemental concentrations obtained through the analysis by neutron activation, k0 standardized method. This study was carried out in the city of Belo Horizonte in places with a large
vehicular flow. The objective was to make an assessment of the air quality of Belo Horizonte and point out the possible sources of pollutants.
2. MATERIALS AND METHODS
2.1. Sampling Sites
The sampling sites were selected in Belo Horizonte taking into account the population density, an important factor for the monitoring of air quality. This air quality affects large part of the population, especially those people with greater sensitivity. The proximity to the polluting sources was another factor that was considered, because they emit the particulates in the atmosphere. According to Tavares [10], the main contributor to PM emission in Belo Horizonte are the vehicular emissions. Then, the sampling points where near high population density and close to avenues with high flow of vehicles.
The air quality monitoring was performed preliminarily in the period between September and December 2014. The sampling points are shown in the map of Belo Horizonte, Fig. 1. One was in the main entrance of the UFMG (Federal University of Minas Gerais) Campus; other was in front of CEFET-MG (Federal Center for Technological Education of Minas Gerais) and other in an urban bus garage.
Figure 1: Monitoring sites in Belo Horizonte.
Source: Author
2.2. Sampling air particulate matter, PM
10Each sampling lasted 24 hours, fifteen samples were collected during the period, six samples were collected in UFMG, six samples (CEFET - MG) and three in the urban bus garage.
A Large Volume Sampler with inertial separator was used to collect the concentration of PM10, with a flow of 1.13 m3min-1 and a deviation of less than 1% in 24 hours of monitoring [11].
2.3. Gravimetric analysis of particulate matter
Before and after sampling, the air filter, glass fiber filter, was heated in a muffle at 400 °C for a period of 4 hours to remove organic compounds and moisture [12]. After the thermal treatment, the gravimetric analysis was performed with a precision balance, which is the difference between the final and initial weight, taking the difference as mass corresponding to PM deposited in the sampling period.
The particulate material was deposited on a glass fiber filter, model GFA8X10IN. Subsequently, the PM concentration was calculated through the equations presented in the sampler manual, which takes into account the mass difference between the "white" filter and the sampled, in addition to the airflow data provided by the equipment.
2.4. Elemental analysis of particulate matter
The technique of neutron activation, k0 standardized method [13], [14], was applied to the samples of airborne particulate matter in air filters, at CDTN/CNEN, using the TRIGA MARK I IPR-RI nuclear reactor, 100 kW, average thermal neutron flux of 6.35x 1011cm-2s-1 [14].
For the analysis, a 45 cm2 aliquot of each sampled filter and "white" filters were removed and then packed in polyethylene vials. The vials were irradiated for 8 hours together with neutron flux monitors (Al-Au, 0.1% alloy discs). After the decay time of the interfering radionuclides, medium half-life (6 hours to 3 days) and long half-life (over 10 days) radionuclides were measured by gamma spectrometry. The spectrometry gamma system consists of a detector HPGe with relative efficiency of 50% and resolution of 1.85 keV for the energy of 1332 keV of 60Co, program Genie 2000, CANBERRA for the acquisition of the gamma spectra and associated electronics. For the analyses of the spectra it was used the software HyperLab [15] and for the calculation of the elemental concentrations, the package software KayWin [16] was used.
2.5. Statistical analysis
Cluster Analysis is a multivariate statistical technique for exploratory data analysis used in engineering, biology, social sciences, etc [17]–[20]. This statistical technique is known as Cluster analysis or groupings, which allows groups to be created based on the similarity between the studied variables [21]. This tool is used to classify the variables into groups in degrees of association, keeping the data strongly linked in the same cluster and in a weaker way in data belonging to other clusters [22]. Minitab software was used to perform Cluster Analysis.
2.6. Quality control of the neutron activation analysis, k
0-method
In order to verify the analytical performance of the k0-method, the "En-number" calculation, according to ISO 13538: 2005, was applied with the experimental values and certified values of the
reference sample BCR 176 "City Incineration Ash". The En considers the expanded uncertainty of the experimental analysis and the certified values with a coverage factor k = 2 (95% confidence interval). To evaluate the results, the evaluation criterion is |En| ≤ 1, that means that the method performance was satisfactory.
3. RESULTS AND DISCUSSION
The PM10 airborne particulate matter concentration results refer to samples taken at different points in Belo Horizonte and the they are presented in Table 1. The values are compared to the air quality standards of the United States Environmental Protection Agency (US-EPA) [23].
Table 1: Concentration of the air particulate matter preset in the air filters. Site Date *Concentration (µg.m-3)
*Standards of Quality of the Air
[23]
CEFET-MG 22th, Sept, 2014 52.28 Moderate
CEFET-MG 23th, Sept., 2014 40.81 Good
CEFET-MG 24th, Sept., 2014 58.03 Moderate
CEFET-MG 25th, Sept., 2014 64.93 Moderate
UFMG 7th, Oct., 2014 56.84 Moderate
UFMG 8th, Oct., 2014 57.88 Moderate
UFMG 9th, Oct., 2014 61.89 Moderate
UFMG 25th, Nov., 2014 35.43 Good
UFMG 26th, Nov., 2014 68.33 Moderate
UFMG 27th, Nov., 2014 54,08 Moderate
Bus Garage 15th, Dec., 2014 27.71 Good
Bus Garage 16th, Dec., 2014 31.28 Good
Bus Garage 17th, Dec., 2014 59.87 Moderate
*Standards of Quality of the Air: Good Quality < 50 μg.m-3; Moderate is between 51 and 100 μg.m-3; Unhealthy for
Sensitive Groups between 101 and 150 μg.m-3; Unhealthy between 151 and 200 μ.m-3; Very Unhealthy between 201 and 300 μg.m-3, and above 301 μg.m-3 is assessed as Hazardous.
Table 2 shows the En-number values calculated to evaluate the performance of the k0-method applied to certified reference material. It is possible to observe that all En-number values are < 1, meaning that all results are within 95% confidence interval.
Table 2: Experimental results, certificate values and statistical evaluation (En-number).
Element BCR 176 En-number
Experimental Result (mg kg-1) Certificate Value (mg.kg-1)
Cd 491 ± 19 470 ± 9 0.54 Co 31 ± 1 30.9 ± 1.3 0.19 Cr 883 ± 33 863 ± 30 0.28 Fe 21610 ± 764 21300 ± 1100 0.16 Hg 31 ± 1 31.4 ± 1.1 0.02 Sb 460 ± 17 412 ± 18 0.59 Se 46 ± 2 41.2 ± 2.1 0.64 Zn 34990 ± 1305 25770 ± 380 0.69
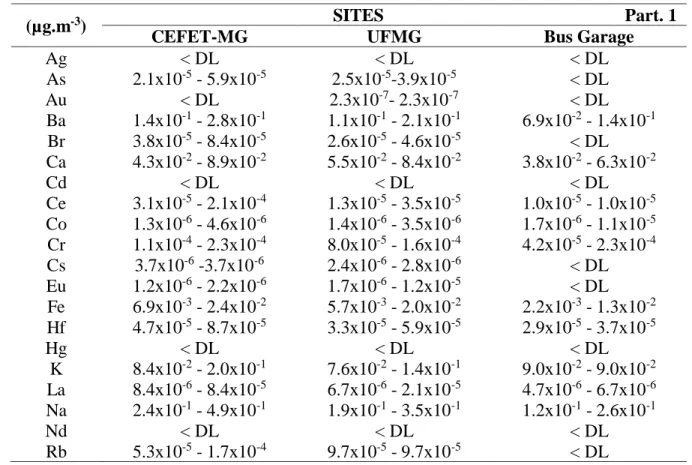
Table 3 shows the elemental concentration ranges (μg.m-3) per element and per sampled site, analysed in the airborne particulate matter.
Table 3: Range of elemental concentrations analysed in airborne particulate matter.
(µg.m-3) SITES Part. 1
CEFET-MG UFMG Bus Garage
Ag < DL < DL < DL As 2.1x10⁻⁵ - 5.9x10⁻⁵ 2.5x10⁻⁵-3.9x10⁻⁵ < DL Au < DL 2.3x10⁻⁷- 2.3x10⁻⁷ < DL Ba 1.4x10⁻¹ - 2.8x10⁻¹ 1.1x10⁻¹ - 2.1x10⁻¹ 6.9x10⁻² - 1.4x10⁻¹ Br 3.8x10⁻⁵ - 8.4x10⁻⁵ 2.6x10⁻⁵ - 4.6x10⁻⁵ < DL Ca 4.3x10⁻² - 8.9x10⁻² 5.5x10⁻² - 8.4x10⁻² 3.8x10⁻² - 6.3x10⁻² Cd < DL < DL < DL Ce 3.1x10⁻⁵ - 2.1x10⁻⁴ 1.3x10⁻⁵ - 3.5x10⁻⁵ 1.0x10⁻⁵ - 1.0x10⁻⁵ Co 1.3x10⁻⁶ - 4.6x10⁻⁶ 1.4x10⁻⁶ - 3.5x10⁻⁶ 1.7x10⁻⁶ - 1.1x10⁻⁵ Cr 1.1x10⁻⁴ - 2.3x10⁻⁴ 8.0x10⁻⁵ - 1.6x10⁻⁴ 4.2x10⁻⁵ - 2.3x10⁻⁴ Cs 3.7x10⁻⁶ -3.7x10⁻⁶ 2.4x10⁻⁶ - 2.8x10⁻⁶ < DL Eu 1.2x10⁻⁶ - 2.2x10⁻⁶ 1.7x10⁻⁶ - 1.2x10⁻⁵ < DL Fe 6.9x10⁻³ - 2.4x10⁻² 5.7x10⁻³ - 2.0x10⁻² 2.2x10⁻³ - 1.3x10⁻² Hf 4.7x10⁻⁵ - 8.7x10⁻⁵ 3.3x10⁻⁵ - 5.9x10⁻⁵ 2.9x10⁻⁵ - 3.7x10⁻⁵ Hg < DL < DL < DL K 8.4x10⁻² - 2.0x10⁻¹ 7.6x10⁻² - 1.4x10⁻¹ 9.0x10⁻² - 9.0x10⁻² La 8.4x10⁻⁶ - 8.4x10⁻⁵ 6.7x10⁻⁶ - 2.1x10⁻⁵ 4.7x10⁻⁶ - 6.7x10⁻⁶ Na 2.4x10⁻¹ - 4.9x10⁻¹ 1.9x10⁻¹ - 3.5x10⁻¹ 1.2x10⁻¹ - 2.6x10⁻¹ Nd < DL < DL < DL Rb 5.3x10⁻⁵ - 1.7x10⁻⁴ 9.7x10⁻⁵ - 9.7x10⁻⁵ < DL
Continuation – Part 2 Sb 8.0x10⁻⁶ - 3.5x10⁻⁵ 1.4x10⁻⁵ - 3.5x10⁻⁵ 3.0x10⁻⁶ - 1.5x10⁻⁵ Sc 1.6x10⁻⁶ - 4.6x10⁻⁶ 1.3x10⁻⁶ - 3.6x10⁻⁶ 7.7x10⁻⁷ - 2.0x10⁻⁶ Se < DL 4.5x10⁻⁵ - 7.3x10⁻⁴ < DL Sm 1.3x10⁻⁶ - 3.3x10⁻⁶ 1.2x10⁻⁶ - 2.8x10⁻⁶ 9.1x10⁻⁷ - 1.0x10⁻⁶ Sr 5.8x10⁻³ - 1.1x10⁻² 6.9x10-38.1x10-3 < DL Ta 1.1x10⁻⁶ - 5.3x10⁻⁶ 3.9x10⁻⁷ - 8.8x10⁻⁷ < DL Tb 3.1x10⁻⁷ - 7.7x10⁻⁶ 4.7x10⁻⁷ - 6.4x10⁻⁷ < DL Th 2.0x10⁻⁶ - 2.6x10⁻⁵ 4.1x10⁻⁶ - 4.8x10⁻⁶ < DL U < DL < DL < DL W < DL 4.2x10⁻³ - 4.2x10⁻³ < DL Yb 2.3x10⁻⁶ - 3.0x10⁻⁵ 3.4x10⁻⁶ - 3.4x10⁻⁶ < DL Zn 1.2x10⁻¹ - 2.3x10⁻¹ 8.9x10⁻² - 1.7x10⁻¹ 2.2x10⁻² - 1.1x10⁻¹ Zr 1.4x10⁻³ - 2.8x10⁻³ 1.8x10⁻³ - 1.8x10⁻³ < DL
< DL: Lower than Detection Limit
3.1. Statistical analysis
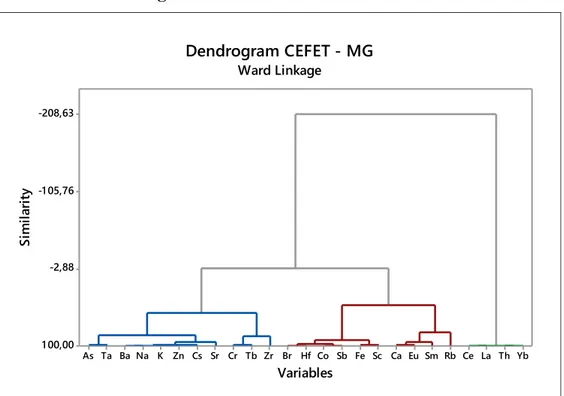
In order to verify the contribution of the main sources present in Belo Horizonte, Cluster analysis with Ward linkage method according to Turban, Sharda and Aronson [22]. The variables that had values below the limit of detection and non-representative values were eliminated. The elements present in the samples come from several sources, both natural and anthropogenic and have a preferred indication according to the United States Environmental Protection Agency – Speciate [24]. Figures 2, 3 and 4 present the Cluster analysis separated into three groups.
Figure 2: CEFET – MG data Cluster. Yb Th La Ce Rb Sm Eu Ca Sc Fe Sb Co Hf Br Zr Tb Cr Sr Cs Zn K Na Ba Ta As -208,63 -1 05,76 -2,88 1 00,00 Variables Si m ila ri ty Dendrogram CEFET - MG Ward Linkage Source: Author
Figure 3: UFMG data Cluster.
Sm Ta Sr Rb U La Th Yb Tb Ce Eu Sb Hf Cr Sc Fe Co Ca Na Zn Ba Cs Br K As -96,32 -30,88 34,56 1 00,00 Variables Si m ila ri ty Dendrogram UFMG Ward Linkage Source: Author
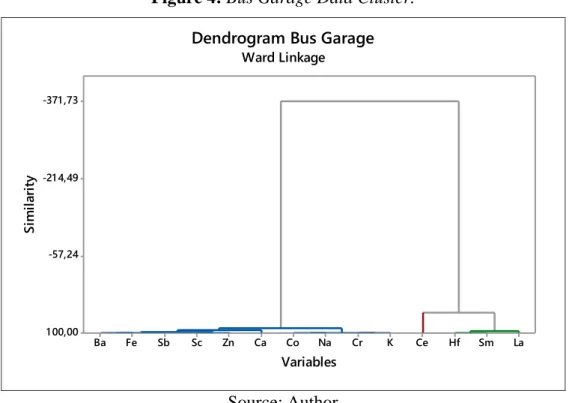
Figure 4: Bus Garage Data Cluster. La Sm Hf Ce K Cr Na Co Ca Zn Sc Sb Fe Ba -371 ,73 -21 4,49 -57,24 1 00,00 Variables Si m ila ri ty
Dendrogram Bus Garage
Ward Linkage
Source: Author
According to Speciate [24], the elements As, Ba, Br, Ca, Co, Cr, Eu, Fe, K, Na, Rb, Sb, Sc, and Zn are predominantly present in fuel combustion, vehicular engines, brake wear, construction and industrial emissions. The elements Au, Ce, Cr, Eu, Hf, La, Nd, Sb, Sr, Ta, Th, U and Yb in soil, vehicular emissions, fuel combustion and Ag, Tb, W and Zr are preferably present in the composition of asphalt, oil burning, cement, diesel and soil emissions.
Table 4 shows the results of Cluster Analysis, including the elements. The sources of this airborne particulate matter were inferred.
Table 4: Results of Cluster Analysis.
Dendrograms
Sites
CEFET – MG UFMG Bus Garage
Elem. Influence Elem. Influence Elem. Influence
First Cluster As, Ba, Cr, Cs, K, Na, Sr, Ta, Tb, Zn, Zr vehicular emissions As, Br, Cs, K fuel burn, wear of brakes Ba Ca Co Cr Fe K Na Sb Sc Zn Soil, resuspension and vehicular emissions Second Cluster Br, Ca, Co, Eu, Fe, Hf, Rb, Sb, Sc, Sm soil Ba, Ca, Co, Cr, Eu, Fe, Hf, Na, Sb, Sc, Zn soil and vehicular emissions Ce soil
Third Cluster Ce, La,
Th, Yb soil Ce, La, Rb, Sm, Sr, Ta, Tb, Th, U, Yb soil and construction Hf, Ca, Sm soil
4. CONCLUSION
This study was performed through semi-automatic samplings of PM10, with a Large Volume Sampler at points located in Belo Horizonte that reflect air quality in terms of particulate material.
The results of concentration of the airborne particulate matter showed that 69.2% of the samplings pointed out "Moderate Conditions" of air quality. This can cause symptoms as cough and fatigue for people belonging to a sensitive group (children, elderly, people with respiratory and cardiac diseases).
The neutron activation analysis, method k0, was efficient in determining the elemental concentrations present in the airborne particulate matter in filters. The quality evaluation of the analytical method was performed by the En-number test with the certified reference material BCR 176 "City Incineration Ash".
Statistical analysis used to interpret the results based on concentration of particulate matter and elemental concentration, indicated the possible sources emitting particulate matter, either in natural
or anthropogenic form. The vehicular emissions contributed more for the particulate matter, followed by soil.
This work was a preliminary assessment. More samples will be collected and more sites will be sampled and analysed in order to identify more pollution sources.
ACKNOWLEDGMENT
This research project is supported by the following Brazilian institutions: Federal University of Minas Gerais (UFMG), Nuclear Technology Development Center (CDTN), Brazilian Nuclear Energy Commission (CNEN), Research Support Foundation of the State of Minas Gerais (FAPEMIG), Coordination of Superior Level Staff Improvement (CAPES).
REFERENCES
[1] IBGE. IBGE Cidades. Instituto Brasileiro de Geografia e Estatística, 2018. [Online]. Available at: <https://cidades.ibge.gov.br/>. Last accessed: 14-Mar-2018.
[2] CONAMA. Resolução n° 003 de 28 de junho de 1990. Conselho Nacional do Meio
Ambiente, 1990.
[3] SALGADO, P. E. T.. Informações gerais e ecotoxicológicas de material particulado. Salvador, 2003.
[4] SEINFELD, J. H.; PANDIS, S. N.. Atmospheric Chemistry and Physics, Second. 2006. [5] Chelani, A. B.; Gajghate, D. G.; ChalapatiRao, C. V.; Devotta, S.. Particle Size Distribution
in Ambient Air of Delhi and Its Statistical Analysis. Bull. Environ. Contam. Toxicol., vol.
85, no. 1, pp. 22–27, Jul. 2010.
[6] ARAÚJO, G. M. de. Segurança na Armazenagem, Manuseio e Transporte de Produtos
Periogosos. Second. Rio de Janeiro, 2005.
[7] US-EPA. Sampling of ambient air for total suspended particulate matter (SPM) and
[8] Wang, G.; Huang, L.; Gao, S.; Gao, S.; Liansheng, W.. Measurements of PM10 and PM2.5
in urban area of Nanjing, China and the assessment of pulmonary deposition of particle mass. Chemosphere, vol. 48, pp. 689–695, 2002.
[9] WHO. WHO Air quality guidelines for particulate matter, ozone, nitrogen dioxide and
sulfur dioxide - Global Update 2005 - Summary of Risk assessment, 2005.
[10] Tavares, F. V. F.; Barreto, A. A.; Dutra, E. G.; Jacomino, V. M. F.. Estudo do processo de
dispersão de emissões veiculares em uma microrregião de Belo Horizonte (MG) utilizando simulação numérica. Eng. Sanit. e Ambient., vol. v.15 n.4, pp. 315–324, 2010.
[11] ENERGÉTICA. Energética - Qualidade do ar, 2015. Available at: <http://www.energetica.ind.br>. Last accessed: 02-Feb-2015.
[12] Godec, R.; Cackovic, M.; Sega, K.; Ivan, B.. Winter Mass Concentrations of Carbon
Species in PM10, PM2.5 and PM1 in Zagreb Air, Croatia. Bull. Environ. Contam.
Toxicol., vol. 89, pp. 1087–1090, 2012.
[13] De Corte, F.. The k0-standardization method: A move to the optimization of NAA, University of Gent., 1987.
[14] Menezes, M. Â. D. B. C.; Sabino, C. V. S.; Franco, M. B.; Kastner, G. F; Rossi, E. H. M..
k0-Instrumental Neutron Activation Analysis Establishment at CDTN, Brazil: A successful story. J. Radioanal. Nucl. Chem., vol. v.257, pp. 627–632, 2003.
[15] HYPERLAB, HYPERLAB, 2015. Available at: <www.hlabsof.com>. Last accessed: 02-Mar-2015.
[16] KAYZERO FOR WINDOWS®. User’s Manual for reactor neutron activation analysis
(NAA) using the k0 standardization method, 2011.
[17] Emery, C. A.. Considering Cluster Analysis in Sport Medicine and Injury Prevention
Research. Clin. J. Sport Med., vol. 17, pp. 211–214, 2007.
[18] Zhao,W.; Zou, W.; Chen, J. J.. Topic modeling for cluster analysis of large biological and
[19] Zibert, J.; Jure, P.. Cluster analysis of particulate matter (PM10) and black carbon (BC)
concentrations. Atmos. Environ., vol. 57, pp. 1–12, 2012.
[20] Prokasky, A.; Rudasill, K.; Molfese, V. J.; Putnam,S.; Gartstein, M.; Rothbart, M..
Identifying Child Temperament Types Using Cluster Analysis in Three Samples. J. Res.
Pers., vol. 67, pp. 190–201, 2017.
[21] Vieira, L. F.; Castro, A. M. G. de; Lima, S. M. V.. Estudos de Reordenamento Agrário 2:
Perfil dos beneficiários do programa nacional de crédito fundiário: Consolidação da agricultura familiar (PNCF-CAF), 2011.
[22] Turban,E.; Sharda, R.; Aronson, J. E.; King, D.. Business Intelligence: Um enfoque
gerencial para a inteligência do negócio. São Paulo, 2009.
[23] US-EPA. AQI - Air Quality Index - A Guide to Air Quality and Your Health. EPA-456/F-14-002, 2014.
[24] Speciate. Air Emissions Modeling. USEPA, 2017. Available at: <https://www.epa.gov/air-emissions-modeling/speciate-version-45-through-32>. Last accessed: 01-Oct-2015.