Personality and Social Psychology Bulletin 38(4) 491 –504
© 2012 by the Society for Personality and Social Psychology, Inc
Reprints and permission: sagepub.com/journalsPermissions.nav DOI: 10.1177/0146167211429746 http://pspb.sagepub.com Article
In June 2009, Dalila Mimouni, a Moroccan immigrant living in Spain, sought help at the Gregorio Marañón Hospital in Madrid. According to the newspaper El Pais, after being examined “very rapidly,” the patient was sent home without a defined diagnosis. When her condition did not improve, the 20-year old woman returned to the hospital. She was sent home again after another “quick observation.” A third visit to the hospital inevitably ensued. Once more, after another “swift” examination, Mimouni was sent home without her condition having been thoroughly analyzed. She died a few hours later, without the health-care services having spent sufficient time examining her properly. She was the first fatal victim of the H1N1 virus in Spain. This case shows the dra-matic consequences of spending too little time on people in everyday life.
In this article, we analyze the time that people spend car-rying out a social-judgement task in the context of intergroup relations. Indeed, time is an important and valuable resource that is strategically used by people to organize and hierar-chize all aspects of their life (see Becker, 1965; Linder, 1970). The question that emerges is whether people spend different amounts of time diagnosing or judging ingroup (e.g., White people) and outgroup (e.g., Black people) mem-bers. Because of the social and personal value attributed to time (e.g., Leclerc, Schmitt, & Dubé, 1995), we propose the
hypothesis that White people spend more time evaluating ingroup members (i.e., White targets) than members of a racialized outgroup (i.e., Black targets). That is, we predict a time bias in favor of the ingroup and we examine the relation between this time bias and prejudice, valence, homogeni-zation, stereotyping, racial beliefs, and the motivation to respond without prejudice.
Intergroup Time Bias
Theorizing and research on intergroup relations has system-atically shown that any meaningful ingroup–outgroup distinc-tion could lead to evaluate members of these groups differently (e.g., Tajfel & Turner, 1979; for a review, see Dovidio & Gaertner, 2010). Ingroup biases identified have been found at the level of resources (more resources attributed to the ingroup than to the outgroup; e.g., Tajfel, Billig, Bundy, & 1Institute of Social Sciences, University of Lisbon, Lisbon, Portugal 2Federal University of Sergipe, Sergipe, Brazil
3Catholic University of Louvain, Louvain-la-Neuve, Belgium
Corresponding Author:
Jorge Vala, Institute of Social Sciences, University of Lisbon, ICS-UL, Avenida Professor Anibal de Bettencourt, 9, Lisbon 1600-189, Portugal Email: [email protected]
Intergroup Time Bias and
Racialized Social Relations
Jorge Vala
1, Cícero Roberto Pereira
1,
Marcus Eugênio Oliveira Lima
2, and Jacques-Philippe Leyens
3Abstract
Within the framework of intergroup relations, the authors analyzed the time people spent evaluating ingroup and outgroup members. They hypothesized that White participants take longer to evaluate White targets than Black targets. In four experiments, White participants were slower to form impressions of White than of Black people; that is, they showed an intergroup time bias (ITB). In Study 1 (N = 60), the ITB correlated with implicit prejudice and homogeneity. Study 2 (N = 60) showed that the ITB was independent of the type of trait in question (nonstereotypical vs. stereotypical). Study 3 (N = 100) demonstrated that ITB correlates with racism measured 3 months beforehand, is independent of motivation to control prejudice, and is not an epiphenomenon of homogeneity. In Study 4 (N = 40) participants not only showed the ITB in a racialized social context but also displayed it following a minimal group manipulation.
Keywords
prejudice, racism, homogeneity, impression formation, intergroup bias
Flament, 1971), valence (more positive traits attributed to the ingroup; e.g., Allen, 1996), emotions (more secondary emotions are attributed to the ingroup; e.g., Leyens et al., 2000; Pereira, Vala, & Leyens, 2009), or language use (e.g., Maass, 1999). Our hypotheses propose that ingroup favorit-ism also occurs in relation to time spent in racialized social relations because time is meaningful and it is socially valuable so that people should spend more time evaluating ingroup than outgroup members. We call this intergroup time bias (ITB), a phenomenon that can have dramatic con-sequences, as in the case of Dalila Mimouni.
Time as a meaningful psychological resource has been studied by the impression-formation literature. Indeed, Neuberg and Fiske (1987) gave information about a target and looked at the amount of time participants spent reading the target’s profile before making a decision. The results showed that the time spent indicated whether people made more category-oriented or more individuation-oriented responses. Stated otherwise, the less people are interested (or the fewer cognitive resources they have) and motivated, the quicker they form an impression of a given target (Fiske & Neuberg, 1990). Similarly, the dual-process model of impression formation proposed by Brewer (1988) assumes that categorization is activated by default in an impression formation task and that the time spent depends on the per-ceiver’s goals or motives. Moreover, both models argue that in everyday life, if a substantial amount of time is spent observing a given person, the observer is motivated by and interested in that person and is more likely to individuate him or her (see also Brewer & Feinstein, 1999; Fiske, Lin, & Neuberg, 1999). Additionally, Bargh and Thein (1985) showed that time is related to the attention that is devoted to processing information on an individual target (see also Barone, Maddux, & Snyder, 1997). The question we are posing is whether the time people invest to evaluate a target depends on the group membership of this target. Specifically, we analyze whether the mere categorization of targets as White or Black affects the time spent by White perceivers on the evaluation task. Our hypothesis is that White participants spend more time evaluating White targets than Black targets, just as they allocate more resources to ingroup members and make more positive evaluations of them (Dovidio & Gaertner, 2010). That is, we extend previous research on ingroup favoritism to the analysis of the impact of target group mem-bership on the time spent to form an impression.
Overview of the Studies
We examined the time White people spent forming an impression of White and Black targets. We hypothesized that participants will show an ITB; that is, they will spend more time forming an impression of White people than they do of Black people. In terms of race relations, it is well docu-mented that prejudiced and racist beliefs are held against Black people (see Fredrickson, 2002; Jahoda, 1999). If
White people devalue Black people, and if time is a valuable resource (Leclerc et al., 1995), it is likely that they will spend less time evaluating Black people than White people.
We carried out four studies to test our hypotheses. Study 1 tested whether White participants would spend more time forming an impression of White targets than Black targets. It also examined the correlation between the ITB, the inter-group homogeneity, and an implicit measure of prejudice. Study 2 aimed to exclude the possibility that the ITB is the result of a stereotyping process, and Study 3 further investi-gated the relation between the ITB and explicit racism as well as internal and external motivations to control preju-dice. To further our understanding of the ITB phenomenon, Study 4 analyzed whether the ITB also emerges in a minimal group context, that is, with nonsocially sensitive groups. Our results add to the evidence that demonstrates the widespread nature of intergroup bias. Most important, we clarify the meaning and importance of time for impression formation in intergroup relations by contrasting the ITB with alternative explanations based on stereotyping, outgroup homogeneity, and motivation to control prejudice.
Study 1
In this study, we test the hypothesis that White participants spend more time evaluating White targets than Black targets in an impression formation task. Participants were presented with nonstereotypical positive and negative personality traits linked to Black or White targets. The participants’ task was to decide whether the adjectives were appropriate to charac-terize the targets. We predicted that participants would be slower for the White targets (i.e., they should invest more time evaluating White targets). Moreover, we analyze whether the ITB is a random or meaningful effect by correlating it with already well-documented intergroup phenomena, such as outgroup homogenization (e.g., Abelson, Dasgupta, Park, & Banaji, 1998; Tajfel, 1982) and implicit prejudice (e.g., Wittenbrink, Judd, & Park, 2001).
Method
Participants. Participants were 60 White male university students. Students’ ages ranged from 18 to 31 years old (M = 20.85, SD = 2.12).
Procedures. Participants were informed they would par-ticipate in two unrelated studies in a computer. Half of them were informed that the “first study” consisted of a person perception task and the “second study” of a word compre-hension task. Remaining participants received a reversed order. Between the two tasks participants were invited to answer a small questionnaire on how they felt during the experiment (a filler task).
Impression formation task. Participants were told that they would have to form an accurate impression of several per-sons. Four digital colour pictures of males (two Whites and
two Blacks) were used. Traits and pictures were presented in a random order for each participant. In each trial, one photo and 1 of 16 traits were used as stimuli. Participants were asked to focus on a fixation point (+), which was shown for 1,000 ms in the center of the computer screen. The fixation point was immediately substituted by a photo accompanied by 1 of the 16 traits presented below the picture with the computer pausing until the participant had responded. The participant’s task was to press an N (no) or Y (yes) key to indicate whether the traits rightly described the target or not. A blank screen was presented for 1,000 ms before the next trial. Additionally, 8 practice trials were presented initially, involving both positive and negative traits. No interval sepa-rated these 8 practice trials from the 64 experimental trials. The response latency for each trait was registered for each participant. Latencies that were ≥ 2 SD from each partici-pant’s mean were deleted as outliers; all latencies were sub-mitted to a natural logarithmical transformation for the analyses but we report untransformed means in seconds.
Measure of homogeneity in the impression formation task. We coded each trait attributed to a target with a score of +1 (the trait was attributed) or –1 (the trait was not attributed). Then for each trait, we multiplied the scores attributed to the targets of the same group. If a trait was attributed (or not) to the two targets of the same group, the product is +1. But if one trait was assigned to one target (+1) but not to the other target of the same group (–1), the product is –1. Accordingly, across traits, higher sums of the products mean greater homo-geneity of the targets. Since we used eight positive and eight negative traits, the sum of products can vary from –8 (more heterogeneity) to +8 (more homogenization of the targets).
Implicit measure of prejudice. Participants were told they would participate in a word comprehension task (see Wittenbrink et al., 2001). Participants were instructed to pay attention to a fixed point (+) that appeared in the center of the screen for 1,000 ms. This point was immediately followed by the subliminal primes (i.e., BLACKS or WHITES, or TABLES). After 15 ms, the prime was replaced by a masking stimulus (XXXXXX), which remained on the screen for 250 ms. Then, the target adjective appeared for another 250 ms. Participants’ task was to indicate by pressing one of two response keys, N (negative) or P (positive), whether the target adjective stimulus made them think of something positive and good or negative and bad. Sixteen nonstereotypical traits (eight positive and eight negative) were used, and all the pro-cedures used by Wittenbrink et al. (2001) were followed. We computed an implicit prejudice index measuring the extent to which participants were more facilitated when judging nega-tive than posinega-tive traits following the Black prime and less facilitated when judging negative than positive traits follow-ing the White prime (see also Fazio, Jackson, Dunton, & Williams, 1995). That is, implicit prejudice = [(Black negative – Black positive) + (White positive – White negative)].
Pretests. The photos used in this and the subsequent studies were pretested concerning their neutral facial
expressions, graphic quality, and attractiveness. We also pretested the adjectives used in all studies regarding their valence and stereotypicality. In the current study, the selected traits for the impression formation task were pos-itive (e.g., appealing, delightful, favorable, sincere) or negative (e.g., awful, horrible, repulsive, upsetting) and nonstereotypical of White or Black people. In the evalua-tive judgment task, we used the 16 nonstereotypical adjec-tives (e.g., likable, pleasant, irritating, disturbing) used by Wittenbrink et al. (2001).
Results
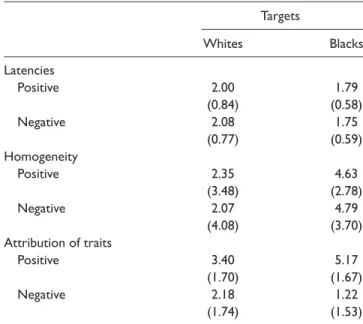
ITB. The first panel of Table 1 shows the means of the response latencies obtained in the impression formation. A 2 (target: Whites vs. Blacks) × 2 (trait valence: positive vs. negative) × 2 (order of the tasks) ANOVA on the log- transformed latencies was carried out. As predicted, there is a significant target’s main effect, F(1, 58) = 15.16, p < .001, η2
p=
.21. Participants were slower to form an impression of White (M = 2.04s, SD = 0.64) than Black (M = 1.77s, SD = 0.51) targets. None of the other main or interaction effects was significant. From now on, we measure ITB through the sys-tematic variance accounted by the difference of latencies for Black and White targets (i.e., Whites latencies minus Black latencies): the higher the scores, the higher the ITB, that is, more spent time to evaluate White than Black targets.
Homogeneity. ANOVA results showed a reliable main effect of the target, F(1, 58) = 31.45, p < .001, η2
p= .35.
Black targets were more homogenized (M = 4.71, SD = 2.67) than White targets (M = 2.21, SD = 3.34). The other effects are not significant (see the second panel of Table 1). Subse-quently, we measured homogeneity through the systematic variance accounted by the difference of homogeneity of the Black and White targets (i.e., Black homogeneity minus Whites homogeneity).
Attribution of traits. The means of explicit attribution of traits (range = 0 to 8) are shown in the third panel of Table 1. We found a significant interaction between targets and valence, F(1, 58) = 39.07, p < .001, η2
p= .40. Simple effects showed
that more positive traits were attributed to Black than to White targets, F(1, 58) = 57.30, p < .001, η2
p= .50, whereas
more negative traits were attributed to White than to Black people, F(1, 58) = 16.43, p < .001, η2
p= .22. These results are
in line with previous research showing effects of the antiprej-udice norm (see Pettigrew & Meertens, 1995). Accordingly, we computed a valence index measuring the extent to which participants said “yes” more frequently to positive than neg-ative traits for Black people, and “no” more frequently to positive than negative traits for White people, that is, valence of the impression formation = [(Black positive – Black nega-tive) + (White negative – White posinega-tive)].
Correlations. Table 2 shows the correlations between the ITB, homogeneity, prejudice, and valence. The cor-relation between the ITB and homogeneity was positive
Table 1. Means and Standard Deviations (in Parentheses) of the
Latencies (in Seconds), Homogeneity, and Attribution of Traits (Study 1) Targets Whites Blacks Latencies Positive 2.00 1.79 (0.84) (0.58) Negative 2.08 1.75 (0.77) (0.59) Homogeneity Positive 2.35 4.63 (3.48) (2.78) Negative 2.07 4.79 (4.08) (3.70) Attribution of traits Positive 3.40 5.17 (1.70) (1.67) Negative 2.18 1.22 (1.74) (1.53)
Table 2. Correlations Between Measures (Study 1)
1 2 3
1. Intergroup time bias —
2. Homogeneity .40*** —
3. Prejudice .56*** .22* —
4. Valence of the impression formation −.15 −.07 .01 *p < .05. ***p < .001.
and significant, indicating that the greater ITB, the more homogeneous were Black relative to White targets. More-over, the ITB positively correlates with the implicit measure of prejudice, indicating that the greater ITB, the higher the prejudice against Black people. Importantly, the correlation between the ITB and the tendency to say “yes” more fre-quently to positive terms for Black people than for White people and vice versa for more negative terms was not significant.
Discussion
The results largely support our main prediction: White par-ticipants invest more time evaluating White than Black targets. Not only did participants more slowly attribute personality traits to Whites than to Blacks, but they also differentiated more the former targets than the latter targets. In fact, the slower was the attribution of traits to Whites relative to Blacks targets, the more homogeneous was the distribution of these traits to Blacks relative to Whites. Importantly, the expected positive correlation between the ITB and the implicit measure of prejudice was reliable and supports the association between prejudice and the ITB.
It is interesting to contrast these results with those obtained for the valence of the attributed traits. Although participants gave traits to Black targets in a more homoge-neous way and more rapidly, they did not distribute these traits at random because they attributed more positive traits to Blacks than to Whites. Indeed, it could be claimed that White participants are more rapid with Blacks than with Whites because they know and apply quickly the socially desirable response. However, this explanation does not mat-ter just because the ITB was not related to the valence of the impression formation as shown by the absence of significant correlations between the ITB and attribution of positive and negative traits to targets.
One could also argue that the greater time spent attribut-ing personality traits to White targets is a sign of stereotyp-ing, even though the personality traits had been purposely selected as nonstereotypical of Black and White people. To better address this alternative explanation, it may therefore be suitable to work with stereotypical and nonstereotypical traits and contrast the predictions of an ITB effect in social judgment and this alternative explanation.
Study 2
This experiment aims to replicate the results of Study 1 and to verify whether the ITB is a mere stereotyping effect. If it is the case, participants should be faster when attributing stereotypical traits of the targets and slower when attributing counterstereotypical traits. According to the ITB hypothesis, participants should spend more time forming an impression of White than Black targets independent of the stereotypical-ity of the traits.
Method
Participants. Forty White university students (50% male) participated in this experiment. Students’ age ranged from 18 to 32 years old (M = 20.08, SD = 3.17).
Procedure. Participants were told that they were participat-ing in a study about impression formation. We used the same target photos of Study 1. Only the type and number of traits changed in the impression formation task. We used 24 adjec-tives (half positive, half negative): 8 nonstereotypical of either group (appealing, delightful, favorable, sincere, awful, horri-ble, repulsive, upsetting), 8 stereotypical of White people (ambitious, competent, educated, industrious, boring, exploit-ative, materialistic, selfish), and 8 stereotypical of Black people (athletic, cheerful, expressive, musical, delinquent, dishonest, lazy, violent).
Results
ITB. The means of the response latencies are presented in the first panel of Table 3. Log-transformed latencies were used in an ANOVA with a 2 (target: Black vs. White) × 3 (type of trait: stereotypical of Black people vs. stereotypical
of White people vs. nonstereotypical) × 2 (valence of the traits: positive vs. negative) within-subject design. As pre-dicted by the ITB hypothesis, the main effect of the target was significant, F(1, 39) = 19.05, p < .001, η2
p= .33.
Partici-pants more slowly formed impressions of White targets (M = 1.80s, SD = 0.54) than of Black targets (M = 1.67s, SD = 0.48). The interaction between the type of trait and valence is also significant, F(2, 78) = 38.22, p < .001, η2
p = .50, but
because it does not address the ITB effect, it is not detailed. No other effect was reliable. Therefore, the alternative hypothesis based on stereotyping effect is not reliable at explaining why participants invest more time forming impressions of White than Black targets.
To distinguish more precisely ITB and stereotyping effects, we also carried out planned comparisons testing sev-eral contrasts (see Table 4). The first contrast weight repre-sents the ITB effect and replicates the design of the Study 1—that is, participants are slower to form impressions of White than Black targets (M = 2.04s, SD = 0.69 and M = 1.89s, SD = 0.61, respectively) based on nonstereotypic traits, F(1, 39) = 22.94, p < .001, η2
p= .37. The second
con-trast weight represents a generalized ITB effect (across type of traits) already identified above by target main effect of the ANOVA. Finally, the third contrast weight represents the ste-reotyping alternative hypothesis and tests whether partici-pants are quickest to attribute Black stereotypic traits to Black targets and quickest to attribute White stereotypic
traits to White targets. This contrast is not significant, F(1, 39) = 0.01, ns, indicating that the ITB cannot be explained by stereotyping effects.
Homogeneity. The means of the homogeneity are pre-sented in the second panel of Table 3. We found significant main effects of the target, valence, and type of trait, F(1, 39) = 11.47, p < .01, η2
p= .23; F(1, 39) = 6.54, p < .05,
η2
p= .14; and F(2, 78) = 3.74, p < .05, η2p= .09, respectively.
In general, Black targets were more homogenized than White targets (M = 2.35, SD = 0.97 and M = 1.55, SD = 1.54, respec-tively); targets were more homogenized on negative than positive traits (M = 2.19, SD = 1.28 and M = 1.70, SD = 1.28, respectively) and they were more homogenized when impression formation was based on nonstereotypical traits (M = 2.20, SD = 1.15) than on stereotypical traits of White people (M = 1.98, SD = 1.26) and of Black people (M = 1.68, SD = 1.38). These effects are qualified by a reliable Target × Type of Trait interaction, F(2, 78) = 3.78, p < .05, η2
p= .08; a
Target × Valence interaction, F(1, 39) = 16.39, p < .001, η2 p=
.30; and a Type of Trait × Valence interaction, F(2, 78) = 24.79, p < .001, η2
p= .39. Importantly, these effects are
qual-ified by a three-way Target × Type of Trait × Valence interac-tion, F(2, 78) = 12.73, p < .001, η2
p = .25, indicating that
homogeneity of the targets depends of the type and valence of the traits. Only the valence main effect was significant when impression formation was based on stereotypical traits of White people, F(1, 39) = 16.88, p < .001, η2
p= .30; there
was greater homogeneity in the attribution of positive than negative traits (M = 2.50, SD = 1.30 and M = 1.45, SD = 1.66, respectively). When impression formation was based on Table 3. Means and Standard Deviations (in Parentheses) of the
Latencies (in Seconds), Homogeneity, and Attribution of Traits (Study 2)
Targets
Whites Blacks
Item stereotypicality Item stereotypicality
STW NST STB STW NST STB Latencies Positive 1.59 1.99 1.63 1.49 1.89 1.60 (0.48) (0.66) (0.54) (0.51) (0.68) (0.51) Negative 1.95 2.09 1.54 1.80 1.90 1.33 (0.67) (0.82) (0.56) (0.65) (0.62) (0.39) Homogeneity Positive 2.20 1.05 1.65 2.80 2.55 0.01 (2.34) (2.44) (2.52) (1.96) (1.81) (2.68) Negative 1.15 1.90 1.35 1.75 3.30 3.70 (2.07) (2.35) (2.66) (2.13) (0.97) (1.32) Attribution of traits Positive 2.00 2.88 2.23 6.90 5.98 4.70 (2.47) (2.14) (2.04) (1.95) (2.03) (2.19) Negative 2.73 2.95 2.93 2.58 0.75 0.40 (1.64) (2.55) (2.64) (1.58) (1.50) (1.46) STW = stereotypical traits of White people; NST = nonstereotypical traits; STB = stereotypical traits of Black people.
Table 4. Contrast Weights for Response Latency in the
Impression Formation Task (Study 2)
Targets
Whites Blacks
Item
stereotypicality stereotypicalityItem
Contrasts STW NST STB STW NST STB 1. ITB Item valence Positive 0 1 0 0 −1 0 Negative 0 1 0 0 −1 0 2. Generalized ITB Item valence Positive 1 1 1 −1 −1 –1 Negative 1 1 1 −1 −1 –1 3. Stereotyping Item valence Positive −1 0 1 1 0 –1 Negative −1 0 1 1 0 –1
ITB = intergroup time bias; STW = stereotypical traits of White people; NST = nonstereotypical traits; STB = stereotypical traits of Black people.
stereotypical traits of Black people, the Target × Valence interaction was significant, F(1, 39) = 32.84, p < .001, η2
p =
.46. Simple effects indicate Black targets were more homog-enized on negative than positive stereotypical traits of Black people, F(1, 39) = 77.27, p < .001, η2
p = .67, indicating a
valenced stereotypical homogeneity of Black targets. Finally, the critical analysis is in the nonstereotypical traits con-dition, which shows only significant main effects of valence and of targets, F(1, 39) = 9.38, p < .01, η2
p = .19, and F(1, 39)
= 14.41, p < .001, η2
p = .30, respectively. The targets were
more homogenized on negative traits (M = 2.60, SD = 1.35) than on positive traits (M = 1.80, SD = 1.49). Importantly, and replicating Study 1, Black targets were more homog-enized (M = 2.93, SD = 1.05) than White ones (M = 1.48, SD = 2.03).
In sum, three meaningful homogeneity effects can be retained since they have systematic variance that could corre-late with the ITB. The first is the generalized homogeneity, representing the general main effect of the targets. The second is the nonstereotypical homogeneity, representing the greater homogeneity of Black relative to White targets when the impression formation was based on nonstereotypical traits, such as we verified in Study 1. Finally, the third meaningful effect is the valenced stereotypical homogeneity of the Black targets, which represents a more negative than posi-tive homogenization of the Black targets when the impres-sion formation was based on stereotypical traits of Black people.
Attribution of traits. The means of the attribution of traits are presented in the third panel of Table 3. ANOVA results showed reliable main effects of the target, type of trait, and valence, F(1, 39) = 72.84, p < .001, η2
p = .65; F(2, 78) =
16.21, p < .001, η2
p = .29; and F(1, 39) = 38.85, p < .001, η2p
= .50, respectively. These effects were qualified by a reliable Target × Type of Trait interaction, F(2, 78) = 36.44, p < .001,
η2
p = .48, and by a reliable Target × Valence interaction, F(1,
39) = 85.70, p < .001, η2
p = .69. The first interaction indicates
that the effect of the type of trait depends on target. Simple effects show that trait attribution to White targets was not influenced by type of traits, F(2, 78) = 2.19, ns, whereas trait attribution to Black targets was, F(2, 78) = 70.18, p < .001, η2
p = .64. Participants attributed to Black targets more
ste-reotypic traits of White people (M = 4.74, SD = 1.42) than nonstereotypical traits (M = 3.36, SD = 0.95), F(1, 39) = 51.86, p < .001, η2
p = .57, and than stereotypic traits of Black
people (M = 2.55, SD = 1.08), F(1, 39) = 99.07 p < .001, η2 p =
.72. The second interaction indicates that the effect of valence depends of target: More positive traits were attributed to Black (M = 5.85, SD = 1.79) than to White (M = 2.35, SD = 1.89) targets, F(1, 39) = 118.87, p < .001, η2
p = .75, whereas
more negative traits were attributed to White targets (M = 2.87, SD = 1.74) than to Black targets (M = 1.24, SD = 1.17), F(1, 39) = 35.64, p < .001, η2
p = .48. The other effects were
not significant. In sum, these results clearly confirm Study 1 suggesting that participants tried to show that they were not prejudiced. Thus, like in Study 1, we captured this effect by computing the valence of the impression formation index representing the extent to which participants said “yes” more frequently to positive than negative traits for Black people and said “no” more frequently to positive than negative traits for White people. This index was computed for general Tar-get × Valence interaction, as well for nonstereotypical, White stereotypical, and Black stereotypical trait conditions.
Correlations. Table 5 shows the correlations between mean-ingful contrast indices of the latencies, homogeneity, and trait attribution. The critical correlations are in the two columns concerning ITB measures. Replicating Study 1 results, ITB correlates positively with homogeneity when impression for-mation is based on nonstereotypical traits, showing that the higher the ITB is, the higher Black homogeneity is relative to Table 5. Correlations Between Measures (Study 2)
1 2 3 4 5 6 7 8 9
Latencies: Contrast scores
1. ITB —
2. Generalized ITB .70*** —
3. Stereotyping −.09 −.06 —
Homogeneity
4. Black homogeneity stereotypically valenced −.08 .02 −.11 — 5. Nonstereotypical relative homogeneity .53*** .47** −.01 −.15 — 6. Generalized relative homogeneity .28* .49*** −.17 .39* .47** — Attribution of traits: Valence of the impression formation
7. Nonstereotypical traits −.09 −.04 −.04 .19 .01 .06 —
8. White stereotypical traits .25 .16 .05 .02 .11 .14 .66*** —
9. Black stereotypical traits .08 .12 .11 .16 .05 .34* .57*** .65*** —
10. Generalized valence of the impression formation .07 .08 .04 .15 .06 .21 .88*** .87*** .85*** ITB = intergroup time bias.
White homogeneity. Furthermore, ITB correlated with gen-eralized ITB (i.e., ITB involving all type of traits) and with generalized homogeneity (i.e., homogeneity involving all type of traits). Also relevant are the positive and significant correlations between the score of generalized ITB and both scores of nonstereotypical homogeneity and generalized homogeneity. These correlations reinforce ITB hypothesis predicting convergence between less response times to form impressions of Black than White targets and the outgroup homogeneity effect.
Importantly, ITB measures do not correlate with stereo-typing, reinforcing evidence that ITB should not be confused with stereotyping effects. Also important are the correlations between ITB measures and the content of the attributed traits (i.e., the valenced impression formation). In fact, the correla-tions between the generalized tendencies to give a more positive impression of Black targets (to say “yes” more fre-quently to positive traits for Black targets than for White tar-gets, and vice versa for negative traits) as well as when using nonstereotypical, White stereotypical, or Black stereotypical traits and ITB were not significant. The other correlations are less important to the specific hypotheses addressed in this study since they do not involve ITB measures.
Discussion
In this experiment, impression formation was identified with nonstereotypical and stereotypical traits. Results confirmed the ITB effect showing that White participants invest more time evaluating White than Black targets, regardless of the type of traits and their valence. Results supported our expla-nations and did not support an alternative explanation based on a stereotyping effect. Moreover, as in the previous study, the correlations between ITB measures and homogeneity were significant whereas ITB did not correlate with the rela-tive valence of the impression.
Study 3
This study directly addresses whether the ITB means that White participants are quicker evaluating Black targets because they used a positiveness criterion for these targets in an attempt to appear nonprejudiced. We noted that correla-tions between ITB and attribution of traits were not signifi-cant, that is, the tendency to say “yes” to positive traits for Black people and “no” for White people, and vice versa for negative terms, did not correlate with ITB. However, to test our hypothesis that ITB is independent from a tendency to positiveness, we analyze the correlations between ITB and internal and external motivations to control prejudice (Plant & Devine, 1998). If ITB is the result of a person’s tendency not to appear prejudiced, it should be correlated with moti-vations to control prejudice. On the contrary, if these corre-lations do not emerge, it would demonstrate that ITB is independent from such a tendency.
This study also analyzes alternative hypotheses to explain the differential latency time in the impression formation. In previous studies we show that ITB systematically correlates with homogeneity. This association could suggest that ITB is a mere epiphenomenon of homogeneity; that is, participants are faster to form an impression of Black targets because spending less time doing so would be a mechanic effect of outgroup homogeneity. If this is true, the correlation between ITB and homogeneity should remain significant when we control for racism, which is a well-documented predictor of negative attitudes and behaviors toward Black people. To address this issue, we measured explicit racial beliefs long before the application of the experiment, in an unrelated study. We expect racism to be correlated with ITB. And we also expect that ITB and homogeneity will no longer be asso-ciated when the effect of racism is controlled, indicating that the ITB–homogeneity link is explained by underlying racial beliefs, that is, the more racism, the more people homoge-nize Black targets and invest more time forming impressions of White relative to Black targets.
Method
Participants. Participants were 100 White university students (57% male). Participants’ ages ranged from 16 to 54 years (M = 24.57, SD = 7.27).
Procedure. The study was carried out in two phases. In the first phase, participants responded to a racism scale. The sec-ond phase was carried out 3 months later when people were likely not to remember the first phase and not to consider the existence of a link between the two phases. During this sec-ond phase, participants went through the ITB measure and answered a measure of motivation to control prejudice. Then, participants were fully debriefed and tested for suspicion.
Racial Beliefs Scale. Participants answered the 7-item ver-sion of the racism scale developed by Vala, Pereira, and Costa-Lopes (2009). This scale measures beliefs concerning the biological nature of differences between groups (e.g., “The human species is divided into racial groups that are very dif-ferent from each other”; “The mixture of difdif-ferent human groups may weaken the biological evolution of the human species”; “Biological characteristics of all racial groups are typically human” [reversed]; “Our racial nature should be mixed with the characteristics that define the nature of other racial groups” [reversed]; for the theoretical background, see Fredrickson, 2002). Participants indicated the degree of agreement with those statements on a 7-point scale (1 = total disagreement to 7 = total agreement). A factorial analysis indicates that only one factor was extracted (explained vari-ance = 52%, eigenvalue = 3.66, loadings varying from .63 to .86). Therefore, we computed a reliable composite measure (α = .88), where higher scores indicate stronger racism.
Impression formation task. Participants were invited to take part in an impression formation task similar to one described in Study 1. In this experiment they evaluated six targets
(three Whites and three Blacks). Each photograph was asso-ciated with eight adjectives (four positive and four negative). Only nonstereotypical traits were used.
Measure of homogeneity. Because of the number of targets and the categorical nature of the answers, a different index of homogeneity was used in this study. The homogeneity score on a given trait was computed using the proportion of mem-bers of a category associated with this trait. The measure of homogeneity is the absolute difference between this propor-tion and a constant (.50) that represents the maximum of het-erogeneity. Accordingly, across traits, higher sums of the differences mean greater homogeneity of the targets. Like in previous studies, this procedure was followed for positive traits, negative traits, and Black and White targets.
Motivation to control prejudice’s measures. We used Plant and Devine’s (1998) Internal And External Motivation to Respond Without Prejudice Scales (1 = total disagreement to 7 = total agreement; internal motivation, α = .70, external motivation, α = .76).
Results
ITB. A 2 (target: Whites vs. Blacks) × 2 (trait valence: positive vs. negative) ANOVA on the log-transformed laten-cies was carried out. Replicating previous studies (see the first panel of Table 6), there was a significant main effect of the targets, F(1, 99) = 7.02, p < .001, η2
p= .07. As in previous
studies, participants invested more time forming impression of White targets (M = 1.97 s, SD = 1.29) than Black targets (M = 1.87 s, SD = 1.26), indicating an ITB effect. No other effect was significant (Fs < 1.00). As in previous studies, we computed the ITB index (White latencies minus Black
latencies) indicating that the higher the scores more partici-pants invested time to evaluate White than Black targets.
Homogeneity. ANOVA results indicated a reliable main effect of valence, F(1, 99) = 12.72, p < .001, η2
p= .11. The
targets were more homogenized on negative traits (M = 1.57, SD = 0.39) than on positive traits (M = 1.46, SD = 0.37). Importantly, replicating previous studies (see the second panel of Table 6), there was a main effect of the type of tar-get, F(1, 99) = 8.51, p < .01, η2
p= .08, with Black targets
being more homogenized (M = 1.56, SD = 0.38) than White targets (M = 1.47, SD = 0.38). Therefore, we computed the homogeneity index (Black homogeneity minus White homo-geneity), indicating that the higher the scores, the higher the homogeneity of Black relative to White targets.
Attribution of traits. We found a reliable main effect of valence, F(1, 99) = 122.77, p < .001, η2
p= .55, that was qualified
by the interaction between targets and valence, F(1, 99) = 29.78, p < .001, η2
p= .23. More positive traits were attributed
to Blacks (M = 2.80, SD = 1.17) than to Whites (M = 2.24, SD = 1.32), F(1, 99) = 25.90, p < .001, η2
p= .21, whereas
more negative traits were attributed to Whites (M = 1.02, SD = 1.08) than to Blacks (M = .59, SD = 0.81), F(1, 99) = 22.85, p < .001, η2
p= .19. These findings follow the pattern found
in previous studies (see the third panel of Table 6). We also computed the valence of the impression formation index, which represents the extent to which participants said “yes” more frequently to positive than negative traits for Black people and they said “no” more frequently to positive than to negative traits for White people.
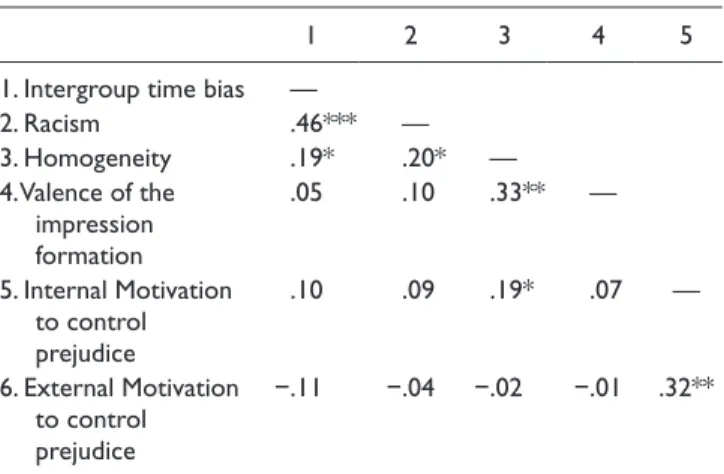
Correlations. Table 7 shows the correlation matrix of mea-sures. As predicted, ITB, racism, and homogeneity are posi-tively correlated. Importantly, ITB does not correlate with the motivation to control prejudice scales nor with valence of impression formation. We also regressed the ITB scores on other measures and the interaction between internal and external motivation scales (see Table 8). As predicted, the analysis of estimated parameters shows that only racism pre-dicts reliably the ITB, indicating that ITB–homogeneity asso-ciation is not significant after controlling for the racism effect.
Discussion
Results clearly replicated previous studies. Participants invested more time forming impressions of White than Black targets and homogenized the former less than the lat-ter. This study had two additional aims: (a) to verify the relations between (internal and external) motivation to con-trol prejudice and ITB and (b) to verify the association between ITB and racism. As predicted, ITB is highly corre-lated with beliefs about differences between groups, espe-cially about the biological origins of these differences. On the contrary, ITB is not associated with motivation to control prejudice, which clearly refutes the alternative explanation based on that motivation. Importantly, results also refute the alternative hypothesis explaining ITB as an epiphenomenon Table 6. Means and Standard Deviations (in Parentheses) of the
Latencies (in Seconds), Homogeneity, and Attribution of Traits (Study 3) Targets Whites Blacks Latencies Positive 1.98 1.87 (1.43) (1.29) Negative 1.93 1.88 (1.19) (1.28) Homogeneity Positive 1.44 1.48 (0.41) (0.44) Negative 1.50 1.64 (0.45) (0.43) Attribution of traits Positive 2.24 2.80 (1.33) (1.17) Negative 1.02 0.59 (1.08) (0.81)
of homogeneity. In fact, the correlation between investing more time forming impressions of White relative to Black targets and forming a more homogenized impression of Black targets can be explained by racial beliefs underlin-ing these two processes.
Study 4
This study aims to replicate the previous studies and explore whether the ITB effect also emerges in a minimal-group context. If the ITB is a specific phenomenon of racialized relations, participants should spend more time forming impressions of White than Black targets but should not spend more time forming impressions of minimal ingroup versus outgroup targets. Instead, if the ITB is a more gen-eral ingroup time bias, participants should spend more time forming impressions of both White and minimal ingroup tar-gets than of Black and minimal outgroup tartar-gets. Moreover, if the ITB emerges with minimal groups, one can conclude that it is not the result of a positivity bias toward Black targets motivated by self-presentational norms.
Method
Participants. Participants were 40 White university stu-dents (24% male; mean age = 21.25, SD = 5.13).
Procedure and measures. This study was carried out in two phases. The order of the phases was counterbalanced between participants.1 In one phase, participants formed impressions
of Black and White targets (i.e., impression formation in a racialized context). Eight pretested photos of males (four of Black people, four of White people) and eight nonstereotypi-cal traits (four positive, four negative) were used.
In the other phase, participants were categorized alleg-edly on the basis of their painting preferences, into the Klee or the Kandinsky group, and formed impressions of ingroup and outgroup members (i.e., impression formation in a min-imal-group context). The participants completed one block of 10 trials in which they carried out the Klee-Kandinsky painting preference task. In each trial, participants saw one pair of paintings on the computer screen and were led to believe that the paintings were made by either Klee or Kandinsky. They indicated their preference by pressing a key on the response box whereupon they received feedback indi-cating that they were a member of the group that preferred Klee because they showed a clear preference for Klee’s paintings. Then, they were asked to form an impression of people who also preferred Klee’s paintings (ingroup) and of people who preferred Kandinsky’s paintings (outgroup). Eight new pretested photos of White people (four ingroup members, four outgroup members) were used. Impression formations were based on eight traits (four positive, four negative) used in the other phase. The measures were: time latencies, trait attributions, and homogeneity and were com-puted as in Study 3.
Results
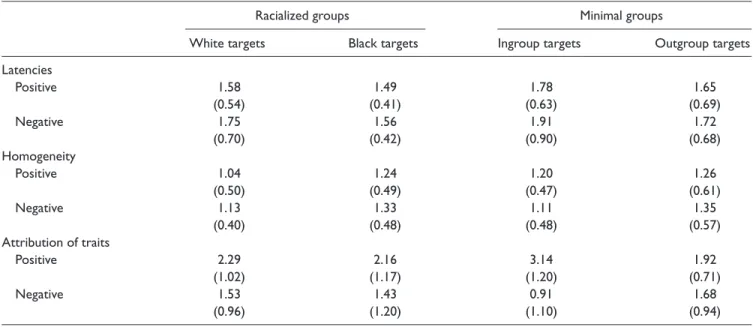
ITB. A 2 (impression formation task: racialized group vs. minimal group) × 2 (target: ingroup vs. outgroup) × 2 (trait valence: positive vs. negative) within-subject ANOVA on the log-transformed latencies showed a reliable main effect of the valence, F(1, 39) = 6.44, p < .05, η2
p= .14. Participants
spent more time attributing negative (M = 1.74s, SD = 0.58) than positive (M = 1.63s, SD = 0.50) traits. Importantly, the main effect of the target was reliable, F(1, 39) = 16.84, p < .001, η2
p = .30. Participants spent more time forming an
impression of ingroup (pooled White and minimal ingroup members, M = 1.75s, SD = 0.57) than outgroup (pooled Black and minimal outgroup members, M = 1.61s, SD = 1.50) targets. It is also important that the target effect was not qualified by the Task × Target interaction, indicating that the ITB effect occurred both in the racialized and minimal-group impression formation tasks. In fact, participants spent more time forming impressions of White (M = 1.66s, SD = 0.54) than of Black (M = 1.53s, SD = 0.43) targets, F(1, 39) = 4.47, p < .05, η2
p = .10, and more time forming impressions of Table 7. Correlation Matrix of the Measures (Study 3)
1 2 3 4 5
1. Intergroup time bias —
2. Racism .46*** — 3. Homogeneity .19* .20* — 4. Valence of the impression formation .05 .10 .33** — 5. Internal Motivation to control prejudice .10 .09 .19* .07 — 6. External Motivation to control prejudice −.11 −.04 −.02 −.01 .32** *p < .05. **p < .01. ***p< .001.
Table 8. Regression Analysis Predicting the Intergroup Time Bias
(Study 3)
Intergroup Time Bias
Predictors Beta
Racism .43***
Homogeneity .09
Valence of the impression formation −.04
IMS .10
EMS −.13
IMS × EMS .01
Model information Adj. R2 = .19
F(6, 93) = 4.94, p < .001 IMS = internal motivation scale; EMS = external motivation scale. ***p < .001.
minimal ingroup (M = 1.84s, SD = 0.74) than minimal out-group (M = 1.69s, SD = 0.66) targets, F(1, 39) = 13.99, p < .001, η2
p= .26. The other main or interaction effects were
also not reliable (see the first panel of Table 9).
Homogeneity. Only the main target effect was significant, F(1, 39) = 10.31, p < .01, η2
p = .21. The other main or
inter-action effects were not reliable (see the second panel of Table 9). The target effect indicated that participants homog-enized more outgroup (pooled Black and minimal outgroup members, M = 1.30, SD = 0.40) than ingroup (pooled White and minimal ingroup members, M = 1.12, SD = 0.29) targets. The absence of any reliable interaction between task and tar-get demonstrates that participants homogenized more Black (M = 1.28, SD = 0.44) than White (M = 1.08, SD = 0.35) tar-gets, F(1, 39) = 6.81, p < .01, η2
p = .15, and they also
homog-enized more minimal outgroup (M = 1.32, SD = 0.54) than minimal ingroup (M = 1.16, SD = 0.41) targets, F(1, 39) = 3.72, p = .06, η2
p = .09.
Attribution of traits. We found a reliable three-way interac-tion effect between task, target and valence, F(1, 39) = 23.29, p < .001, η2
p = .37 (see the third panel of Table 9). Thus, we
analyzed the attribution of traits to targets in each task sepa-rately. In the racialized impression formation task, only the main effect of the valence was reliable, F(1, 39) = 7.85, p < .01, η2
p = .17, indicating that, in general, participants
attrib-uted more positive (M = 2.22, SD = 0.91) than negative (M = 1.48, SD = 0.90) traits. In the minimal-group impression for-mation task, there was a reliable Target × Valence interac-tion, F(1, 39) = 23.81, p < .001, η2
p = .30. Simple effects
showed the classical ingroup favoritism and outgroup dero-gation. In fact, participants attributed more positive traits to the ingroup (M = 3.14, SD = 1.20) than to the outgroup (M = 1.92, SD = 0.71), F(1, 39) = 27.91, p < .001, η2
p = .42, and
they attributed more negative traits to the outgroup (M = 1.68, SD = 0.94) than to the ingroup (M = 0.91, SD = 1.10), F(1, 39) = 13.70, p < .001, η2
p = .26.
Correlations. The ITB is positively correlated with homo-geneity (pooled racialized and minimal group impression formation, r = .37, p < .05). This correlation was reliable in the minimal-group context (r = .35, p < .05) and was margin-ally reliable in the racialized context (r = .29, p = .07). Importantly, the correlation between the ITB and the valence of impression formation (i.e., the extent to which partici-pants attributed more positive traits to Black than to White targets and more negative traits to White than to Black tar-gets) was not significant in the racialized context (r = .13, ns). However, in the minimal-group context, the correlation between the ITB and the attribution of traits (i.e., the extent to which participants attributed more positive traits to ingroup than to outgroup and more negative traits to outgroup than to ingroup members) was marginally reliable (r = .30, p = .06). This indicates that in a minimal-group context the ITB is related to ingroup favoritism with regard to trait attribution.
Discussion
This study replicates the previous studies by demonstrating that White participants spent more time forming impressions of White than Black targets. Importantly, the results go further by showing that the ITB also occurred in a minimal-group context; that is, participants spent more time forming impres-sions of ingroup than outgroup members. The ITB in the minimal groups shows that this phenomenon is not the result of self-presentational norms. In fact, in this context, motiva-tion to control prejudice was not activated as demonstrated by ingroup favoritism in relation to trait attribution.
Table 9. Means and Standard Deviations (in Parentheses) of the Latencies (in Seconds), Homogeneity, and Attribution of Traits (Study 4)
Racialized groups Minimal groups
White targets Black targets Ingroup targets Outgroup targets
Latencies Positive 1.58 1.49 1.78 1.65 (0.54) (0.41) (0.63) (0.69) Negative 1.75 1.56 1.91 1.72 (0.70) (0.42) (0.90) (0.68) Homogeneity Positive 1.04 1.24 1.20 1.26 (0.50) (0.49) (0.47) (0.61) Negative 1.13 1.33 1.11 1.35 (0.40) (0.48) (0.48) (0.57) Attribution of traits Positive 2.29 2.16 3.14 1.92 (1.02) (1.17) (1.20) (0.71) Negative 1.53 1.43 0.91 1.68 (0.96) (1.20) (1.10) (0.94)
General Discussion
The research program presented here analyzed a central issue in social relations: the amount of time people spend evaluat-ing other people. Within the framework of intergroup rela-tions (Tajfel, 1982; Tajfel & Tarner, 1979), taking time to be a fundamental social resource and considering the impor-tance of impression formation processes in everyday life, we specifically analyzed the time people spend judging White and Black targets. Participants had to evaluate White and Black targets, judging whether (positive or negative) person-ality traits were appropriate to characterize them. Over four experiments, decisions were significantly slower for White targets than for Black targets, indicating a clear bias in the time spent judging ingroup and outgroup targets, that is, an ITB. The fact that participants are also slower to form impres-sions of minimal ingroup targets (Study 4) indicates the general tendency to invest more resources in ingroup than outgroup members (see Dovidio & Gaertner, 2010, for a review). Indeed, these studies show that participants invest time in ingroup and outgroup members in a differentiated and nonrandom way.
Concerning the results obtained for the ITB in the racial-ized context, in all studies the faster the participants made their judgments, the more they treated Black targets as being more interchangeable than White targets or deprived them of their complete individuality; that is, they homogenized more Black than White targets. Furthermore, in Study 1, ITB cor-related significantly with an implicit measure of prejudice. Study 3 also showed significant correlations with explicit measures of racism taken months beforehand.
We should consider the hypothesis that observers responded quicker to Black people than to White people because Black stereotypes might be more accessible; that is, participants are faster with Black targets because the adjectives are more eas-ily applied to them. Because such an alternative explanation takes stereotyping into account, one would expect a correla-tion between targets and the degree of stereotyping of the traits concerned. People may be faster with words that are stereotypical of the targets and slower with counterstereo-typical traits. The results of Study 2 showed this was not the case. Consequently, an explanation based on the stereotyp-ing process is inadequate.
A second alternative explanation was also examined. It was tested whether people are faster to make “yes” judgments (see Smith, Fazio, & Cejka, 1996), particularly with regard to the attribution of traits to Black people. The results showed that this was not, in fact, the case. ITB scores are independent of the nature of the answer (“yes” or “no”) because no reli-able correlation existed between the ITB and the explicit attri-bution of traits to targets. Thus, the ITB effect cannot be reliably explained by the participant’s response tendency. More specifically, in four studies we found no correlation between the ITB and the valence of the impression formation,
showing that ITB is not a result of a positivity bias toward Black people.
A third and more plausible explanation may be based on the motivation to appear unprejudiced (Plant & Devine, 1998). Spending less time evaluating Black than White peo-ple, particularly where positive traits are concerned, could indicate that participants are trying to appear unprejudiced. Study 3, however, showed that this explanation is not valid. Indeed, the absence of a reliable relation between ITB and implicit and explicit motivation to control prejudice strongly indicates that the time participants spent forming impres-sions of the targets was independent of their motivation to appear nonprejudiced. Study 4 went further by demonstrat-ing that the ITB is not a phenomenon that is specific to racial-ized relations since it also emerged in a minimal-group context when no representation about the target group had been previously formed. Thus, the ITB is not a result of self-presentation norms.
Finally, the consistent correlation between the ITB and homogenization could suggest that the ITB is a mere epi-phenomenon of homogenization. However, the results of Study 3 showed that this is not the case because that correla-tion disappeared when we controlled for the effect of racial beliefs.
Theoretical Contributions
The results of our studies follow a tradition in the social psychology of prejudiced attitudes that has identified the psychological meaning of time people spend forming an impression (e.g., Brewer, 1988; Fiske & Neuberg, 1990). We should note that if the literature about person perception has focused on time bias in impression formation of a target, no studies so far addressed this bias when the person-target is categorized as White or Black or as an ingroup or outgroup member of a nonsocially sensitive category (minimal groups). Thus, the results presented here move the analytical focus of time bias in impression formation from interpersonal to intergroup level. Importantly, the literature about stereotyping has shown that people react quicker when confronted with stereotypical traits and slower when they should use non- or counterstereotypical traits. But our study suggests a different effect: Participants spend more time evaluating or judging ingroup than outgroup members inde-pendent of the stereotypicality of the traits.
Indeed, our results go further in that they analyze the time people spend directly evaluating Black and White targets. For instance, Wittenbrink et al. (2001) showed that people are quicker to recognize a group of letters as a stereotypi-cally White person’s word after being subliminally primed with the word Whites and are quicker to recognize Black ste-reotypes after being primed with the word Blacks. It has also been demonstrated that people are quicker to recognize the positive valence of a word after being primed with a photo of
a White person than a Black person. They are also quicker to recognize the negative valence of a word after being primed with a photo of a Black person (e.g., Fazio et al., 1995) or with the word Blacks (e.g., Dovidio, Evans, & Tyler, 1986). The role time plays in establishing implicit associations between Black and White targets and valenced words in a stimuli-categorization task (e.g., Greenwald, McGhee, & Schwartz, 1998) has also been studied. Nonetheless, even if all of these studies have shown time bias to be a function of the nature of the stimuli and the way they are categorized (for a review, see Fazio & Olson, 2003), they did not analyze the time spent doing a task that involves direct evaluation of White and Black targets. Moreover, the ITB links together the phenomenon of ingroup favoritism, the importance of time in contemporary social relations, and impression formation processes in intergroup contexts.
Nevertheless, the correlations between ITB and implicit prejudice (Study 1), ITB and explicit racial beliefs (Study 3), and ITB and homogenization (Studies 1, 2, 3, and 4) strongly indicate that in a racialized context, ITB is more than a mere intergroup bias. First, ITB can be seen as a genuine indicator of prejudice. The fact that Black targets were evaluated faster than White targets can indicate the former had already been prejudged to a greater extent than the latter. This idea is coherent with the very nature of the word prejudice. In fact prejudice comes from the Latin praejudicium (prae – judicium), that is, an anticipated or already-made judgment. In this sense, the more a target is prejudged, the quicker the evalu-ation of that target will be. Second, the correlevalu-ation between ITB and homogenization may indicate ITB is related to a particular kind of outgroup inferiorization in the context of racial relations, such as depersonalization. For instance, Tajfel (1981, p. 274) defines depersonalization as an inter-group bias characterized by the action of members of a inter-group toward members of another group that “ignores the individ-ual differences between them,” a position “that frequently precedes dehumanisation.” Similarly, the concept of deper-sonalization was also proposed by Kelman (1976, p. 301) as a dimension of the dehumanization process, which consists of not recognizing a person “as an individual, independent and distinguishable from others, capable of making choices.”
Limitations and New Research Directions
The aim of this research was to identify ITB in the context of racial relations and to examine its association with already-known ways of outgroup inferiorization such as homogeniza-tion, prejudice, and racial beliefs (Correia, Vala, & Aguiar, 2007; Pereira, Vala, & Costa-Lopes, 2010). But Study 4 went beyond the Black–White paradigm and showed that the ITB could also occur within a minimal-group context, indicating the possible pervasiveness of this phenomenon. However, our aim was neither to describe the possible mediating factors underlying ITB nor to analyze it in more natural settings.
New research should now examine the mediating factors between the categorization of the targets and the time spent evaluating these targets. It is possible that ITB is mediated by attention, in line with the assumptions of Fiske and Neuberg’s (1990) impression formation model. But is also likely that the ITB expresses motivational factors such as the greater degree of interest shown by the ingroup than by the outgroup (Tajfel & Turner, 1979). Moreover, in racial-ized relations, the ITB can be mediated by aversion, as identified in Gaertner’s (1973) seminal study of Black or White people asking for help by telephone: Liberal White participants hung up quicker when talking to Black callers than they did when talking to White callers. In our evalua-tive task, aversion could underlie the time people spend as a function of the targets’ skin color. Importantly, it will be necessary to analyze whether the mediating factors are the same in both the racialized and the minimal-group contexts.
Significantly, ITB can have actual consequences in sev-eral contexts where social judgements and decision making are crucial. In this respect, one can study the impact of ITB on the treatment of White and Black students in schools, on the accuracy with which the professional competence of White and Black people is analyzed, and on the time spent identifying people suspected of crimes. The ITB should also be studied in the context of medical diagnoses, where it has been shown that doctors spend a mean time of only about 20 s listening to patients’ concerns (see Beckman & Frankel, 1984; Langewitz et al., 2002; Marvel, Epstein, Flowers, & Beckman, 1999). This amount of time could be even less when patients are outgroup members, as in the case of Dalila Mimouni at the Gregorio Marañón Hospital in Madrid.
Acknowledgments
We would like to thank Teresa Garcia-Marques, Charles Judd, John Dovidio, Daniël Wigboldus, Emanuele Castano, Rui Costa-Lopes, Denis Sindic, and Ricardo Rodrigues for providing helpful comments on earlier versions of this article. We also thank Richard Gramzow and two anonymous reviewers for their helpful sugges-tions and criticisms.
Declaration of Conflicting Interests
The author(s) declared no potential conflicts of interest with respect to the research, authorship, and/or publication of this article.
Funding
The author(s) disclosed receipt of the following financial support for the research, authorship, and/or publication of this article: This work was partially supported by a grant of the Foundation for Science and Technology (FCT, Portugal) awarded to Jorge Vala (PTDC/PSI/69009/2006) and by a grant of the CAPES, Ministry of Education, Brazil, awarded to the second and third authors.
Note
1. Preliminary analysis showed no reliable main or interaction effects involving the order of the task. Thus, this variable was omitted from the subsequent analysis.
References
Abelson, R. P., Dasgupta, N., Park, J., & Banaji, M. R. (1998). Perceptions of the collective other. Personality and Social Psy-chology Review, 2, 243-250.
Allen, B. P. (1996). African Americans’ and European Americans’ mutual attributions: Adjective generation technique (AGT) ste-reotyping. Journal of Applied Social Psychology, 26, 884-912. Bargh, J. A., & Thein, R. D. (1985). Individual construct
accessibil-ity, person memory, and the recall-judgment link: The case of information overload. Journal of Personality and Social Psy-chology, 49, 1129-1146.
Barone, D. F., Maddux, J. E., & Snyder, C. R. (1997). Social cogni-tive psychology: History and current domains. New York, NY: Plenum.
Becker, G. S. (1965). A theory of the allocation of time. Economic Journal, 75, 493-517.
Beckman, H. B., & Frankel, R. M. (1984). The effect of physician behavior on the collection of data. Annals of Internal Medicine, 101, 692-696.
Brewer, M. B. (1988). A dual process model of impression forma-tion. In T. K. Srull & R. S. Wyer (Eds.), Advances in social cognition (pp. 1-36). Hillsdale, NJ: Erlbaum.
Brewer, M. B., & Feinstein, A. S. H. (1999). Dual processes in the cognitive representation of persons and social categories. In S. Chaiken & Y. Trope (Eds.), Dual process theories in social psychology (pp. 255-270). New York, NY: Guilford.
Correia, I., Vala, J., & Aguiar, P. (2007). Victim’s innocence, social categorization and the threat to the belief in a just world. Journal of Experimental Social Psychology, 43, 31-38.
Dovidio, J. F., Evans, N., & Tyler, R. B. (1986). Racial stereo-types: The contents of their cognitive representations. Journal of Experimental Social Psychology, 22, 22-37.
Dovidio, J. F., & Gaertner, S. L. (2010). Intergroup bias. In S. T. Fiske, D. T. Gilbert, & G. Lindzey (Eds.), The handbook of social psychology (5 ed., Vol. 2, pp. 1084-1121). New York, NY: Wiley.
Fazio, R. H., Jackson, J. R., Dunton, B. C., & Williams, C. J. (1995). Variability in automatic activation as an unobtrusive measure of racial attitudes: A bona fide pipeline? Journal of Personality and Social Psychology, 69, 1013-1027.
Fazio, R. H., & Olson, M. A. (2003). Implicit measures in social cognition research: Their meaning and use. Annual Review of Psychology, 54, 297-327.
Fiske, S. T., Lin, M. H., & Neuberg, S. L. (1999). The continuum model: Ten years later. In S. Chaiken & Y. Trope (Eds.), Dual process theories in social psychology (pp. 231-254). New York, NY: Guilford.
Fiske, S. T., & Neuberg, S. L. (1990). A continuum of impression formation, from category-based to individuating processes: Influences of information and motivation on attention and
interpretation. Advances in Experimental Social Psychology, 23, 1-74.
Fredrickson, G. M. (2002). Racism: A short history. Princeton, NJ: University Press.
Gaertner, S. L. (1973). Helping behavior and discrimination among liberals and conservatives. Journal of Personality and Social Psychology, 25, 335-341.
Greenwald, A. G., McGhee, D. E., & Schwartz, J. L. K. (1998). Measuring individual differences in implicit cognition: The implicit association test. Journal of Personality and Social Psy-chology, 74, 1464-1480.
Jahoda, G. (1999). Images of savages: Ancient roots of modern prejudice in Western culture. London, UK: Routledge.
Kelman, H. C. (1976). Violence without restraint: Reflections on the dehumanization of victims and victimizers. In G. Kren & L. Rappoport (Eds.), Varieties of psychohistory (pp. 282-314). New York, NY: Springer.
Langewitz, W., Denz, M., Keller, A., Kiss, A., Rüttimann, S., & Wössmer, B. (2002). Spontaneous talking time at start of con-sultation in outpatient clinic: Cohort study. British Medical Journal, 325, 682-683.
Leclerc, F., Schmitt, B. H., & Dubé, L. (1995). Waiting time and decision making: Is time like money? Journal of Consumer Research, 22,110-119.
Leyens, J.-P., Paladino, P. M., Rodriguez-Torres, R., Vaes, J., Demoulin, S., Rodriguez-Perez, A., & Gaunt, R. (2000). The emotional side of prejudice: The attribution of secondary emo-tions to ingroups and outgroups. Personality and Social Psy-chology Review, 4, 186-197.
Linder, S. B. (1970). The harried leisure class. New York, NY: Columbia University Press.
Maass, A. (1999). Linguistic intergroup bias: Stereotype perpetua-tion through language. Advances in Experimental Social Psy-chology, 31, 79-121.
Marvel, M. K., Epstein, R. M., Flowers, K., & Beckman, H. B. (1999). Soliciting the patient’s agenda: Have we improved? Journal of the American Medical Association, 281, 283-287. Neuberg, S. L., & Fiske, S. T. (1987). Motivational influences on
impression formation: Outcome dependency, accuracy-driven attention, and individuating processes. Journal of Personality and Social Psychology, 53, 431-444.
Pereira, C., Vala, J., & Costa-Lopes, R. (2010). From prejudice to discrimination: The legitimizing role of perceived threat in discrimination against immigrants. European Journal of Social Psychology, 40, 1231-1250.
Pereira, C., Vala, J., & Leyens, J.-P. (2009). From infra-humanization to discrimination: The mediation of symbolic threat needs egal-itarian norms. Journal of Experimental Social Psychology, 45, 336-344.
Pettigrew, T. F., & Meertens, R. W. (1995). Subtle and blatant preju-dice in Western Europe. European Journal of Social Psychology, 25, 57-75.
Plant, E. A., & Devine, P. G. (1998). Internal and external motiva-tion to respond without prejudice. Journal of Personality and Social Psychology, 75, 811-832.
Smith, E. R., Fazio, R. H., & Cejka, M. A. (1996). Accessible attitudes influence categorization of multiply categorizable objects. Journal of Personality and Social Psychology, 71, 888-898.
Tajfel, H. (1981). Human groups and social categories. Cambridge: University Press.
Tajfel, H. (1982). Social psychology of intergroup relations. Annual Review of Psychology, 33, 1-39.
Tajfel, H., Billig, M., Bundy, R. P., & Flament, C. (1971). Social categorization and intergroup behaviour. European Journal of Social Psychology, 1, 149-178.
Tajfel, H., & Turner, J. C. (1979). An integrative theory of inter-group conflict. In W. G. Austin & S. Worchel (Eds.), The social psychology of intergroup relations (pp. 33-47). Monterey, CA: Brooks/Cole.
Vala, J., Pereira, C., & Costa-Lopes, R. (2009). Is the attribution of cultural differences to minorities an expression of racial prejudice? International Journal of Psychology, 44, 20-28. Wittenbrink, B., Judd, C. M., & Park, B. (2001). Evaluative
ver-sus conceptual judgments in automatic stereotyping and prejudice. Journal of Experimental Social Psychology, 37, 244-252.