UNIVERSIDADE DE TRÁS-OS-MONTES E ALTO DOURO
Effect of essential oil of Myrtus communis L. and Rosmarinus officinalis L. on growth control of Listeria monocytogenes in fresh cheese
Master’s Thesis Segurança Alimentar
ANA CATARINA COSTA DA SILVA
3
JÚRI DE APRECIAÇÃO
________________________________________
(Professor Doutor José António de Oliveira e Silva)________________________________________
(Professora Doutora Maria da Conceição Medeiros Castro Fontes)________________________________________
(Professor Doutor José Manuel Marques Martins de Almeida)O Orientador
________________________________________
(Professora Doutora Cristina Maria Teixeira Saraiva)Co-orientador
________________________________________
(Professor Doutor José Manuel Marques Martins de Almeida)5
Acknowledgments
I am forever indebted to my academic supervisors, Prof. Dra. Cristina Saraiva and Prof. Dr. José Almeida, for their enthusiasm, guidance, and unrelenting support throughout this work.
My family, especially my parents and sister, has been a constant source of aid.
To my all friends, especially Bárbara Silva, Lauriana Vieira, Flávia Mendes and Mónica Costa, thank you for your understanding and encouragement in many moments of my life.
6
Contents
Acknowledgments ... 5 List of Figures ... 10 List of Tables ... 11 List of Abbreviations ... 13 Abstract ... 14 Resumo ... 16 Chapter I. Introduction ... 19 1. Introduction ... 19 2. Cheese production ... 202.1. Process cheese manufacturing ... 20
2.2. Acidification ... 22 2.3. Coagulation ... 22 2.4. Ripening ... 23 2.5. Physical parameters ... 24 2.5.1. aw ... 24 2.5.2. pH ... 24 3. Microorganisms in cheese ... 25 3.1. Deteriorative microorganisms ... 25 3.1.1. Total mesophilic ... 25
3.1.2. Lactic acid bacteria (LAB) ... 25
3.1.3. Enterobacteriaceae ... 26 3.1.4. Pseudomonas spp. ... 26 3.1.5. Fungi ... 27 3.2. Pathogenic microorganisms ... 28 3.2.1. Listeria monocytogenes ... 28 3.2.2. Staphylococcus aureus ... 29
7 4. Essential oils ... 29 4.1. Myrtus communis L. ... 31 4.2. Rosmarinus officinalis L. ... 32 5. Biological activities ... 32 5.1. Antimicrobial activity ... 33 5.2. Antioxidant activity ... 33 6. Chemical composition ... 33 6.1. Terpenes ... 34 6.1.1. Monoterpenes ... 35 6.1.2. Sesquiterpenes ... 35 6.2. Aromatic compounds ... 36 6.3. Terpenoids ... 36
7. Methods in food analysis... 36
7.1. Classical methods of analysis ... 36
7.1.1. Enzymatic methods of analysis (ELISA) ... 36
7.1.2. DNA-based technology ... 37
7.1.3. Chromatographic techniques ... 38
7.2. Spectroscopic methods ... 38
7.2.1. FTIR ... 38
7.2.2. MIR and NIR ... 38
7.2.3. Raman spectroscopy ... 39
Chapter II. Objectives ... 41
1. Objectives ... 41
Chapter III. Materials and Methods ... 42
Chapter III. Materials and Methods ... 43
1. Essential oils ... 43
8
1.2. Extraction of essential oils ... 43
1.3. Color ... 43
1.4. Fourier Transform Infrared Spectroscopy (FTIR) ... 43
1.5. Gas Chromatography-Mass Spectroscopy (GC-MS)... 44
1.6. Antimicrobial activity ... 44
2. Production of fresh cheese ... 45
3. Inoculation of Listeria monocytogenes in fresh cheese ... 46
3.1. Inoculum preparation ... 46
3.2. Storage conditions and samplings ... 46
4. Microbiological analysis ... 47
4.1. Preparation of dilutions ... 47
4.2. Counting of microorganisms ... 47
4.2.1. Total Mesophilic ... 47
4.2.2. Lactic acid bacteria (LAB) ... 47
4.2.3. Enterobacteriaceae ... 47 4.2.4. Pseudomonas spp. ... 48 4.2.5. Fungi ... 48 4.2.6. Listeria monocytogenes ... 48 5. Physicochemical analysis ... 48 5.1. pH ... 48 6. Statistical analysis ... 48
Chapter IV. Results and Discussion ... 51
Chapter IV.I. Characterization of essencial oil’s ... 51
1. Essential oil yield ... 51
a) Essential oil yield of Myrtus communis L. ... 51
9
2. Minimum inhibitory concentration of essential oils of Myrtus communis L. and
Rosmarinus officinalis L. ... 52
3. Color of leaves and berries of Myrtus communis L. ... 53
4. Fourier Transform Infrared Spectroscopy (FTIR) ... 54
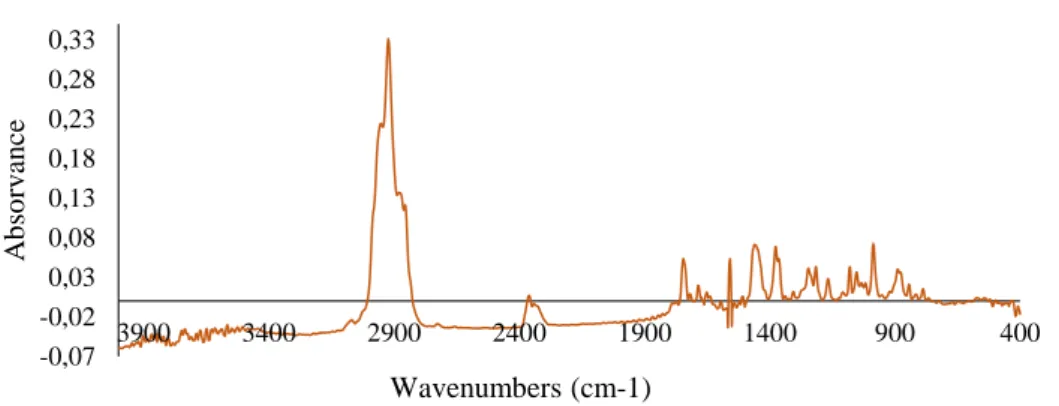
a) Infrared spectrum of essential oil of Myrtus communis L. ... 54
b) Infrared spectrum of essential oil of Rosmarinus officinalis L. ... 56
5. Discriminant analysis ... 58
5.1. Discriminant analysis of essential oil of Myrtus communis L. ... 58
a) Ripening ... 58
b) Place of harvest ... 62
6. Gas chromatography-mass spectrometry ... 64
7. pH and aW ... 71
Chapter IV.II. Effect of essential oils in cheese ... 71
1. Microbiological analysis ... 71
1.1. Total Mesophilic ... 71
1.2. Lactic acid bacteria ... 73
1.3. Enterobacteriaceae ... 75
1.4. Fungi ... 77
1.5. Listeria monocytogenes ... 79
Chapter V. Conclusion ... 83
10
List of Figures
Figure 1. Schematic flow chart of the basic steps involved in process cheese
manufacture. ... 21
Figure 2. Leaves and berries of Myrtus communis L.. ... 31
Figure 3. Flower of Rosmarinus officinalis L. ... 32
Figure 4. Leaves of Rosmarinus officinalis L. ... 32
Figure 5. Prodution of fresh cheese. ... 45
Figure 6. Infrared spectrum of essential oil leaves of Myrtus communis L... 55
Figure 7. Infrared spectrum of essential oil berries of Myrtus communis L. ... 55
Figure 8. Infrared spectrum of essential oil of Rosmarinus officinalis L. ... 56
Figure 9. Infrared spectrum of essential oil of rosemary flower from the first harvest.. 57
Figure 10. Infrared spectrum of essential oil of rosemary flower from the second harvest. ... 57
Figure 11. Overlap of infrared spectra of Rosmarinus officinalis L. obtained in FTIR. 58 Figure 12. Graph of the observations obtained by discriminant analysis for the different berries harvests using the spectral variables. ... 59
Figure 13. Graph of the observations obtained by discriminant analysis for the different harvests of leaves using the spectral variables. ... 60
Figure 14. Graph of the observations obtained by discriminant analysis for the different localizations of harvest using the spectral variables. ... 62
Figure 15. Time evolution of total mesophilic for control and samples with Myrtus communis (MC) or Rosmarinus officinalis (RO) essential oils (EO). ... 72
Figure 16. Time evolution of lactic acid bacteria (LAB) for control and samples with Myrtus communis (MC) or Rosmarinus officinalis (RO) essential oils (EO)... 74
Figure 17. Time evolution of Enterobacteriaceae for control and samples with Myrtus communis (MC) or Rosmarinus officinalis (RO) essential oils (EO). ... 75
Figure 18. Time evolution of Fungi for control and samples with Myrtus communis (MC) or Rosmarinus officinalis (RO) essential oils (EO). ... 77
Figure 19. Time evolution of Listeria monocytogenes for control and samples with Myrtus communis (MC) or Rosmarinus officinalis (RO) essential oils (EO)... 80
11
List of Tables
Table 1. Taxonomy of essential oil producing plants (Adapted from Raut and Karuppayil,
2014). ... 30
Table 2. The functions of monoterpenes (Adapted from Bakkali, Averbeck, & Idaomar, 2008). ... 35
Table 3. The functions of sesquiterpenes (Adapted from Bakkali et al.,2008). ... 36
Table 4. Essential oils yield of Myrtus communis L... 51
Table 5. Essential oils (EO) yield of Rosmarinus officinalis L. ... 52
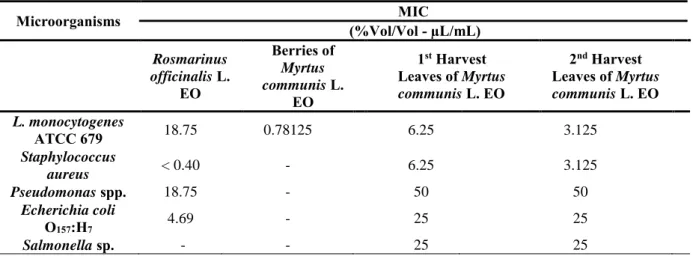
Table 6. Minimum inhibitory concentration (MIC) of essential oils of Myrtus communis L. and Rosmarinus officinalis L. ... 52
Table 7. Effect of harvest time on the L*a*b* parameters of Myrtus communis L. leaves and berries... 54
Table 8. Confusion matrix for the estimation sample of berries essential oils of Myrtus communis L. ... 59
Table 9. Confusion matrix for the cross-validation results of berries essential oils of Myrtus communis L. ... 60
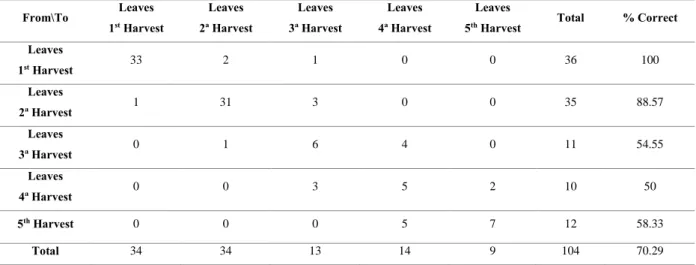
Table 10. Confusion matrix for the estimation sample of essential oils of leaves from Myrtus communis L. ... 61
Table 11. Confusion matrix for the cross-validation results of essential oils of leaves from Myrtus communis L. ... 61
Table 12. Confusion matrix for the estimation sample of EO's of Myrtus communis L. in different localizations. ... 63
Table 13. Confusion matrix for the cross-validation results of EOs of Myrtus communis L. in different localizations. ... 63
Table 14. Volatile profile of Myrtus communis L. essential oil obtained from leaves and berries from two different locals and harvests... 65
Table 15. Volatile profile of Myrtus communis L. essential oil obtained from leaves and berries from two different locals and harvests (continuation). ... 66
Table 16. Volatile profile of Myrtus communis L. essential oil obtained from leaves and berries from two different locals and harvests (continuation). ... 67
Table 17. Volatile profile of Rosmarinus officinalis L. essential oil obtained from leaves and flowers from two different harvests. ... 69
12
Table 19. Essential oil and time effects in the Total Mesophilic counts obtained in cheese samples. ... 73 Table 20. Essential oil (EO) and time effects in the Lactic acid bacteria (LAB) counts obtained in cheese samples. ... 74 Table 21. Essential oil (EO) and time effects in the Enterobacteriaceae counts obtained in cheese samples... 76 Table 22. Essential oil (EO) and time effects in the Fungi counts obtained in cheese samples. ... 78 Table 23. Essential oil (EO) and time effects in the Listeria monocytogenes counts obtained in cheese samples. ... 81
13
List of Abbreviations
ATR – Attenuated Total Reflectance
aw – Water activity
BHI – Brain Heart Infusion
DA – Discriminant Analysis
DNA – Deoxyribonucleic Acid
ELISA – Enzyme-linked immunosorbent assay
EO – Essential oil
FTIR – Fourier Transform Infrared Spectroscopy
GC – Gas Chromatography
GC-MS – Gas Chromatography-Mass Spectroscopy
IR – Infrared
HPLC – High-Performance Liquid Chromatography
LAB – Lactic Acid Bacteria
MIC – Minimum Inhibitory Concentration
MIR – Mid-Infrared Spectroscopic
NIR – Near-Infrared Spectroscopic
EO – Essential Oil
PC – Principal Component
PCA – Plate Count Agar
PCR – Polymerase Chain Reaction
TM – Total Mesophilic
14
Abstract
The main aim of this study was to evaluate the antimicrobial effect of essential oils (EO) of aromatic herbs in fresh sheep cheese inoculated with L. monocytogenes. In the control samples, total mesophilic microorganisms, lactic acid bacteria (LAB), Enterobacteriaceae and Fungi were analyzed, and pH and aw were also measured.
The essential oils were obtained from plants harvested at different times and in different locations. Their antimicrobial effect against different bacteria was tested in vitro.
Fresh leaves and berries of Myrtus communis L. were collected at Trás-os-Montes, in September, October, November and December of 2015 and January of 2016. Fresh leaves and flowers of Rosmarinus officinallis L. were collected at Trás-os-Montes, in October, November and December of 2015. Dried leaves, flowers and berries were separately submitted to hydrodistillation using a Clevenger-type apparatus.
The chemical composition of EOs was determined by gas chromatography mass spectrometry (GC-MS) analysis and the spectra in the infrared region was measured by (Fourier Transform Infrared Spectroscopy) FTIR.
In local A, the myrtle leaves EO in 1st harvest presented 44 volatile compounds and in 2nd harvest a total 62 compounds were identified. The myrtle berries EO in 1st harvest presented 43 compounds and in 2nd harvest samples a total 53 compounds were identified. In local B, the main difference in myrtle EO was obtained in 2nd harvest with of total compounds identified, 49 and 50 respectively for leaves and berries.
A total of 25 volatile compounds were identified by GC-MS accounting for 95.10% of the rosemary EO of the 1st harvest, while for the 2nd harvest were determined 24 compounds, corresponding to 97.55% of the total compounds.
The MIC values for the essential oil leaves of Myrtus communis L. were 6.25 and 3.125 µL/mL, respectively 1st and 2nd harvest, against Listeria monocytogenes. Regarding the EO of Rosmarinus officinalis L., a value of 18.75 µL/mL was obtained against Listeria monocytogenes, showing a lower antimicrobial effect than myrtle EO.
The myrtle EO showed MIC of 25 µL/mL for E. coli O157: H7 and Salmonella sp., except Pseudomonas spp. for which it presented a MIC of 50 µL/mL.
15
For total mesophilic, samples with myrtle EO and rosemary EO had a microbial load at 672 hours of 7.96 log cfu/g and 9.47 log cfu/g, respectively. The myrtle EO has a greater effect on the inhibitory of microorganisms compared to rosemary EO.
For LAB, samples with myrtle EO and rosemary EO had a microbial load at 672 hours of 8.07 log cfu/g and 8.95 log cfu/g, respectively. It can be concluded that myrtle EO is more effective in microbial reduction of LAB.
For Enterobacteriaceae, samples with myrtle EO and rosemary EO have not showed microbial load until 672 hours with a microbial load of 7.14 and 8.19 log cfu/g, respectively at this time.
Fungi had a microbial load at 672 hours of 6.87 log cfu/g and 7.21 log cfu/g, for samples with myrtle EO and rosemary EO, respectively.
Myrtle EO and rosemary EO samples showed a slight growth of Listeria monocytogenes from 72 hours to 336 hours, followed by a decrease from 336 hours to 672 hours with a microbial load of 4.72 log cfu/g to 4.54 log cfu/g and 5,30 log cfu/g for 5.05 log cfu/g, respectively.
EO can be used as control strategies to avoid L. monocytogenes proliferation, specially in food matrix that can support them patogen growth such as fresh cheese.
Keywords: Cheese; Essential oil; FTIR; GC-MC; Myrtus communis L; Listeria
16
Resumo
O principal objetivo deste trabalho consistiu na avaliação do efeito antimicrobiano de óleos essenciais de plantas aromáticas em queijo fresco de ovelha inoculado com L. monocytogenes. Nas amostras controlo foram analisados microrganismos mesófilos totais, Bactérias do Ácido Lático (BAL), Enterobacteriaceae e Fungos e foi efetuada também a medição de pH e aw.
Os óleos essenciais foram obtidos a partir de plantas colhidas em diferentes momentos e em diferentes locais. O seu efeito antimicrobiano relativamente a diferentes bactérias foi testado in vitro.
Recolheram-se folhas e bagas frescas na região de Trás-os-Montes durante Setembro, Outubro, Novembro e Dezembro de 2015 e Janeiro de 2016 de Myrtus communis L.. Recolheram-se folhas e flores frescas na região de Trás-os-Montes durante Outubro, Novembro e Dezembro de 2015 de Rosmarinus officinalis L. As folhas e bagas secas foram submetidas a hidrodestilação com o aparelho de Clevenger.
A composição química dos EOs foi determinada por cromatografia gasosa e espectrometria de massa (GC-MS) e os espetros de absorção foram medidos na região de infravermelho através de FTIR.
No local A, para a 1ª colheita de EO de folhas de Myrtus determinou-se 44 compostos e na 2ª colheita determinou-se 62 compostos. Para a 1ª colheita de EO de bagas de Myrtus determinou-se 43 compostos, enquanto na 2ª colheita determinou-se 53 compostos. No local B, a principal diferença foi obtida para EO de Myrtus na 2ª colheita com um total de 49 e 50 compostos identificados para folhas e bagas respetivamente.
No EO de flor de alecrim na 1ª colheita determinou-se 25 compostos que correspondem a 95,10% dos compostos totais, enquanto na 2ª colheita determinou-se 24 composto que correspondem a 97,55% dos compostos totais.
O óleo essencial de flor de alecrim apresenta uma percentagem inferior de compostos antimicrobianos em relação ao óleo essencial de alecrim, tendo um menor efeito inibitório face a microrganismos deteriorativos e patogénicos.
Listeria monocytogenes apresentou valores de MIC para as folhas de EO de Myrtus communis L. para a 1ª e 2ª colheita de 6.25 e 3.125 µL/mL, respectivamente. Em relação ao OE de Rosmarinus officinalis L., Listeria monocytogenes obteve-se um valor
17
mais elevado de 18.75 µL/mL comparativamente com o OE de murta. O OE de Murta apresentou valores MIC de 25 µL/mL para E. coli O157:H7 e Salmonella, exceto
Pseudomonas spp. que foi de 50 µL/mL.
Para as amostras com OE de murta e alecrim, as analises microbiológicas para mesófilos apresentaram uma carga microbiana de 7.96 log ufc/g e 9.47 log ufc/g, respetivamente, às 672 horas.
Relativamente às BAL, as amostras com OE de murta e alecrim apresentaram uma carga microbiana às 672 horas de 8.07 ufc/g e 8.95 ufc/g, respetivamente. Pode-se concluir que o OE de murta apresenta maior inibição microbiana.
Para Enterobacteriaceae, nas amostras com OE de murta e alecrim não foram detetadas contagens desta população até às 672 horas, verificando-se uma carga microbiana de 7.14 e 8.19 log ufc/g, respetivamente, nesse tempo.
As contagens de Fungos às 672 horas foram de 6.87 e 7.21 log ufc/g para as amostras com EO de murta e alecrim, respetivamente.
O EO de murta e alecrim levaram a uma multiplicação ligeira de Listeria monocytogenes a partir das 72 horas às 336 horas, seguindo-se uma diminuição até as 672 horas com uma carga microbiana de 4.72 para 4.54 log ufc/g e 5.30 para 5.05 log ufc/g, respetivamente.
O óleo essencial pode ser utilizado como estratégia de controlo para evitar a proliferação de L. monocytogenes, especialmente numa matriz alimentar como o queijo fresco, que pode levar à multiplicação deste microrganismo patogénico.
Palavras-chave: Queijo; Óleo Essencial; FTIR; GC-MS; Myrtus communis L.; Listeria
18
19
Chapter I. Introduction 1. Introduction
Cheese making began about 8000 years ago and now there are in excess of 1000 cheese varieties worldwide, each one unique with respect to it is flavour and form (Sandine and Elliker, 1970).
Cheese was historically manufactured as a farmhouse product on a small scale, it is now produced on a large scale, either for consumption as a food on it is own or as a food ingredient (Everett and Auty, 2008).
Manufacture of most cheese varieties involves combining four ingredients: milk, rennet, microorganisms and salt, which are processed through a number of common steps such as gel formation, whey expulsion, acid production and salt addition, followed by a period of ripening. Variations in ingredient blends and subsequent processing has led to the evolution of all these cheese varieties. While variations in processing parameters such as cook temperature and curd handling techniques play a major role in determining the characteristics of each cheese type, the cheese microbiota play a critical and pivotal role in the development of the unique characteristics of each cheese variety (Beresford et al., 2001).
Cheese means the fresh or cured product of variable consistency obtained by coagulation and desorption of the milk or the whole or partly skimmed milk, even if reconstituted, as well as cream and buttermilk, and a mixture of some or all of them (Moreira, 2011).
Cheese is a very involved microbial ecosystem, and very complex microbiota develops in most cheese varieties. The microbiota plays a major role in cheese ripening, and selection of suitable strains would enable the cheese maker to control or modify flavour development (Beresford et al., 2001).
In the past 20 years, many small and several large foodborne outbreaks linked to consumption of cheese made from unpasteurized milk have occurred, both in Europe and in the U.S. (Brooks et al., 2012).
Fresh and soft cheeses constitute a suitable medium for the growth of many pathogens and have frequently been associated with several foodborne diseases in many countries (Carvalho et al., 2007).
20
Salmonella, Staphylococcus aureus, Listeria monocytogenes and Escherichia coli are considered the most dangerous threats to the food safety of cheeses (Carvalho et al., 2007).
Salmonella outbreaks have been scarce since 2000, only fifteen outbreaks have been reported in the last two decades (Montel et al., 2014). Outbreaks of shigatoxin producing Escherichia coli (O157:H7, 026:H11) have been linked to raw milk and to cheeses made with both pasteurized and unpasteurized milk, due to defective pasteurization and/or post processing contamination (Farrock et al., 2013).
Listeriosis connected with the cheese consumption is very rare (EFSA, 2010) even though it has become the emblematic example of severe illness transmitted by raw milk products. Contamination by Listeria monocytogenes is not specific to raw milk cheeses. Cheeses made from pasteurized milk can be contaminated (EFSA, 2012) due to improper pasteurization or post-pasteurization contamination (Montel et al., 2014).
More than 100 genera and 400 microbial species have been detected in raw milk. They are mainly Gram negative (>90 species), Gram positive and catalase positive bacteria (>90 species), lactic acid bacteria (LAB) (>60 species), yeasts (>70 species) and moulds (>40 species) (Montel et al., 2014).
2. Cheese production
2.1. Process cheese manufacturing
Cheese manufacture is essentially the dehydration of milk in combination with other preservative effects such culturing, acidification, salting, packaging, and refrigeration. The rennet induced milk coagulum is cut and heated to expel moisture in a process termed syneresis. Curds are later drained, salted, and packaged into fresh cheese. The pH continually drops throughout the process to a value between 4.6 and 6.0 for most varieties of cheese (Kalab and Emmons, 1978).
The process of cheese manufacture involves selection of ingredients and preparation of a formulation. In addition to natural cheese and emulsifying salts, there are various other dairy and nondairy (colors, flavors, spices, food gums, mold inhibitors, and so on) ingredients that are used in process cheese manufacture. Several ingredients affect the physicochemical properties, flavour, and the functional properties in different ways.
21
Moreover, the appropriate selection of natural cheese and emulsifying salt is also very important in order to produce cheese with desired final properties (Kapoor and Metzger, 2008).
The manufacturing phase might be defined as those operations performed during the first 24 hours, although some of these operations, e.g., salting and dehydration, may continue over a longer period (Fox et al., 2004).
Although the manufacturing protocol, individual varieties differs in detail, the basic steps are common to most varieties, there are: acidification, coagulation, dehydration, shaping and salting. The degree of dehydration is regulated by the extent and combination of the above five operations. In addition to the chemical composition of the milk (Fox et al., 2004).
In turn, the levels of moisture and salt, the pH and the cheese microbiota regulate and control the biochemical changes that occur during ripening and hence determine the flavour, aroma and texture of the finished product (Fox et al., 2004).
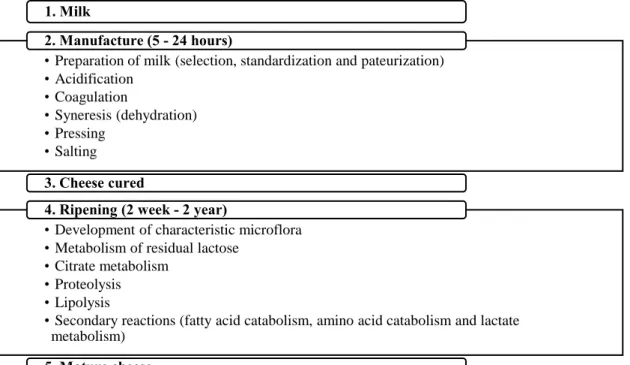
Figure 1. Schematic flow chart of the basic steps involved in process cheese manufacture. 1. Milk
• Preparation of milk (selection, standardization and pateurization) • Acidification • Coagulation • Syneresis (dehydration) • Pressing • Salting 2. Manufacture (5 - 24 hours) 3. Cheese cured
• Development of characteristic microflora • Metabolism of residual lactose
• Citrate metabolism • Proteolysis • Lipolysis
• Secondary reactions (fatty acid catabolism, amino acid catabolism and lactate metabolism)
4. Ripening (2 week - 2 year)
22
2.2. Acidification
One of the basic operation in the manufacture of most cheese varieties is a progressive acidification throughout the manufacturing stage up to 24 hours, and for some varieties during also the early stages of ripening. Acidification starts before and transcends the other manufacturing operations (Moreira, 2011).
Acidification is normally via in it situ production of lactic acid, although pre-formed acid or acidogen is now used to directly acidify curd for some varieties, e.g., Mozzarella and Cottage cheese (Fox et al., 2004).
Until recent times, and still in some cases, especially in artisanal varieties, acid production relied upon the indigenous microbiota of milk (Kalab and Emmons, 1978).
Since this is probably a mixed microbiota, the rate of acid production was unpredictable and growth of undesirable bacteria led to the production of gas and off-flavours. It is now almost universal practice in industrial cheese making to add a culture of selected lactic acid-producing bacteria to raw or pasteurized cheese milk to achieve a uniform and predictable rate of acid production (Moreira, 2011, Fox et al., 2004).
For cheese varieties that are cooked to not more than 40ºC, a starter consisting of Lactococcus lactis subsp. lactis and/or Lc. lactis subsp. cremoris is normally used while cultures of Streptococcus thermophilus and a Lactobacillus spp. culture alone is used for varieties that are cooked to higher temperatures, e.g., Swiss and hard Italian varieties (Fox et al., 2004).
Acid productions at the appropriate rate and time is the key step in the manufacture of good quality cheese (Fox et al., 2004)
2.3. Coagulation
The essential characteristic step in the manufacture of all cheese varieties is coagulation of the casein component of the milk protein system to form a gel, which entraps the fat, if present (Fox et al., 2004).
Coagulation may be achieved by:
23 - Acidification to pH ~4.6;
- Acidification to about pH 5.2 in combination with heating to ~90ºC (Fox et al., 2004).
2.4. Ripening
Ripening is a step where the cheese is kept under certain controlled temperature and relative humidity conditions, when numerous microbiological, biochemical, physical and chemical modifications occur (Fox et al., 2004).
Salting has a great influence on the final stage of production which is maturation, since if it is not well conducted, it can seriously affect the microbiological and enzymatic characteristics of cheeses and be the cause of several defects in them. Salt use to extend shelf life began in prehistory and is one of the more classic methods used in food preservation (Fox et al., 2004).
The most common methods of salting are the addition of salt in milk, brine and dry. The salt simultaneously performs number of important functions - enhances and enhances the taste, and masks strange flavors. The salt attenuates the dairy flavor of fresh curd and masks lipolysis; Helps in the formation of the cheese bark by surface dehydration, promotes by the modification of the osmotic pressure, the syneresis of the mass, stimulating the expulsion of serum and the reduction of the humidity of the cheese, because it favors the liberation of the water free of the mass. When entering the cheese mass, the salt uses the free water for its dissolution and part of this water is displaced to the shell in order to maintain the osmotic equilibrium, eventually losing itself externally. The salting also helps to control the development and microbial activity, providing a selection of the cheese microbiota, in addition to that the enzymatic activity in cheeses is strongly controlled by the presence of lipases and proteases are more active in contents of 0.5 to 2.5% salt (Fox et al., 2004, Moreira, 2011).
At maturation level, higher levels of salt tend to slow it down, so normally the cheeses are salted only when they reach a suitable fermentation, otherwise, there will be inhibition of the bacteria used as ferments (Fox et al., 2004).
Finally, salt contents higher than 5% favor the solubilization of maturation at casein due to calcium and sodium changes. Protein enhances its interaction with water,
24
making it less available for biochemical processes causing a decrease in water activity during maturation, leading to changes in texture, solubility and probably protein conformation (Paula et al., 2009).
2.5. Physical parameters
A number of physical parameters control the growth of microorganisms in cheese during ripening, including water content, salt concentration and pH. The cheese making process influences the extent of variation in these parameters (Jay, 200).
2.5.1. aw
During the first stages of cheese manufacture, aw is ~ 0.99, which supports the growth and activity of the starter culture. However, after whey drainage, salting and during ripening the prevailing aw levels are significantly lower than the optimal requirements of starter bacteria (Beresford et al., 2001).
A decrease in aw during cheese ripening occurs due to water loss by evaporation, salt, and the hydrolysis of proteins to peptides and amino acids and triglyceride to glycerol and fatty acids. Since significant proteolysis occurs in cheese, the unbound moisture level will decrease during maturation (Beresford et al., 2001).
2.5.2. pH
The optimum pH for the growth of most common bacteria is around neutral and growth is often poor at pH values < 5.0. Due to the accumulation of organic acids, cheese curd post-manufacture has a pH ranging between 4.5 and 5.3. Such low pH values will not allow the survival of acid-sensitive species (Beresford et al., 2001).
Mesophilic Lactococcus spp. are capable of reducing the pH of cheese to 4.6 and Lactobacillus spp. to somewhat lower values, e.g., 3.8. The usual ultimate pH of cheese curd falls within the range 4.6-5.1. The level and method of salting have a major influence on pH changes in cheese (Fox et al., 2004).
25
3. Microorganisms in cheese 3.1. Deteriorative microorganisms 3.1.1. Total mesophilic
Total mesophilic are all microorganisms that multiply at temperatures from 20ºC to 45ºC, being an optimum between 30ºC - 40ºC (Jay, 2000).
The total mesophilic microorganisms count is a very important microbiological indicator, functioning as an index of sanitary quality and food safety (Gram et al., 2002).
3.1.2. Lactic acid bacteria (LAB)
Lactic acid bacteria (LAB) are primarily mesophilic (with a few thermophilic strains) and are able to grow in the range 5-45°C (Forsythe, 2010).
LAB is a group of Gram-positive, non-spore forming, catalase and oxidase negative, facultative anaerobes with optimum pH of 4.0 a 4.5 and are proteolytic with fastidious amino acid growth requirements (Ercolini et al., 2010).
The organisms are so called due to their ability to produce lactic acid. The lactic acid may be either or both the L (+) and D (-) isomers. LAB produce a range of antimicrobial factors including organic acids, hydrogen peroxide, nisin and bacteriocins (Forsythe, 2010).
LAB produce four groups of bacteriocins. The best documented and exploited bacteriocin is nisin (class 1 bacteriocin) which is a post-translationally modified amino acid (also known as a lantibiotic). Nisin is produced by Lactococcus lactis subsp. lactis and has a broad inhibitory spectrum against Gram-positive bacteria. It is formulated (concentration range 2.5-100 ppm) into a range of food products including cheeses, canned foods and baby foods and is particularly stable in high acid foods (Forsythe, 2010).
The genera that are part of the LAB group are Lactobacillus, Lactococcus, Leuconostoc, Pediococcus and Streptococcus (Jay, 2000).
The species of Lactobacillus (Lactobacillus sakei, Lactobacillus curvatus, Lactobacillus algidus, Lactobacillus fuchuensis, Lactobacillus oligofermentans) are associated with acidification, formation of off-odors and viscosity. Some Enterococcus
26
species (Enterococcus viikkiensis, Enterococcus hermanniensis) are also found in decayed meats but in smaller quantities (Françoise, 2010).
3.1.3. Enterobacteriaceae
Enterobacteriaceae is a family of bacteria consisting of gram-negative, oxidase-negative bacilli, facultative anaerobes with fermentative-type metabolism that do not form spores. This family of bacteria is ubiquitous, being naturally present in fecal residues, can also be found in soil and water. Some members are often found in fresh and frozen foods such as beef, pork and other meats (Castellano et al., 2004).
Some species of Enterobacteriaceae are mesophilic, but the psychrotrophic ones are mainly responsible for the deterioration as they multiply at refrigeration temperatures (Jay, 2000).
This family contains some relevant pathogenic genera such as Salmonella and E. coli O157: H7 and deteriorating genera such as Serratia, Enterobacter, Pantoea, Proteus and Hafnia (Doulgeraki et al., 2011).
3.1.4. Pseudomonas spp.
The genera Pseudomonas spp. is a group of gram-negative, mobile, non-spore forming and mostly aerobic bacilli. They are gram-negative, aerobic bacilli, present flagella (are mobile), oxidase and catalase positive, optimum pH below 4.5 and aw below 0.97 (Jay, 2000).
Their classification has changed since the division by Palleroni et al. (1973) in which this genus was subdivided into 5 groups according to the similarities of rRNA and DNA-DNA hybridization studies (Huis in't Veld, 1996).
Despite the taxonomic changes, the most relevant species involved in the deterioration of the meat are in Group I that includes Pseudomonas aeruginosa, Pseudomonas fragi, Pseudomonas lundinensis, Pseudomonas fluorescens, Pseudomonas putida, Pseudomonas chlororaphis, Pseudomonas cichorii, Pseudomonas viridiflava and Pseudomonas syringae. Of these species, Pseudomonas fragi is considered the most
27
present in decayed meats (incidence between 56.7% and 79.0%), followed by P. lundinensis (Jay, 2000).
Pseudomonas spp. constitute the most common bacterial genera found in fresh foods. These bacteria are typical of soil and water and are globally distributed by foods especially vegetables, meat and shellfish, and the group of bacteria is more important in the case of deterioration of fresh chilled foods since many species are psychrotrophic (Jay, 2000).
3.1.5. Fungi
Fungi constitute one of the largest groups of organisms with about 100 000 known species. However, in the food industry only 50 species are frequently found (Ercolini et al., 2009).
Moulds and yeasts develop in a wide variety of environments (plants, soil, water, animal products, etc.). Their wide ubiquity is due to the ability to use a wide variety of substrates such as carbohydrates, organic acids, proteins and lipids and to be tolerant to low pH and aw values, low temperatures and the presence of preservatives (Hawksworth, 2015).
Moulds are filamentous fungi that develop rapidly and have a high resistance to heat when sporulated. They multiply at pH values between 1.5 - 11, but do not multiply to aw values less than 0.80. The most common moulds genera in the deterioration of fresh products are Rhizopus, Mucor and Aspergillus, which are the origin of the formation of mucus on its surface (Jay, 2000).
The yeasts have a rounded or elongated shape with cream, pink or red colors. They have a faster development than molds, grow at pH values between 2.5-8.5 and do not grow at aw values below 0.88 (Jay, 2000).
According to Jay (2000), the yeasts most found are of the genus Candida. While molds require O2 to grow, yeasts develop both in their presence and absence. The deterioration caused by molds and yeasts is characterized by the formation of large colonies, usually pigmented, superficial viscosity, fermentation of sugars with acid production, gas and development of unpleasant odors (Huis in't Veld, 1996).
28
3.2. Pathogenic microorganisms 3.2.1. Listeria monocytogenes
Listeria monocytogenes is a short bacillus (with a length of 0.4μm to 2μm) Gram-positive, not sporulated and mobile due to the presence of peritrichal flagella. This bacteria is catalase positive, oxidase negative and do not produce H2S. In blood agar,
Listeria monocytogenes presents incomplete β-hemolysis, which allows to distinguish this species from others belonging to the same genus (Farber and Peterkin, 1991; Jay, 2000).
It exhibits optimum growth at a temperature of approximately 37 ° C, although it multiplies over a wide range of temperatures, from 1 °C to 45 °C. The pH between 6 and 8 is the most suitable, but also pH of 4.1 and 9.6 can be tolerated. Microorganisms can overcome the low pH inhibitory effect through the development of adaptive mechanisms, surviving a water activity as low as 0.92 (Farber and Peterkin, 1991; Jay, 2000).
Listeria monocytogenes has shown capable of long-term survival in environmental and food matrices. In addition, L. monocytogenes is able of growing at refrigeration temperature and have good tolerance to acidic, alkaline, and high salt media (Guo et al., 2016). As a facultative anaerobic bacterium, is able to tolerate various food packaging conditions (Jay, 2000).
Listeria monocytogenes is an ubiquitous food-borne human pathogenic bacterium that present a significant public health risk (Engelhart et al., 2016).
Listeria monocytogenes was first recognized as a foodborne pathogen subsequent to a series of listeriosis outbreaks implicating various types of foods in the 1980s (Farber and Peterkin, 1991). The majority of the listeriosis outbreaks have been linked to certain RTE foods with extended storage time (Kramarenko et al., 2016).
Listeriosis can result in 25-30% rate of mortality between the infected individuals (Ramswamy et al., 2007; Swaminathan & Gerner-Smidt, 2007).
Certain groups within the general population are particularly susceptible to infection, e.g. neonates, pregnant, elderly and cellular immuno-compromised individuals (Mateus et al., 2014).
29
3.2.2. Staphylococcus aureus
Staphylococcus aureus is a widely distributed Gram-positive bacterium with approximately 0.5 to 1.5 μm in diameter, stable, sporulated and generally non-encapsulated. It presents positive catalase test. This bacterium can occur in several forms, ranging from isolated, in pairs, to short chains, or irregularly grouped (looking like a bunch of grapes) (Wertheim et al., 2005).
The distribution of S. aureus is very broad, since this bacterium is significantly resistant to desiccation and cold, and can remain viable for long periods. Generally, this genus is part of the microbiota of normal human skin and other anatomical sites, such as nasal passages, throat, intestines and skin (Jay, 2000).
S. aureus is an important cause of foodborne disease around the world, which is caused by ingestion of foods that contain one or more thermostable enterotoxins pre-formed by S. aureus. Several identified staphylococcal enterotoxins identified as A, B, C1, C2, C3, D, E, G, H and I were identified by serological methods (Bhatia and Zahoor, 2007).
It has been one of the major foodborne and iatrogenic pathogens involved in a variety of dangerous diseases including septicemia, osteomyelitis, pneumonia, toxic shock syndrome and endocarditis (Lowy, 1998; Gorwitz et al., 2008; Yang et al., 2016).
Among Staphylococcus aureus isolates, methicillin-resistant S. aureus (MRSA) represents the major cause of antibiotic-resistant HAIs, accounting for 16.7% of isolates in Europe (Campilane et al., 2015).
4. Essential oils
EO’s are produced by more than 17,000 aromatic plant species commonly belonging to angiospermic families Lamiaceae, Rutaceae, Myrtaceae, Zingiberaceae and Asteraceae (Prakash et al., 2015).
Essential oils are aromatic oily liquids obtained from plant material (flowers, buds, seeds, leaves, twigs, bark, herbs, wood, fruits and roots) (Burt, 2004).
30
These naturally occurring antimicrobials have extensive histories of their use in foods and they can be identified from various components of the plants leaves, barks, stems, roots, flowers and fruits (Calo, et al., 2015).
EO’s have often a pleasant odour and sometimes a distinctive taste and are therefore used in significant amounts in the flavouring and perfume industries. EO’s are usually prepared by fragrance extraction techniques such as distillation (including steam distillation), cold pressing or extraction (maceration) (Calo et al., 2015).
In Table 1 are presented the essential oils with origin in some plants families.
Table 1. Taxonomy of essential oil producing plants (Adapted from Raut and Karuppayil, 2014).
Plant family Plant species
Apiaceae Carum nigrum; Anethum graveolens Aptum graveolens; Foeníulum vulgare Pimpinella ansíum; Cumínum cymínum Corríandrum satívum
Asteraceae Artemísia judaíca; A. annua; A. Absinthíum; A. Dracunculus
Geraniaceae Lamiaceae/Labiateae
Pelargonium graveolens
Origanum vulgare; Melissa officinalis;
Salvia officinalis; Mentha sp.; Mentha
Longifolia; M. piperita; M. spicata; Ocimum basilicum; O. sanctum; Rosmarinus officinalis;
Lavandula officinalis; Lavandula sp.; Salvia sclarea
Lauraceae Liliaceae Myrtaceae
Cinnamomum sp. Allium sativum; Allium cepa
Syzigium aromaticum; Thymus vulgaris;
Thymus sp.; Melaleuca alternifolia; Eucalyptus globulus; Myristica fragrans
Oleaceae Piperaceae Pinaceae Poaceae
Jasminum sp.; Olea europaea Piper nigrum
Cedrus libani
Cymbopogon martini; Cymbopogon citrates; Cymbopogon nardus
Rutaceae Rosaceae Santalaceae Zingiberaceae Citrus sp.; C. paradise Rosa sp.
Santalum sp.; Santalum album
31
4.1. Myrtus communis L.
Common myrtle belongs to the Myrtaceae family, which comprises approx. 145 genera and over 5500 species (Aleksic & Knezevic, 2014).
Figure 2 shows leaves and berries of Myrtus communis L. in Trás-os-Montes
(2015).
Figure 2. Leaves and berries of Myrtus communis L..
It is an evergreen shrub or small tree, 1.8–2.4 m in height, with small foliage and deep fissured bark and their leaves are 3–5 cm (Aleksic & Knezevic, 2014).
Myrtle grows as wild in several regions all over the world (Rahimmalek et al., 2013). It is traditionally used as an antiseptic, disinfectant drug and hypoglycemic agent (Chryssavgi et al., 2008).
Myrtus communis L. is one of the important aromatic and medicinal species from the Myrtaceae family (Wannes et al., 2010). Different parts of the plant find various uses in the food industry, such as for flavouring meat and sauces, and in the cosmetic industry (Wannes et al., 2010).
The large variability in the chemical composition of its essential oils is still a stimulating factor for many researchers to carry out specific studies (Zermane et al., 2014).
32
4.2. Rosmarinus officinalis L.
Rosmarinus officinalis L. is a well-known evergreen shrub with a characteristic aromatic odour. It is a member of the important Labiatae family (Lamiaceae), which comprises up to 200 genera and about 3500 species, and it is naturally found in all of the coastal regions of the Mediterranean Sea (Gurbuz et al., 2016).
Figures 3 and 4 shows flowers and leaves of Rosmarinus officinalis L. in
Trás-os-Montes (2015).
From the different species (Rosmarinus officinallis, Rosmarinus eriocalyx, Rosmarinus lavandulaceus and Rosmarinus laxiflorus), only Rosmarinus officinalis grows naturally in the Mediterranean (Angioni et al., 2004; Zaouali, et al., 2010).
The essential oil and the extract of rosemary can be obtained for application in food packaging, aromatherapy and medicine treatment (Ribeiro-Santos et al., 2015).
5. Biological activities
Leaves, berries and flowers are sources of essential oil that have medicinal properties, including antimicrobial and antioxidant activities (Bajalan and Pirbalouti, 2014).
The antimicrobial or other biological activities of EO’s are directly correlated to the presence of their bioactive volatile components (Calo et al., 2015).
33
5.1. Antimicrobial activity
Several researchers have proposed that the antimicrobial action of EO’s may be attributed to their ability to penetrate through bacterial membranes to the interior of the cell and exhibit inhibitory activity on the functional properties of the cell, and to their lipophilic properties. The phenolic nature of EO’s also elicits an antimicrobial response against foodborne pathogen bacteria. Phenolic compounds disrupt the cell membrane resulting in the inhibition of the functional properties of the cell, and eventually cause leakage of the internal contents of the cell (Calo et al., 2015).
The characteristic that most influences the antimicrobial activity of these natural extracts is their high hydrophobicity, which enables them to cross the bacterial membranes and act directly on them, causing loss of ions and reduction of the membrane potential, loss of function of the proton pumps and ATP depletion or damage to proteins, lipids, and organelles present within the bacterial cell causing cell death (Pesavento et al., 2015).
The interaction of EO’s with microbial cell membranes results in the growth inhibition of some gram positive and gram negative bacteria (Calo et al., 2015).
5.2. Antioxidant activity
Several reports described antioxidant activities of different extracts of Myrtus communis L., and certain ingredients implying good benefit for the treatment of diseases related to oxidative stress and various known antioxidants including flavonoids, phenolic acids, tannins and α-tocopherol have been previously isolated from this plant. However, few studies have investigated the antioxidant activity of myrtle leaf extracts (Bouaziz et al., 2015).
6. Chemical composition
Essential oil content and composition of plants may be highly affected by genetic and environmental factors (Rahimmalek et al., 2013).
34
Chemically the EO’s consist of terpene (mono-, sesqui- and diterpenes), alcohols, acids, esters, epoxides, aldehydes, ketones, amines and sulfides compounds (Calo et al., 2015).
Composition of the EOs of any particular plant can be dependent on what part of the plant is used: flowers, green parts (leaves and stems), bark, wood, whole fruits, pericarp or seed only, or roots (Calo et al., 2015).
There are several reports regarding composition of myrtle essential oils in different countries, including Algeria (Bouzabata et al., 2010; Brada et al., 2012), Tunisia (Wannes et al., 2009; Snoussi et al., 2011), Albania (Asllani, 2000), Iran (Pezhmanmehr et al., 2010), Italy (Flamini et al., 2004), Turkey (Cakir, 2004), and Greece (Chryssavgi et al., 2008).
The main constituents of the myrtle essential oil are 1,8-cineole and alpha-pinene. In previous studies, the reported ratio of α-pinene to 1,8-cineole was significantly correlated to the geographical origins of collected plants (Rahimmalek et al., 2013).
6.1. Terpenes
Terpenes form structurally and functionally different classes. They are made from combinations of several 5-carbon-base (C5) units called isoprene. The biosynthesis of the terpenes consists of synthesis of the isopentenyl diphosphate (IPP) precursor, repetitive addition of IPPs to form the prenyldiphosphate precursor of the various classes of terpenes, modification of the allylic prenyldiphosphate by terpene specific synthetases to form the terpene skeleton and finally, secondary enzymatic modification (redox reaction) of the skeleton to attribute functional properties to the different terpenes (Bakkali et al., 2008).
The main terpenes are the monoterpenes (C10) and sesquiterpenes (C15), but hemiterpenes (C5), diterpenes (C20), triterpenes (C30) and tetraterpenes (C40) also exist. A terpene containing oxygen is called a terpenoid (Bakkali et al., 2008).
35
6.1.1. Monoterpenes
The monoterpenes are formed from the coupling of two isoprene units (C10). They are the most representative molecules constituting 90% of the essential oils and allow a great variety of structures (Bakkali et al., 2008).
Table 2. The functions of monoterpenes (Adapted from Bakkali, Averbeck, & Idaomar, 2008).
Carbures
Acyclic: myrcene and ocimene
Monocyclic: terpinenes, p-cimene, phellandrenes Bicyclic: pinenes, -3-carene, camphene, sabinene Alcohols
Acyclic: geraniol, linalool, citronellol, lavandulol, nerol Monocyclic: menthol, alpha-terpinol, carveol
Bicyclic: borneoil, fenchol, chrysanthenol, thuyan-3-ol
Aldehydes Acyclic: geranial, neral, citronellal
Ketone
Acyclic: tegetone
Monocyclic: mnthones, carvone, pulegone, piperitone
Bicyclic: camphor, fenchone, thuyone, ombellulone, pinocamphoone, pinocarvone Esters
Acyclic: linalyl acetate or propionate, citronellyl acetate Monocyclic: menthyl or alpha-terpinyl acetate
Bicyclic: isobornyl acetate
Ethers 1,8-cineole, menthofurane
Peroxydes Ascaridole
Phenols Thymol, carvacrol
6.1.2. Sesquiterpenes
The sesquiterpenes are formed from the assembly of three isoprene units (C15). The extension of the chain increases the number of cyclisations, which allows a great variety of structures (Bakkali et al., 2008).
36
Table 3. The functions of sesquiterpenes (Adapted from Bakkali et al.,2008).
Carbures azulene, β-bisabolene, cadinenes, β-caryophyllene, logifolene, curcumenes, elemenes, farnesenes, zingiberene
Alcohols bisabol, cedrol, β-nerolidol, farnesol, carotol, β-santalol, patchoulol, viridiflorol
Ketones germacrone, nootkatone, cis-longipinan-2,7-dione, β-vetinone, turmerones
Epoxide caryophyllene oxide, humulene epoxides
6.2. Aromatic compounds
Derived from phenylpropane, the aromatic compounds occur less frequently than the terpenes. The biosynthetic pathways concerning terpenes and phenylpropanic derivatives are generally separated in plants but may coexist in some, with one major pathway taking over (see, cinnamom oil with cinnamaldehyde as major and eugenol as minor constituents, also clove oil, fennel, and other) (Bakkali et al., 2008).
The main plant sources for these compounds are anise, cinnamon, clove, fennel, nutmeg, parsley, sassafras, star anise, tarragon, and some botanical families (Apiaceae, Lamiaceae, Myrtaceae, Rutaceae) (Bakkali et al., 2008).
6.3. Terpenoids
The terpenoids are biochemical variation of terpenes via enzymes that add oxygen molecules and move or remove a methyl group. In general, terpenoids have more antimicrobial effect than terpenes (Prakash et al., 2015).
7. Methods in food analysis 7.1. Classical methods of analysis
7.1.1. Enzymatic methods of analysis (ELISA)
Quantitative analytical methods that show antigen–antibody reactions through the color change obtained by using an enzyme linked conjugate and enzyme substrate and that serve to identify the presence and concentration of molecules in biological fluids are generally called enzyme immune tests (Aydin, 2015).
37
This technique involves the cultivation of antibodies or antisera that are capable of binding to a protein of interest, thereby enabling the detection of that protein, both qualitatively and quantitatively (Reid et al., 2006).
The major advantage of this approach is that antibodies or antisera can be manufactured to respond specifically to the protein of interest, thereby enabling recognition and quantitation of that protein exclusively (Reid et al., 2006). The disadvantages of the ELISA approach include the initial difficulty in producing an antibody specific to a particular protein. However, this is a relatively minor difficulty to overcome when the selectivity of the technique is taken into account (Reid et al., 2006).
These assays are available as commercial test kits, being well suited for routine analysis due to their simple use, speed and relative low-cost, but of limited application to processed foods unless they have been developed with antibodies raised against heat treated proteins (Mafra et al., 2007). Recent research using ELISA-based techniques include detecting the presence of meat from different species in food products and the presence of vegetable proteins in milk powder (Reid et al., 2006).
There have also been promising results for the use of ELISA to differentiate milk from different species (Reid et al., 2006).
7.1.2. DNA-based technology
The methods based on DNA analysis have rapidly evolved during last years as excellent alternatives to overcome the limitations of protein analysis (Mafra et al., 2007).
They present several advantages that arise from the ubiquity of nucleic acids in every type of cells and their greater stability than proteins (Mafra et al., 2007).
Most DNA-based methods rely on the polymerase chain reaction (PCR) technique for its specificity, sensitivity, simplicity and rapidity, allowing the identification of species of origin, even in complex and processed foods (Mafra et al., 2007).
The advances on real-time PCR allow quantitative determinations, offering high specificity and sensitivity, reproducibility of results, low level of cross-contamination and reduced time of analysis (Mafra et al., 2007).
38
7.1.3. Chromatographic techniques
Liquid and gas chromatography are capable of separating and enabling identification of almost any type of molecule present in a food sample (Reid et al., 2006).
Liquid chromatography, in particular HPLC, can detect compounds such as proteins, amino acids, phenolic compounds and carbohydrates, while GC is more suited to the analysis of naturally volatile or semi-volatile molecules (Reid et al., 2006).
The principal disadvantage of the two techniques relates to their use in conjunction with chemometrics. There is often a need to extract the specific analytical data relating to individual compounds and this adds to the time and labour required (Reid et al., 2006).
7.2. Spectroscopic methods 7.2.1. FTIR
Fourier Transform Infrared (FTIR) spectroscopy is a powerful tool for biological studies. The Infrared Radiation (IR) is passed through a sample and some of the infrared radiation is absorbed by the sample, but some of it may be passed through (transmitted). The resulting spectrum represents the molecular absorption and transmission, creating a molecular fingerprint for the sample. Like a fingerprint, no two unique molecular structures produce the same IR spectrum. This makes infrared spectroscopy useful for several types of analysis (Darabad et al., 2015).
7.2.2. MIR and NIR
Analysis of a food sample using the MIR spectrum (4000–400 cm-1) reveals information about the molecular bonds present and can therefore give details of the types of molecules present in the food (Reid et al., 2006).
NIR spectroscopy utilizes the spectral range from 14000 to 4000 cm-1 and provides much more complex structural information related to the vibrational behaviour of combinations of bonds. These techniques are suited for use in an industrial setting due to their ease of use and the relatively low financial cost of obtaining and running the equipment (Reid et al., 2006).
39
7.2.3. Raman spectroscopy
Raman spectroscopy is the measurement of the wavelength and intensity of inelastically scattered light from molecules, some of which is scattered at a different wavelength. This inelastically scattered light is called Raman scatter (Reid et al., 2006).
The particular molecule and it is environment will determine what Raman signals will be observed. Raman spectroscopy possesses advantages for the analysis of food samples such as high sensitivity to C=C, CΞC and CΞN bonds, low sensitivity to water and high selectivity to inorganic substances (salts). These advantages result in its potential use for niche applications in the food industry (Reid et al., 2006).
40
41
Chapter II. Objectives 1. Objectives
The main aim of this study is to evaluate the efficacy of essential oils of Myrtus communis L. and Rosmarinus officinalis L. on controlling the growth rate of Listeria monocytogenes inoculated on fresh cheese.
The determination of the minimum inhibitory concentration activity (MIC) of essential oils (EO) against different microorganisms.
Effect of essential oil the deteriorative microorganisms in cheese of samples non-inoculated and characterization the EO for GC-MS and FTIR.
42
43
Chapter III. Materials and Methods
1. Essential oils
1.1. Preparation of samples
Fresh parts of Myrtus communis L. and Rosmarinus officinalis L. were collected in Trás-os-Montes region, in several time slots from September to December 2015.
The samples were washed with distilled water, at least three times, before being dried. The fresh leaves were dried in an oven with forced air circulation at 37ºC for 38 hours, while fresh berries were dried at 37ºC for 48 hours.
After drying the samples were stored at room temperature until use.
1.2. Extraction of essential oils
The samples dry were submit to hydrodistillation in a Clevenger-type apparatus. The biomass, previously weighed, was placed into the round-bottom flask and 350 mL of distillated water was added. The samples were subjected to hydrodistillation for 3–4 hours at constant temperature such as 105ºC. The essential oil was weighed and kept in sealed vials at 3-4ºC for further analysis.
1.3. Color
The color measurement was carried out on leaves and berries samples. Three measurements were performed on each sample. The color measurement was accomplished using a reflectometer Minolta Chromo Meter CR-310 (Minolta, Japan) through the CIELAB color system of L*a*b* (D65 illuminant).
1.4. Fourier Transform Infrared Spectroscopy (FTIR)
Measurement of absorption spectra in the middle infrared (FTIR) instrument with a Shimadzu IR and Solutions Lab program. The resolution was 4 cm-1. Data as collected in the range of 3600-550 cm-1.
44
1.5. Gas Chromatography-Mass Spectroscopy (GC-MS)
Gas chromatography-mass spectrometry (GC-MS) was used to determine the chemical composition of essential oil from Myrtus communis L. and Rosmarinus officinalis L..
GC-MS analysis was conducted using an Agilent 5973 GC-MS coupled to an Agilent 6890 gas chromatograph fitted with a split–splitless injector at 250° C. The separation of volatile compounds was performed on a Thermo Scientific TG-5MS column (60 m x 0.25 x 131 0.25 μm). Helium was used as carrier gas with a 5 mL/min flow. A programmed temperature gradient, starting at 60º C for 10 min, increasing to 280 ºC in a gradient of 10ºC/min, leaving at this temperature for 5 minutes. The transfer line of the mass spectrometer was maintained at 280ºC. The nozzle was adjusted (1:5) to divide, operating at 250ºC and 165kPa. The transfer line temperature and ion source were set to 250ºC. The samples and standards were prepared prior to analysis using n-hexane (Merck) in 1.0% (v/v) and 2.0% (v/v) concentrations, respectively, and the volume injected was 1.0 μL, using an autosampler. The alkanes solution (C5-C18) was analyzed under the same conditions for the calculation of linear retention index or Kovats Index and also some standard references compounds (Sigma - Aldrich, Steinhein, Germany) for confirmation of data. The analysis results of the peak areas of the identified compound were expressed as arbitrary area unit (a.u.) x 106. There were later analyzed by the MSChemStation computer software. The identification of volatile compounds was performed by comparing the Kovats retention indices and linear using NIST/EPA/NIH library (2011) and other libraries and by comparison to reference standards.
1.6. Antimicrobial activity
Minimal inhibitory concentration (MIC) values were determined using a broth microdilution, according to Hajlaoui et al. (2010).
The bacterial inoculums were prepared from 24h broth cultures and suspensions were adjusted to 0.5 McFarland turbidity standards, approximately 1.0x10⁶ CFU/mL. Then, 100 μl of BHI broth, 20 μl of resazurin, 20 μl of inoculums and 100 μl from each
45
concentration of essential oil were added to each well of the 96-well plates. Therefore, the final volume in each well was 240 μl. The plates were incubated at 37 °C for 24 hours.
A negative control was prepared by adding 100 μl of BHI broth, 20 μl of resazurin and 20 μl of inoculums on each well. Also, a positive control was prepared by adding 100 μl of BHI broth and 20 μl of resazurin.
The lowest concentration of the essential oil, which inhibits the growth of microorganisms, is considered as MIC value. In addition, the lowest concentration of essential oil, which leads to a complete absence of growth on Mueller–Hinton agar, was defined as minimum bactericide concentration (MBC) value.
All tests were performed in duplicate.
2. Production of fresh cheese
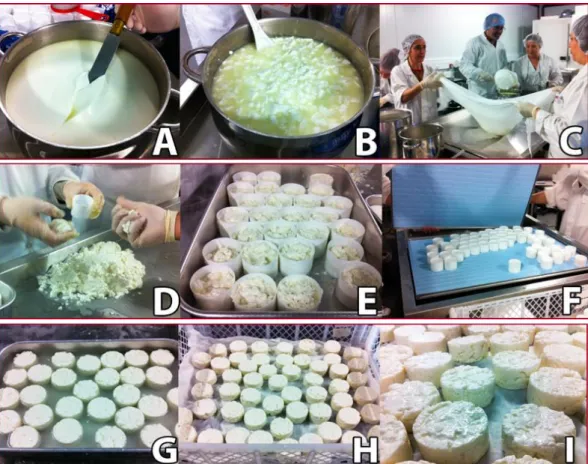
Figure 5 represented of production of fresh cheese.
46
The cheese production was performed with raw sheep's milk.
Initially, the milk is heated in a water bath until it reaches 35ºC. After heating the animal rennet (1.25 ml in 5 liters of milk). The beginning of coagulation formation is observed 5 to 10 minutes after the addition as represented in A. After the formation of the rennet, cutting was carried out and the desorption represented in B. The use of a cloth was used to obtain the maximum serum, represented in C. Proceed to mold the cheese as indicated in D and E. It is then pressed, so that the excess serum is eliminated, it is observed in F. The process of salting the cheese, called brine, the process consists of immersing the cheese in this solution for 20 minutes. After the brine the cheese rests for 10 minutes. After this stage the cheese is ready for the next phase of inoculation.
3. Inoculation of Listeria monocytogenes in fresh cheese 3.1. Inoculum preparation
Listeria monocytogenes strain ATCC 679 was grown in tryptone soya broth (Oxoid, Hampshire, UK) at 30 °C for 18h to achieve a viable cell population of 8 log10 CFU/mL. The culture was then transferred to a sterile centrifuge bottle and centrifuged at 10,000 x g for 10 min at 4°C. The supernatant was decanted and the pellet suspended in sterile 0.1% peptone solution by vortexing. The washing step was repeated twice. Bacterial cell count was determined by optical density (O.D) method at 600 nm, a population of 1x10⁸ cfu/mL. Serial (10-fold) dilutions in 0,9% isotonic saline were performed in duplicate to yield approximately 1x10⁶ cfu/mL. To verify the number of viable Listeria monocytogenes in the suspension, dilutions were spread on Oxford Agar (Biokar Diagnostics BK110) supplemented with OXFORD (Biokar Diagnostics BS003) in duplicate at 37℃ for 48 h.
3.2. Storage conditions and samplings
The samples were stored at 8±1ºC (refrigerator temperature). The experiment was run in three repetitions. Samples were removed from storage for chemical and micro evaluation at 2, 24, 72, 168, 336, 672 hours.
47
4. Microbiological analysis 4.1. Preparation of dilutions
The collection and weighing of the samples was accomplished by aseptically removing, 10 g of each cheese which was diluted in 90 mL of tryptone salt solution (0.3% tryptone and NaCl at 0.85%, sterilized at 121ºC for 15 minutes) and homogenized in stomacher for 90 seconds. Successive decimal dilutions were performed in test tubes containing 9 mL sterile tryptone salt. Afterwards, they were sown by incorporation or at the surface depending on the microorganism and the culture medium.
Colony counting results were expressed as log CFU/g.
4.2. Counting of microorganisms 4.2.1. Total Mesophilic
For TM (ISO 4833, 2013) spreading was made by incorporation of 1 mL of the original suspension and the respective dilutions on PCA (Plate Count Agar). The seeded plates were incubated at 30ºC for 72 h.
4.2.2. Lactic acid bacteria (LAB)
LAB (French Standard V04-503 (AFNOR), 1988) spreading was done by addition of 1 mL of the original suspension and the respective dilution in double layer selective medium MRS (Man Rogosa Sharpe) Agar (Oxoid CM0361). The seeded plates were incubated at 30ºC for 72 h.
4.2.3. Enterobacteriaceae
For Enterobacterieceae (ISO 5552, 1997) spreading was done by addition of 1 mL of the original suspension and the respective dilutions on VRBG selective medium (Violet Red Bile Glucose Agar) (Scharlau 01-295-500) with double layer. The plates were placed at 37ºC and for 24 h.
48
4.2.4. Pseudomonas spp.
For Pseudomonas spp. (French Standard V04-504 (AFNOR), 1988) spreading was done by incorporation of 1 mL of the original suspension and the respective dilutions through selective culture CFC (Cetrimide, Fucidin, Cephaloridine) with Pseudomonas Agar base (OXOID CM0559) and CFC selective supplement (OXOID SR0103). The spread plates were incubated at 25º C for 72 h. After colony counting, 5 colonies were transplanted to nutrient agar and incubated at 30º C for 24 h, then subjected to biochemical characterization of the test oxidase (positive) and by growth aerobically in the middle of kliger (KLIGER Iron Agar) (OXOID CM0033).
4.2.5. Fungi
For fungi (ISO 13681, 2008) spreading was done on the surface of 0.1 mL of the original suspension and the respective dilutions through selective culture GCA (Glucose Chloramphenicol Agar). The plates were placed at 25º C and for 3 to 5 days.
4.2.6. Listeria monocytogenes
For Listeria monocytogenes (ISO 11290, 2014) spreading was done on the surface of 0.1 mL of the original suspension and the respective dilutions through selective PALCAM. The plates were placed at 37ºC for 3 days.
5. Physicochemical analysis 5.1. pH
The pH value was obtained by the arithmetic average of three measurements made with a pH 330i WTW pH meter placed directly in a sample cheese.
6. Statistical analysis
Experimental results were expressed as means +/- standard derivations. Data obtained were subjected to analysis of variance (ANOVA), and pair-comparison within
49
the same group was achieved applying Turkey’s test procedure at P < 0.05, using the software Statistica 12.
50